Linear Spectropolarimetry of Young and
Other Emission Line Stars
London SW7 2AZ, UK 22institutetext: University of Exeter, School of Physics, Stocker Road, Exeter EX4 4QL, UK 33institutetext: University of Leeds, School of Physics & Astronomy, EC Stoner Building,
Leeds LS2 9JT, UK
Linear Spectropolarimetry of Young and
Other
Emission Line Stars
1 Introduction
The aim of this article is to demonstrate the useful role that can be played by spectropolarimetric observations of young and evolved emission line stars that analyse the linearly polarized component in their spectra. At the time of writing, this demonstration has to be made on the basis of optical data since there is no common-user infrared facility, in operation, that offers the desired combination of spectral resolution and sensitivity. If the new ESO instrument, CRIRES, can be characterised to sufficient precision, it may become the first capable of performing such science.
The case for high signal-to-noise (S/N) spectropolarimetry on the largest available telescopes has been made before at an earlier ESO conference (Schmid , Donati ). Because the polarised fraction of the light received from astrophysical sources is often only of the order of 1% or so, it is clear that observations seeking to separate out and characterise this component suffer at least a 5-magnitude disadvantage relative to total light spectroscopy: expressed in S/N terms, one can only begin to achieve anything at S/N approaching 1 000. It was shown by both Schmid et al Schmid and Donati et al Donati that some of the most exciting results, particularly from the analysis of circular-polarised light, will only come as the achievable S/N rises to 100 000.
Here we focus on what can be learned from linear spectropolarimetry alone at reasonably high spectral resolution (R of order 20000 is already valuable) and at S/N. And we remind that the near infrared (1m–2m) has the potential to out-perform the optical as a domain to work in because of the greatly reduced interstellar obscuration at these wavelengths.
2 The astrophysical rewards of higher spectral resolution linear spectropolarimetry
Is the ’waste’ of observing for so long, that the information content of a mere percent or so of the received light can be dragged out of it, worth it? It is, and one can understand how by the following argument.
First, the spatial scales on which stars and their immediate environments (accretion flows, winds, magnetic structures, disks…) are all too often too compact to be directly imaged. This is a state of affairs that will persist even beyond the commissioning of 100 m class telescopes or advanced interferometers aiming to get down to the milli-arcsec scale at OIR wavelengths. Second, spectroscopy aiming to deduce unique geometric and kinematic information from one or more well-resolved spectral line profiles will often run into the sand of information loss due to the essential convolution that underlies spectral line formation – the more complex the line-forming environment, the worse it gets.
In such circumstances, the role of linear spectropolarimetry is its access to a different dimension of information: in particular, linear polarized light is in most cases scattered light, whilst unpolarized light is directly sourced light (e.g. coming directly from the star, or from the surface within a line-forming diffuse gas). It has been recognised for over 40 years that the analysis of linearly-polarised light can provide vital clues to otherwise unresolved geometries. A telling success of the technique was in its role in underpinning the ‘unification’ model of active galactic nuclei A93 .
Here, the discussion centres on applications to young and other emission line stars. The great early success of linear spectropolarimetry in this context was in motivating the now widely-accepted circumstellar disk model for the (still perplexing) classical Be stars PR03 . Our own optical observations of young stellar objects (YSOs), summarised below, were inspired by this example. An important point of contrast between stellar and AGN applications of linear spectropolarimetry is that the former place much higher demands on spectral resolution: emission line widths are on the order of 100 km s-1, and the goal is to trace polarization changes within them.
3 The current optical state of the art

The beginnings of optical high resolution spectropolarimetry, aiming to reveal linear polarization changes within emission line profiles date back to the 1970s (PM77 , MC78 , MCFS ). This was very hard work, verging on the heroic. For example, the H observations of 4 bright classical Be stars obtained by McLean et al (1979) MCFS were the fruit of 3 nights on a 1.54-m telescope: sampled on a bin-size of 0.45 Å the data gave a good, if a little noisy, illustration of a phenomenon common to this object class that is sometimes referred to as ‘depolarization’ (see below). Things have got better.
Jumping two decades, we present an example (Figure 1) illustrating the gain in information to be had from well-resolved high-S/N linear spectropolarimetry. This is an AAT observation of the B[e] star, HD 87643 at H (from OPDW ). It has come out so well both because the target star is optically bright () and the H line profile is relatively broad, with FWHM exceeding 500 km s-1: a resolving power of just 5000 is sufficient for a good result. In this case the polarimetric changes across the line are quite complex. The position angle rotation, in particular, leads to an interpretation in terms of scattering of a compact emission line source by a rotating medium such as a circumstellar disk (cf Wood et al WBF ). In addition HD 87643 affords a good example of what we refer to as the ‘McLean effect’ (described and explained by McLean (1979) M79 ), wherein the P Cygni absorption seen in Stokes I is accompanied by a clear change in the percentage polarization: this can be seen as the line absorption having preferentially removed direct, unscattered starlight from the beam. These data are certainly of a quality that justifies comparison with state-of-the-art radiation transfer modelling, but the number of optically-accessible objects that can be observed to a similar standard is limited, and of necessity smaller than the number accessible at 1m–2m.
4 A particular campaign: probing the circumstellar environments of YSOs
In the past few years we have begun to explore the circumstellar environments (CSM) of YSOs via a sequence of H linear spectropolarimetric observing programmes using 4-metre class telescopes (the AAT and WHT).
The first objective was the relatively limited one of seeing how far the brightest of the optically-accessible YSOs, selected from among the known Herbig Be stars, followed the same polarimetric pattern of behaviour as the classical Be stars PM76 . We saw this as a simple, if statistically-based, way of providing further evidence for or against the concept that even Herbig Be stars remain embedded in circumstellar disks – like classical Be stars. The background to this is that doubt has been expressed that such objects can still be in possession of disks (see e.g. the review by Waters & Waelkens WW98 , and the results of NIR


interferometry presented by Millan-Gabet et al MG01 ). The upshot was that we found ‘depolarization’ across H in 7 out of 12 Herbig Be stars observed (V2002 ). Down to the same sensitivity limit, this is a rate of incidence matching that associated with classical Be stars. The term ‘depolarization’ (illustrated in figure 2) describes a smooth polarization change across the emission line resulting from the combination of (i) intrinsic linear polarization of the stellar continuum due to scattering in a non-spherical CSM, with (ii) no polarization of the line emission which itself forms in the larger CSM, other than by the ISM intervening between YSO and observer that polarizes line and adjacent continuum equally. Our result thus points toward broad comparability between the two object groups and strengthens the case for what are most likely electron-scattering disks around Herbig Be stars.
It was natural to extend this programme down to less massive and luminous Herbig Ae stars to see if the linear polarization signature, attributable to the CSM, remains the same or changes. From the purely observational point of view this extension turned out to be very rewarding in that the proportion of stars showing a clear polarization change across the H line increased relative to the Herbig Be star: 9 out of the 11 Herbig Ae stars observed showed changes, and in every case there was a distinctive position angle flip (cf HD 87643) not generally seen in the Herbig Be stars (see figure 3 and also V2002 ). This behaviour implies intrinsic polarization of some fraction of the H emission itself – most likely due to H emission in the immediate vicinity of the star (magnetospheric accretion?) scattering off a larger rotating CSM (a dust-bearing disk?). The very fact that this

behaviour is so common indicates that, despite a widely held and discouraging impression of great optical depth in the H line in Herbig Ae and T Tau spectra, we nevertheless typically gain a partially unhindered view in this line of the very compact scale of one-to-a-few stellar radii. The view via the less-opaque near-infrared H i lines can only be even better.
At optical (H) wavelengths the T Tau stars, at still lower mass and luminosity, are much more challenging targets for observation. Figure 4 shows H in RY Tau, our best example from this object class to date (V2003 ). To achieve S/N of at least 1000 per sample, the observational requirement is 2 million photons: in RY Tau () we managed half this per resolution element in the continuum at R 9000 in one hour on the WHT. Unfortunately nearly all T Tau stars are a couple of magnitudes or more fainter than this! We are working to gather what data we can from a handful of T Tau stars, using 4-metre telescopes – but, in truth, the need to switch to larger telescopes is reached with this object class. Furthermore, many T Tau stars are significantly reddened and hence much brighter and better tackled at infrared wavelengths.

Finally – what of massive YSOs and other deeply-embedded populations of young objects? We have attempted one or two of these at near-infrared wavelengths using a 4-metre class telescope (CGS4 on UKIRT). Shown as figure 5 is an observation at Pa of the embedded massive YSO, GL 490: it is noisy, it would benefit from higher spectral resolution and yet offers promise by way of what might be a position angle flip across the H i line. The way forward is clear – higher resolution and more photons from a suitable instrument on the VLT or other large telescope.


5 A new age of theoretical modelling
Modelling of the circumstellar environments of YSOs and related objects begins from the general concept that the linearly polarized light component in a spectrum results from scattering within a non-sperical medium. The scatterers may be circumstellar electrons (as is likely for more massive, luminous young objects) or dust (both high- and low-mass YSOs). Although simple analytical treatments of circumstellar scattering have proved to give useful insights into circumstellar geometries (e.g. BM77 , WBF ) more sophisticated modelling, particularly of optically-thick structures and non-idealised geometries, requires a numerical approach. The Monte-Carlo method combined with the high power of today’s desk-top computing provides a straightforward and viable techique for modelling radiative transfer even in multiple-scattering, three-dimensional environments.
We are continuing to develop the radiative-transfer model torus (Harries 2000 H00 ) in order to do two things: (i) extend the simplified analytic treatments like those of Wood et al WBF into a geometrically more flexible numerical domain to verify and enrich our basic insights, and (ii) produce realistic models of line and continuum formation in YSOs for more exacting comparison with observations. In both approaches, the radiative-transfer is followed in a three-dimensional grid, which may be described by spherical polar or cartesian coordinates, or via a cubic adaptive mesh.
Figure 6 shows an intriguing result that is emerging from even the more simplified of the two approaches, that merely replaces analytic ideal structures with real 3-D geometry (with no physics of the microstate). We are finding that there is a, hitherto unsuspected, qualitative difference between scattering of the light from a line- and continuum-emitting star by, on the one hand, a rotating circumstellar disk reaching into the stellar surface and, on the other, a rotating disk with a significant central hole. The single position-angle flip, with two turning points, seen in the second case is as predicted by analytic models – but the doubling to four turning points associated with the undisrupted disk reaching into the surface is the surprise. In-depth numerical exploration of this result shows it is due, indeed, to the geometrically correct treatment of the finite sized star interacting with the disk’s rotational velocity field (which re-sorts the scattered line emission).
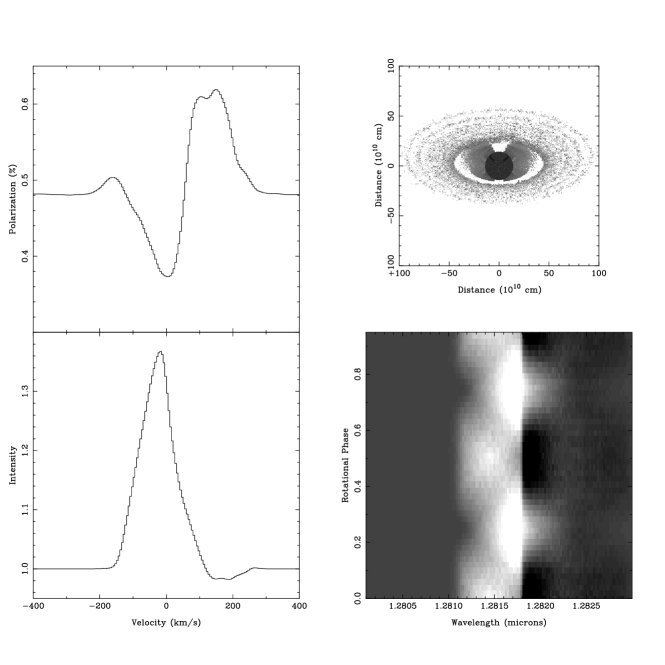
With a view to direct comparison of models with data, Harries, Kurosawa and Symington are applying the code to the computation of emission line profiles due to magnetospheric accretion in T Tauri stars. This fuller treatment requires that the equation of statistical equilibrium for hydrogen is solved for each cell in the grid, while the line transfer is computed under the Sobolev approximation. The dust radiative-equilibrium may be simultaneously solved using the MC method of Lucy L99 . By introducing azimuthal structure into the geometry we are able to compute synthetic time-series spectra. There is no significant linear polarization from the magnetosphere alone, but if we introduce a simple circumstellar disc we find signficant levels of line and continuum polarization. The structure of the polarization through the line provides a potentially important lever on the circumstellar structure, since the scattered component arises from the inner-edge of the disc which ’sees’ the magnetosphere from a distribution of viewing angles that are different to that of the observer (integrating the direct light). In order to give a flavour of the sophistication of the models in figure 7 we present a sample model of a structure magnetosphere, with two diametrically opposed accretion ’curtains’ of 120 degrees extent.
The combination of models of this type, employing self-consistent physics with high-quality spectropolarimetry, will provide tight constraints on the structure and dynamics of the accretion flow and/or CSM in both high- and low-mass YSOs. And of course the approaches sketched here can be adapted to the analysis of other object classes.
6 Final words
This discussion of the application of high resolution linear spectropolarimetry to emission line stars has emphasised studies of young objects. Other important applications would be to studies of intermediate mass (post-AGB) stars and high mass evolved stars. Regarding the latter there are pressing issues concerning the role of angular momentum and how this expresses itself in e.g. B[e] stars (a more extreme and evolved type relative to the classical Be stars). In all these applications the near-infrared is clearly a welcoming wavelength range. Optical work to date has been limited to resolving powers at or below 10 000. We can see now that a factor of 2 or 3 improvement is desirable (e.g. figure 3), and also some improvement in S/N beyond 1000 – which has been attained at times! This point has been reached at a time when theory, exploiting flexible Monte Carlo methods, is fast becoming a powerful tool. In short we have the complex phenomena, and the rise of the modelling capability to match – good data are the missing link.
References
- (1) H.-M. Schmid, I. Appenzeller, J. O. Stenflo, A. Kaufer: ‘Imaging polarimetry and spectropolarimetry of bright objects’: In Scientific Drivers for ESO Future VLT/VLTI Instrumentation, Proceedings of the ESO Workshop held in Garching, Germany, June 11–15 2001 (ESO, 2002) pp.231–237
- (2) J. F. Donati, C. Catala, G. Mathys, A. Kaufer, J.-G. Cuby, I. Appenzeller, O. Stahl, A. Collier-Cameron, I. D. Howarth: ‘High-Resolution Spectropolarimetry on the VLT’: In Scientific Drivers for ESO Future VLT/VLTI Instrumentation, Proceedings of the ESO Workshop held in Garching, Germany, June 11–15, 2001 (ESO, 2002) pp.238–243
- (3) R. Antonucci: ARA&A, 31, 473 (1993)
- (4) J. M. Porter, T. Rivinius: PASP, 115, 1153 (2003)
- (5) R. Poeckert, J. M. Marlborough: ApJ, 218, 220 (1977)
- (6) I. S. McLean, G. V. Coyne: ApJ, 226, L145 (1978)
- (7) I. S. McLean, G. V. Coyne, J. E. Frecker, K. Serkowski: ApJ, 228, 802 (1979)
- (8) R. D. Oudmaijer, D. Proga, J. E. Drew, D. de Winter: MNRAS, 300, 170 (1998)
- (9) K. S. Wood, J. C. Brown, G. K. Fox: A&A, 271, 492 (1993)
- (10) I. S. McClean: MNRAS, 186, 265 (1979)
- (11) R. Poeckert, J. M. Marlborough: ApJ, 206, 182 (1976)
- (12) L. B. F. M. Waters, C. Waelkens: ARA&A, 36, 233 (1998)
- (13) R. Millan-Gabet, F. P. Schloerb, W. A. Traub: ApJ, 546, 348 (2001)
- (14) J. S. Vink, J. E. Drew, T. J. Harries, R. D. Oudmaijer: MNRAS, 337, 356 (2002)
- (15) J. S. Vink, J. E. Drew, T. J. Harries, R. D. Oudmaijer, Y. C. Unruh: A&A, 406, 703 (2003)
- (16) J. C. Brown, I. S. McLean: A&A, 57, 141 (1977)
- (17) T. J. Harries: MNRAS, 315, 722 (2000)
- (18) L. Lucy: A&A, 334, 282 (1999)