XMM-Newton observations of the binary cluster system Abell 399/401
Abstract
Abell 399 and Abell 401 are both rich clusters of galaxies, with global temperatures of 7.2 keV (Abell 399) and 8.5 keV (Abell 401) respectively. They lie at a projected separation of 3 Mpc, forming a close pair. We have observed the system with the XMM-Newton satellite. The data of each cluster show significant departures from our idealised picture of relaxed rich clusters. Neither of the two contains a cooling flow, and we find that their central regions are nearly isothermal, with some small-scale inhomogeneities. The image analysis derives -values that are smaller than the canonical value of 0.65, and the surface brightness distribution is not symmetric around the central cD galaxies: there are irregularities in the central 200 kpc, and asymmetries on larger scales, in that the intracluster gas in each cluster is more extended towards the other member of the system. Both clusters host extended radio halos and a plethora of tailed radio galaxies. The halo in Abell 399 appears to be correlated with a sharp edge apparent in the XMM-Newton images, and a region of harder X-ray emission. There is also evidence for enhanced X-ray flux in the region between the two clusters, where the temperature is higher than our expectations.
Although tidal or compression effects might affect the large scale structure of the two clusters, we show that these cannot account for the distortions seen in the inner regions. We argue that the reasonably relaxed morphology of the clusters, and the absence of major temperature anomalies, argues against models in which the two have already experienced a close encounter. The properties of the intermediate region suggests that they are at an early stage of merging, and are currently interacting mildly, because their separation is still too large for more dramatic effects. The substructure we find in their inner regions seems to point to their individual merging histories. It seems likely that in the Abell 399/401 system, we are witnessing two merger remnants, just before they merge together to form a single rich cluster of galaxies. This picture is consistent with recent numerical simulations of cluster formation.
keywords:
X-rays : galaxies : clusters – intergalactic medium – galaxies : clusters : individual (Abell 399, Abell 401)1 Introduction
It is now common wisdom that clusters of galaxies are formed hierarchically, by the merging of smaller mass units, preferentially along large-scale filaments. During such violent events one expects physical processes to take place that have significant impact on the properties of the constituents of clusters (i.e., gas, galaxies), that would define their subsequent evolution, as well as the energy and entropy budget in the largest structures in the Universe. During mergers, shock waves propagate within the intracluster medium (ICM), thus increasing its thermal energy and entropy. The cluster galaxies may be severely stripped, leaving their metal rich interstellar media (ISM) behind in the cluster, contributing in this way to the enrichment of the ICM (e.g., Acreman et al. 2003). Cooling flows may get displaced or destroyed entirely (e.g., Gómez et al. 2002) .
Numerical simulations (Schindler & Müller 1993, Roettiger, Burns, & Loken 1996; Ricker 1998; Takizawa 1999; Ritchie & Thomas 2002; Burns et al. 2004) have advanced to such an extent that they can provide us with detailed temperature maps and synthetic X-ray images of clusters under formation, at each stage of their evolution. All this work has demonstrated that cluster mergers result in dramatic substructure, visible in the X-ray images and spectra of clusters of galaxies. Initially, during the first approach of two clusters a compression and/or shock wave is developed in the interface between them. When the two cores collide, the temperature and luminosity of the system reaches its maximum. As the two gravitational potentials settle down to form a single one, two lens-shaped shock waves propagate outwards, along the direction of merging. Soon afterwards, a single remnant is formed.
Unfortunately, we have not been able yet to test observationally in a systematic manner, that cluster mergers proceed as theory predicts. Markevitch et al. (1998) set the framework for such investigations, and revealed the gross spectral characteristics of disrupted clusters. Additionally, they were able to comment on the statistics of mergers, but their data were lacking the necessary quality to probe the details of the observed structures. But the results of some recent observational work have been encouraging (e.g., Sun et al. 2002; Kempner, Sarazin, & Ricker 2002), as a hotter bar, for example, has been found in a few cases separating the two colliding units, providing the means to calculate the relative velocity of the merging subunits. A detailed comparison of a sample with the numerical simulations is still lacking, and it is unclear whether the simulations include all the necessary physics and are able to model the problem correctly. There are a few examples of cluster properties that have been discovered by the observations, and had not been predicted by the simulations. Recently, for example, X-ray observations have uncovered features (cold fonts; e.g., Markevitch et al. 2000), that have been now explained as signatures of merging clusters. Cold fronts had not been predicted by the simulations, mainly due to the lack of the adequate resolution and the mishandling of the cooling functions. Only recently some numerical simulations have managed to reproduce them and associate their presence to the motion of a galaxy or group through the ICM of another cluster, and explain the observations (Bialek, Evrard, & Mohr 2002).
Ideally, one would like to construct a sample of clusters that are at different stages of their evolution, and trace the merger event. Unfortunately, finding clusters at different stages of the merging sequence is not trivial. Projection effects or past inaccurate determinations of their physical properties influence severely their classification and taxonomy in one of the stages. Abell 399 and Abell 401 appear at a first sight as a very good example of two clusters at early stages of merging. They are equally rich, and past X-ray missions have found them to be both at temperatures between 7 and 8 keV. They have been the subject of past investigations and have been observed in different wavelengths, from the optical to X-ray.
Their projected separation is 36 arcmin 2.96 Mpc111Throughout this paper we use , =0.3, and =0.7., approximately 1-2 times their virial radii. The line-of-sight velocity difference of the two is of the order of (Girardi et al. 1997). The velocity dispersions of Abell 399 and 401 are and (Oegerle & Hill 2001) respectively. Dynamical models of the system based on the dynamics of the galaxies around the Abell 399/401 system reached the conclusion that it consists a bound cluster pair (Oegerle & Hill 1994), and that the galaxies of both clusters should move in the total gravitational potential of both clusters. Additionally, since their line-of-sight velocity difference is smaller than their velocity dispersions, it is probable that the encounter between the two clusters is taking place essentially on the plane of the sky. Basic properties of the clusters are given in Table 1.
| Cluster | z | kpc/” | (Mpc) |
|---|---|---|---|
| A399 | 0.0724 | 1.36 | 322.4 |
| A401 | 0.0737 | 1.38 | 328.5 |
| (I) | (II) | (III) | (IV) | (V) | (VI) | (VII) | |
|---|---|---|---|---|---|---|---|
| Rev | Obs | (2000) | (2000) | Instr. | |||
| deg | deg | ksec | ksec | ||||
| 0127 | 0112260101 | 44.4491255188460 | 13.0518334856848 | MOS1 | 14.166 | 11.429 | |
| MOS2 | 14.170 | 11.599 | |||||
| PN | 9.188 | 5.249 | |||||
| 0127 | 0112260201 | 44.5827088537386 | 13.3186112665767 | MOS1 | 18.231 | 18.133 | |
| MOS2 | 18.234 | 18.152 | |||||
| PN | 12.505 | 12.395 | |||||
| 0395 | 0112260301 | 44.7636255225170 | 13.5472223803563 | MOS1 | 12.953 | 12.948 | |
| MOS2 | 12.959 | 12.897 | |||||
| PN | 8.086 | 8.063 | |||||
| 0395 | 0112260401 | 44.9844588584281 | 13.7638057162178 | MOS1 | 11.913 | 11.882 | |
| MOS2 | 11.917 | 11.829 | |||||
| PN | 7.143 | 7.143 |
NOTES– (I): revolution number; (II): observation number; (III): pointing () in degrees; (IV) pointing () in degrees; (V) EPIC Instrument; (VI) Exposure time (live time for the central CCD); (VII) Reduced Exposure time, after the subtraction of the bright background flares (see text for more details).
Previous studies have reached contradictory conclusions about the past history of the pair. The first attempts to reveal signs of interactions in the region between the two with the Einstein observatory did not lead to any strong conclusions (Ulmer & Cruddace 1981). The ASCA satellite found evidence for some enhancement in the X-ray flux above what is expected from just the superposition of the two clusters (Fujita et al. 1996). A slight temperature increase in-between them was also recorded. Both results led Fujita et al. (1996) to suggest that Abell 399/401 is a pre-merging pair. However, this scenario provides no explanation for the lack of cooling flows in the cores of both clusters. X-ray observations (e.g., Peres et al. 1998) have found that their centres do not host cooling flows as the mass accretion rate is zero. Additionally, the model of Fujita et al. does not tie in well with the past ROSAT observational facts that both clusters appear disrupted : the work of Slezak, Durret, & Gerbal (1994), for example, found evidence for ‘substructure’ in Abell 401, and the ROSAT HRI detector (Fabian, Peres, & White 1997) revealed a linear structure that emanates from the centre of Abell 399 and points towards Abell 401. This feature lead to the suggestion that the two clusters have already encountered each-other, and are now moving apart.
In order to recover the dynamical state of this system, decide on its past history and future evolution, and derive vital information that would help us to test the results of the numerical simulations of merging clusters, we observed Abell 399/401 with XMM-Newton . The observations are presented in Section 2. Section 3 is devoted to the presentation of the properties of each cluster individually, as found from the XMM-Newton data and analysis. In Section 4 the X-ray properties of the region between the two is investigated, while in Section 5 the radio properties of the clusters are presented, and their large scale environment is discussed in Section 6. Finally, in the discussion section (Section 6) we present models for the dynamical states of both clusters that can fit well the XMM-Newton radio and optical results.
2 XMM-Newton Observations
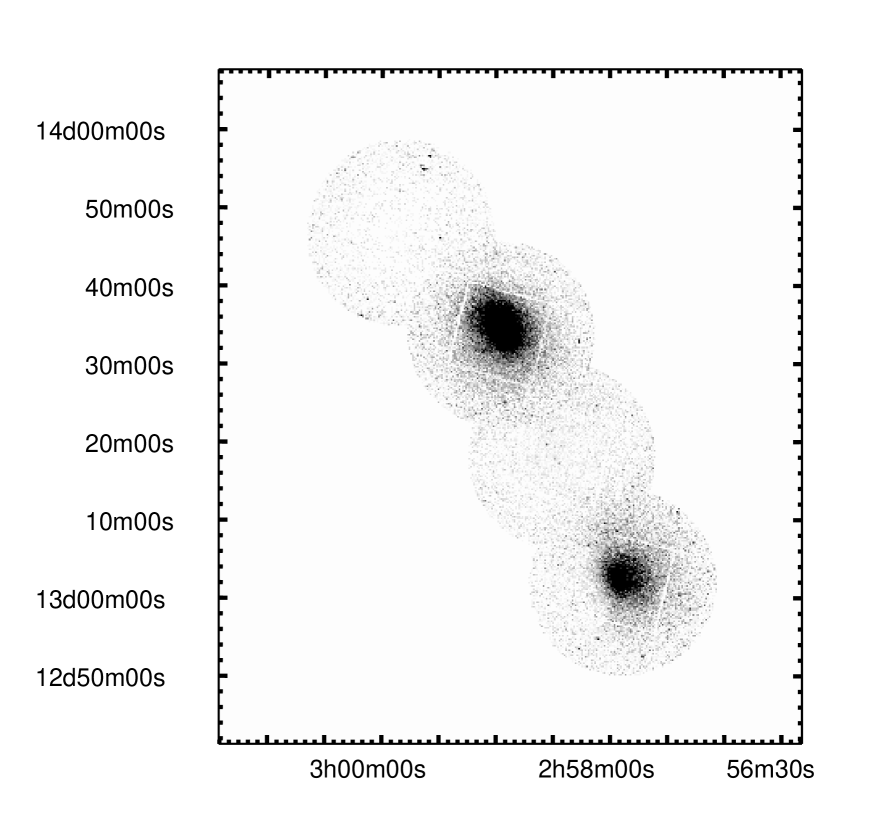
The Abell 399/401 system was observed by the XMM-Newton observatory in 4 pointings, covering a large area around it. Information on the different observations is given in Table 2. Observation 0112260101 (101 hereafter) was centered on Abell 399, 0112260301 (301) on Abell 401, 0112260201 (201) in between the two clusters, and 0112260401 (401) to the North of Abell 401. During each observation the MOS instruments were operating in the PrimeFullWindow mode, and the PN in the PrimeFullWindowExtended. The thin filter was used for the 101, 201, and 401 observations, and the medium filter was used during the 301 observation. A mosaic of all the pointings is presented in Fig. 1.
2.1 Data Reduction
All data sets were processed with the XMM-Newton SAS v5.3. emchain and epchain were used to obtain the calibrated event lists for the MOS and PN instruments respectively. During the processing, a search for new bad pixels was allowed by switching on the withbadpixfind parameter. The calibrated event files were subsequently filtered to keep only the events with pattern=0. Additionally, we clean the event lists for periods of high background. This cleaning process reduced the exposure times to those presented in column VII of Table 2.
2.2 Background Treatment
Background images and spectra were generated from the ‘blank-sky’ event lists (D. Lumb’s background files; Lumb 2002). The coordinate frames of these fields were converted to the corresponding frames for each pointing. The background event lists were filtered for pattern in the same way as the data, and periods of high background levels that are still present in D. Lumb’s files, were removed by applying a 3- cut-off. Subsequently, the background events were scaled to match the background levels of each instrument and observation by scaling the out-of-field events as in Pratt et al. (2001). The scaling factors we use for MOS1, MOS2 and PN are: 1.00, 0.95, 1.15, for the 101 observation; 1.06, 0.95, 1.15 for 201; 1.10, 1.03, 1.44 for 301; 1.13, 1,05, 1.30 for the 401 one. These scaling factors are consistent with the factors found for other observations.
2.3 Image Mosaic
Figure 1 shows the mosaic of all four pointings in the (0.5-10) keV energy band. For this mosaic we use the exposure corrected, background subtracted images, that we generate and use in the subsequent analysis. The production procedure we follow will be explaned later in this paper (Section 3.1). For the image mosaic of Fig. 1 we use only the images from the two MOS instruments (MOS1 and MOS2). The mosaic was made using the SAS task emosaic, without applying an exposure correction.
As seen in Fig. 1 the pointings were chosen so that they lie along the line that connects the two cluster cores, and each cluster was at the centre of one observation.
3 Average Cluster Properties
In this section we derive the properties of each cluster individually, and compare them with past results from other X-ray satellites of the same and similar clusters.
3.1 Spatial Analysis
| Cluster | Sector | ||
| (arcmin) | |||
| A399 | global | 1.9030.007 | 0.4980.001 |
| A401 | global | 2.0480.004 | 0.5900.001 |
| A399 | N | 2.113 | 0.512 |
| W | 3.129 | 0.574 | |
| S | 2.143 | 0.497 | |
| E | 0.997 | 0.510 | |
| A401 | N | 2.716 | 0.727 |
| W | 2.343 | 0.649 | |
| S | 1.937 | 0.545 | |
| E | 1.479 | 0.515 |
In order to obtain the overall spatial characteristics of both clusters, and compare them with previous findings, we initially assume spherical symmetry and fit the surface brightness distributions with the traditional -model (e.g., Cavaliere & Fusco-Femiano 1976).
For the purpose of any subsequent spatial analysis, we first create background subtracted and exposure corrected images of both clusters in the (0.5-10.0) keV energy range. The background and exposure correction is performed as follows. Images and exposure maps are generated from the clean and filtered event lists in narrow energy bands from 0.5 to 10.0 keV [‘narrow-energy-range’ (NER) images]. Each energy band is 0.5 keV wide. Similar NER background images are created from the blank-sky event files. Subsequently, each NER background image is smoothed and scaled, using the appropriate scaling factors for each observation found in Section 2.2. The smoothed and scaled NER background image is then subtracted from the data image. Each instrument is treated independently. Then, each NER background subtracted image is corrected for exposure and vignetting, by dividing with the appropriate exposure map. Finally, all the background subtracted, vignetting and exposure corrected NER images are co-added to create one image for each instrument in the (0.5-10.0) keV energy range.
We first use the above created images to derive the global spatial properties of each cluster in Section 3.1.1, and later (Section 3.1.2) to investigate their azimuthal variations.
3.1.1 Global Properties
We construct surface brightness profiles for both clusters, by accumulating counts in 40 concentric circular annuli of width 15 arcsec, around each cluster centre. These profiles are centred on the peak of the X-ray emission, which coincides with the location of the large cD galaxies, that reside within the core regions of both clusters. These locations are marked on Fig. 2. We include in the profiles only counts that come from regions of the CCDs that were exposed for more than 0.5 percent of the total exposure time. The profiles are fit in sherpa by the -model. For each cluster, the accumulated profiles from each instrument are fitted simultaneously, leaving each normalisation as a free parameter. On the other hand, the core radius () and the -parameter are linked.
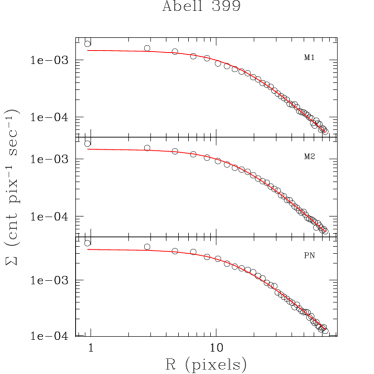
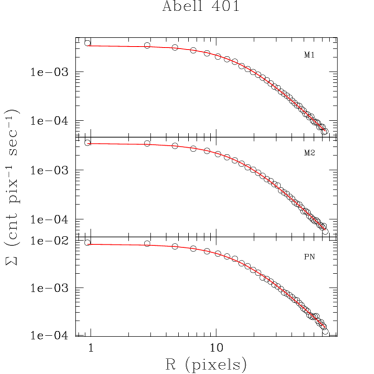
The fits with a single -model give a core radius and a beta value of arcmin = kpc, and = with /d.o.f = 383/115 for Abell 399, and = arcmin = kpc, = , /d.o.f=343/115 for Abell 401.
Figure 3 shows the azimuthal average surface brightness profiles and the best fit single -model. The data and model for each instrument are shown independently. It is clear from this figure that a single -model does not represent well the inner regions of Abell 399, where an excess above the model is apparent. The addition of a Gaussian to describe the central excess improves the fit, although it is still a poor description of the data, providing a new statistic of /d.o.f=300/111. During the last fitting procedure, the full-width-half-maximum () of the Gaussian, and of the -model, are left free to be determined by the fit. Such a composite fit gives a low value, similar to the single component -model fit, with = and a similar core radius of = arcmin = kpc. We find that the best fit Gaussian has a width of = arcmin = kpc.
We find similar behaviour in Abell 401, where a smaller central excess is also seen. If we add a Gaussian, the properties of the best fit -model do not change significantly; the new values are = arcmin = kpc, and =, with /d.o.f=311/111. For the central Gaussian the fit gives: = arcmin = kpc.
As can be seen in Table 3, the modelling of the surface brightness distributions of both clusters results in small values compared to the canonical value of 0.65 that describes on average the profiles of rich clusters. These values do not change significantly either with the addition of the Gaussian as stated above, nor with the exclusion of the inner (15-20) arcsec from the fit.
Neither of the two central galaxies is known to host an active nucleus, whose presence could be invoked to explain the requirement for an extra, but small, central component. It is also apparent that the results of the composite fits support this statement: we find that the central emission is not due to a point source, as the width of the best-fit Gaussians is larger than the XMM-Newton point-spread-function (PSF). Another plausible explanation for the observed central excess could be that the it is due to emission from dense and cool gas that resides in the cluster cores. However, the excesses are not as large as those encountered in massive cooling flow clusters. We will come back to this point in Section 3.2, where we investigate spectroscopically the possibility of a cooling flow.


The global fits for both clusters result in large values of the (). Under these circumstances the use the normal criterion to define parameter errors (Lampton, Margon & Bowyer 1976) is not valid, and naive application of this prescription is likely to yield unrealistically small confidence regions. Although there is a systematic excess above the model in the cores of both clusters (Figure 3), most of the excess scatter about the fitted model which gives rise to these high values of is scattered widely in radius. We therefore make allowance for this scaling the statistical errors up by the factor required to give , and then use these larger errors to perform the error calculation (using ) for the fitted parameters. This allows for the effects of the excess scatter in weakening the constraints on our derived parameters. The errors derived in this way for the global fit are included in Table 3.
Inspection of Fig. 2 suggests that spherically symmetric -models might not be good representations of the surface brightness distributions of the two clusters. For example, it can be noted in the same figure that the cD in Abell 399 is not at the centre of the X-ray surface brightness distribution, which additionally does not appear spherically symmetric, especially at large radii. On the other hand, Abell 401 is elongated along the NorthEast-SouthWest direction. In order to disclose these anomalies, we perform each image analysis in four sectors around the central cluster galaxy.
3.1.2 Sectors
In the previous section we have found that the surface brightness distribution of both clusters can be described by flat -models. In addition to this component, some central excess is required. Given the apparent proximity of the two clusters to each other, we might expect that tidal interactions have extended the gas distributions in each towards its neighbour. This effect would manifest itself in azimuthal differences in the surface brightness distributions at large radii. To explore this expectation, we model the radial cluster profiles in four 90 deg sectors for each cluster, centered, as in Section 3.1.1, on the peak of the X-ray emission which coincides with the cD galaxy. The sectors we use are shown in Fig. 2, and are labelled N, W, S and E for each cluster. We accumulate counts in annular segments of width 30 arcsec, and each radial profile is fitted by a single -model, as in Section 3.1.1, and the results listed in Table 3.
For clarity, in Fig. 4, and 5 we compare the surface brightness profiles in the four sectors for each cluster with the -models found from the global fits to the data with a single model. These figures also plot the temperature profiles found in the same sectors and their derivation and discussion will be presented later in this paper (Section 3.2.3).
Inspection of Fig. 4, and 5 reveals that the clusters are not azimuthally symmetric. One of the most intriguing features that arise from the above comparison is that at large distances from the cluster centres, the ICMs appear more extended only in the sectors that face the other member of the binary system. Additionally, Abell 399 is more extended also to the West. For Abell 399 we find the index to lie between 0.497 (sector-S) and 0.512 (sector-N), straddling the values found from the azimuthally average analysis. The range of is wider. Sector-E gives the smallest (=0.997 arcmin), and sector-W the largest (=3.129 arcmin). The values for sector-N, which is the one that is facing Abell 401, are average between the quoted extremes. Excluding from the fit the inner points does not make any difference to the best fit values.
Although Abell 401, looks more symmetric than Abell 399, the range of values we find is larger. Sectors-S and E give the smallest (0.545 and 0.515 respectively). The fit to the data from the sector that is the furthest away from Abell 399 (sector-N) results in the steepest of 0.727, and the largest of 2.716 arcmin. The core radius of the sector that is facing Abell 399 (sector-S) is average (=1.937 arcmin).
To summarise the results of sections Section 3.1.1 and Section 3.1.2, we find values in the range 0.50-0.57 in Abell 399, and 0.50-0.73 in Abell 401. These values are smaller than the ‘canonical’ value of 0.65 for clusters of galaxies. Such small values have been found before in binary and merging clusters of galaxies (e.g., Donnelly et al. 2001). Only the data from sector-N and -W in Abell 401, which are on the opposite side of the other cluster, have larger s of 0.73 and 0.65 respectively. However, as we will demonstrate later (Section 4), the North sector in Abell 401 is unusual also in the temperature profile. Abell 399 appears more disrupted, and as can also been derived from Fig. 4, and Table 3, the surface brightness distribution in almost all sectors is extended, with small s. Sector-E is abnormal giving a small core radius of =0.997 arcmin=81.35 kpc. Additionally, we find that both clusters show a central excess which is more apparent in Abell 399, and we can confidently exclude the possibility that this is due to any active nuclei that reside within the core of the clusters.
3.1.3 2-dimensional residuals
In order to investigate the origin of the central excess in both clusters seen in the surface brightness profiles, and visualise the azimuthal differences that the results of Section 3.1.2 suggest, we perform 2-dimensional fits to the image data for both clusters. We use the background subtracted and exposure corrected images discussed above, for this spatial analysis, and fit the images of each instrument and cluster individually in sherpa, using 2-dimensional -models. The values of and are fixed to the best fit values found in the azimuthal average 1-dimensional fits with a single -model. The centres of the 2-dimensional models are fixed to the values used for the 1-dimensional analysis, which coincide with the location of the central galaxies. The normalisations of the three instruments are left free to vary. The residual images for the MOS cameras are co-added and smoothed using the SAS task asmooth. Figure 6 shows contour plots of the residual smoothed images overlaid onto DSS images of the central regions of both clusters.
A few new intriguing features appear from the above 2-dimensional analysis, which are not very apparent in the 1-dimensional plots. Firstly, in both clusters, the positive residuals lie on one side of the central galaxy: to the South of the galaxy in Abell 401, and to the North of the one in Abell 399 with some additional extension to the west. We expect, though, that some of the residuals in Abell 401 stem from the fact that we fit a circular symmetric model to a cluster that is intrinsically elongated along the same direction as the excess seen in Fig. 6. However, if this is the only reason for the appearance of the residuals in Abell 401, it cannot explain why we don’t see similar residuals on the opposite side of the galaxy to the North-East. If we leave the ellipticity and position angle of the 2-dimensional -model free, we obtain an ellipticity of =0.115, a position angle of 2.0. The residuals are very similar, being on the South-West side of the central galaxy only. Similarly, the 2-dimensional fit to the Abell 399 images reveals that the central excess seen in the 1-dimensional profiles of Fig. 3 can be attributed to emission coming from one side of the galaxy, mainly the North and West.
Thus, the 2-dimensional analysis reveals the shape of the central excesses in both clusters, which were noted in the 1-dimensional image analysis. The positive residuals of Fig. 3 are prominent in the innermost regions of the clusters, extending (2-3) arcmin (170-250) kpc around the central galaxy. As seen in Fig. 4 and 5 these extensions appear to carry on on larger scales.
3.2 Spectral Properties
For any following spectral analysis, we use the clean event lists for the data and background. We impose further restrictions by keeping events that have flag=0 and pattern=0. This filtering ensures us that the events we use for the spectral analysis have cosmic origin, and they are not generated by for example cosmic rays, or CCD defects. Responses and auxiliary files are generated with rmfgen-1.44.6 and arfgen-1.48.10 respectively.
For the fitting procedure, we only use the (0.6-7.5) keV range for the observation 301 (Abell 401). The reason we increase the low energy limit is because it was taken with the medium filter, while for all the blank-sky background files the thin filter was used. The effective areas of the thin and medium filters mostly differ at low energies (1 keV; XMM-Newton User-Handbook). Thus, in order to avoid inaccurate subtraction of the background at low energies, we exclude energies below 0.6 keV. This cut-off may cause some overestimation of temperatures by a small amount, and/or inaccurate determination of the absorbing column density. However, given that Abell 401 is a hot cluster, we don’t expect to introduce any significant bias towards high temperatures. Several tests with and without the (0.3-0.6) keV energy range show that the temperatures calculated with and without the increased low energy limit agree within the errors. For the sake of consistency between the different observations, we decide to use the same energy range (0.6-7.5) keV for any subsequent spectral analysis. Another reason that this selection is desirable, is that calibration problems that are mostly prominent at low energies are avoided.
In the following sections we present the results of the spectral analysis for both clusters.
| Cluster | ||||
|---|---|---|---|---|
| () | (keV) | () | ||
| A399 | 0.812 | 7.23 | 0.22 | 1335/930 |
| A401 | 0.729 | 8.47 | 0.25 | 1445/1203 |
The errors quoted are the 90 percent errors for one parameter of interest. Solar abundances were taken from Anders & Grevesse (1989).
3.2.1 Global Spectral Properties
Spectra of both clusters are accumulated over a circular region with radius of 10 arcmin around each cluster centre. Background spectra are taken from the blank-sky background files in the same regions on the detectors as for the data spectra. The background spectra are scaled by the factors found in Section 2.2. We generate spectra from each instrument independently, and subsequently fit all three instruments in xspec simultaneously.
The spectra are fit with a mekal model modified by the line-of-sight hydrogen absorption, as described by the xspec wabs model. The galactic absorption for the direction of both clusters is . During each fitting procedure, the hydrogen column density (), metal abundance (), temperatures () and normalisations are left as free parameters. Their best fit values are tabulated in Table 4, along with the goodness of each fit. In Fig. 7(a) and Fig. 7(b) we present the spectra of Abell 399 and Abell 401 respectively. The best fit thermal models, and the residuals of the fits are also shown in the same plots.
For both clusters, we find an absorbing column consistent with the galactic value. The global temperatures and abundances are in good agreement with previous results from the ASCA satellite (Nevalainen et al. 1999; Markevitch et al. 1998; Fujita et al. 1996).
3.2.2 Temperature Profiles
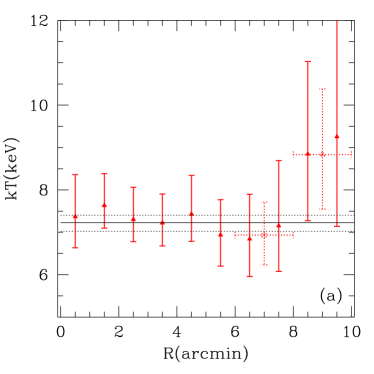
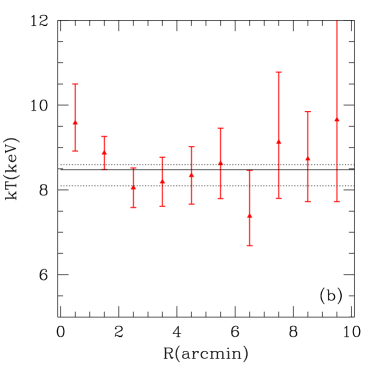
Assuming spherical symmetry, we obtain radial temperature profiles, by accumulating source counts in circular annuli around each cluster centre. The width of each annulus is 1 arcmin. As for the global spectral analysis, we fit the (0.6-7.5) keV energy range. The background is taken again from the blank-sky clean and filtered files, as in Section 3.2. During the fitting procedure, the absorbing column is fixed to the best fit value for each cluster listed in Table 4. The abundances are left free to vary. In the inner 7 annuli, after background subtraction there are more than 80 per cent of the total counts left in the energy range we use for the fits. Only the last 1-2 annuli, are left with (65-75) percent counts after the background subtraction. The reduced varies between =0.55-1.15 for Abell 399, taking these extreme values at 0.5 and 9.5 arcmin respectively, while the rest give values of between 0.94 and 1.13. For Abell 401, the fits are generally better, with lying between 0.93 and 1.12 (for the annuli at 4.5 and 1.5 arcmin respectively). Figure 8 shows the resultant projected temperature profiles, for Abell 399 [Fig. 8(a)], and for Abell 401 [Fig. 8(b)]. In both clusters the calculated abundances are consistent with their global values. Both clusters appear nearly isothermal in their inner regions, and the derived temperatures are consistent with the average values of Table 4.
We have also derived deprojected temperature profiles. As expected, these are similar to the projected ones, since there is no strong gradient in the temperature. Of course, the deprojection procedure has the effect of increasing the errors of the temperatures.
As can be seen in Fig. 8(a), Abell 399 appears isothermal at the global temperature out to 8 arcmin = 0.65 Mpc. At large radii [(8-10) arcmin], the spectral fits give higher values for the temperature. Past results for the temperature slope of clusters of galaxies at large radii derived from ASCA data (e.g., Markevitch et al. 1998) and ROSAT data (Irwin et al. 1999) led to contradictory results for the temperature gradient at large radii. The general trend is that ASCA finds a decline in the temperature profiles at large radii, while with ROSAT clusters appear at a nearly constant temperature. The past ASCA results for Abell 399 are conflicting too, but this disagreement could be understood in terms of the different treatments for ASCA’s PSF, by different authors. For example, Markevitch et al. (1998) found that the temperature remains constant at 6.2 keV between 3 and 16 arcmin, slightly lower than our values, but consistent within the errors. They also found a central excess, with the temperature within the inner 3 arcmin, escalating up to 8.5 keV, which is not evident in the XMM-Newton results of Fig. 8(a). On the other hand, Fujita et al. (1996) did not see any central excess, and argued that the cluster is nearly isothermal out to 10 arcmin. At large radii, they found some evidence for a small temperature increase in their data. A temperature increase at 10 arcmin was also evident in the temperature profile presented in White (2000).
Thus, up to now, there is no consistent result for the temperature of the cluster’s ICM at 10 arcmin from the centre of Abell 399. As noted before, we find a small increase at such large radii [see Fig. 8(a)]. In order to investigate whether this apparent increase is due to the low number of counts from the cluster at these large radii, we increase the size of the last annular bin, and we extract the spectra in annuli between 6-8 and 8-10 arcmins. The derived temperatures are shown as dotted crosses in Fig. 8(a). The calculated for both are 1.07 and 0.90. As can be seen the results are consistent with the results from the 1 arcmin wide annuli, showing a small temperature increase.
Another possibility for the derived hotter temperatures, could be that the scaling of the blank-sky background files was not adequate, but the background level needs to be increased further. To test this possibility, we increase the background by a factor of 1.2 and perform the same spectral fits to the wide annuli as before. The derived temperatures are keV and keV for the inner [(6-8) arcmin] and the outer [(8-10) arcmin] annuli respectively. Thus, a 20 percent increase of the background level results in the reduction of the temperature by 14 percent, from a temperature of keV. This scaling reduces the temperatures of the inner annuli by a small amount, with a decrease of 4 percent the maximum. Increasing the background scaling factor more leads to worse fits. Generally, the models do not represent the data at energies 1 keV. More absorption is required at these low energies to compensate the increased flux from the lower temperature plasma, if the temperature is to be lower than the one shown in Fig. 8(a). There is no obvious reason to support an increase of the absorbing column density with radius from the cluster centre. Thus, we conclude that an increase of the scaling factor of the background level by a factor not larger than 1.2 could suppress the high temperatures found by the previous analysis at large radii, without changing much the temperature of the inner annuli. However, we are not aware of such large scaling factors required in any other data sets, and we decide to use the factors found in Section 2.2, and state where necessary the effect of an increased value to the derived temperatures.
On the other hand, Abell 401 shows isothermality at the global temperature out to 10 arcmin=0.83 Mpc [see Fig. 8(b)]. There is also some evidence for a central temperature increase in the inner 2 arcmin, as previously noted in the ASCA data (e.g., Nevalainen et al. 1999). Previous analysis of the ASCA data indicate that the ICM at a distance of (8-16) arcmin might be cooler than in the inner regions by a factor of 0.6 (Nevalainen et al. 1999).
3.2.3 Sectors
In order to disclose any azimuthal dependences of the temperature profiles, we obtain the spectra in concentric annuli in the four sectors shown in Fig. 2, as for the spatial analysis. We now increase the width of each annulus, so that the number of counts recorded in each one is adequate for the full spectral modelling. We perform exactly the same fitting procedures as in Section 3.2.2. The derived temperature profiles are shown in Fig. 4 for Abell 399 and Fig. 5 for Abell 401. The same figures show the surface brightness distributions in the sectors, and were discussed earlier in this paper.
A few striking properties for the temperature structure in Abell 399 emerge from these figures: i) the high temperature in the inner 2 arcmin in sector-S, ii) the high temperature in the outer (6-10) arcmin region in sector-E, iii) along sector-N, towards Abell 401, the temperature profile appears the most regular of the four, showing the gas to be isothermal at the global temperature.
The high temperature found in the outer annuli in sector-E should be the main reason for the increased temperature found in the azimuthally symmetric temperature profiles of Section 3.2.2. As seen in the raw XMM-Newton images, in this sector at large radii the flux from the cluster is rather low, making the spectra more depended on the background level. If we increase the scaling of the background by a factor of 1.2, as in Section 3.2.2., we find a temperature for the last annuli in sector-E of 8.81 keV, compared to a temperature of 11.48 keV using the original scaling. Thus, an increase of the scaling factor by the additional factor of 1.2, reduces the temperature by almost 25 percent. A better estimation of the temperature along sector-E at large radii will have to wait for data with longer exposures that compensate for the inherently low flux from this sector.
Abell 401 also shows some small scale irregularities in the temperature profiles of Fig. 5, i) the sector that is facing Abell 399 appears the most regular, nearly at the global temperatures, ii) the inner 2 arcmin of sector-N and -W are slightly hotter than the rest, and are probably responsible for the central temperature increase noted in Fig. 8(b), iii) there is a temperature drop out to large radii along sector-N. This property will be discussed later in this paper (Section 5).
3.3 Central Regions
Past X-ray data showed no significant evidence for the presence of cool gas in either cluster core (e.g., Peres et al. 1998). Our higher quality data confirm the absence of centrally concentrated cold material. We have found that a single temperature model gives an adequate representation of the spectra in the inner 1 arcmin regions, leaving no room for any extra thermal or non-thermal components. Trials with cooling flow models fail to provide acceptable fits. Thus, we conclude that none of the two clusters hosts even a mild cooling flow in its centre. Additionally, this result supports the statements of Section 3.1.2., that the central excess seen in the surface brightness profiles are not due to an active galaxy, since there is no spectral evidence for it.
| Property | Abell 399 | Abel 401 |
|---|---|---|
| 7.23 | 8.47 | |
| (keV) | ||
| 155.3 | 169.6 | |
| (kpc) | ||
| 0.50 | 0.59 | |
| 4.19 | 6.76 | |
| () | ||
| 18.8 | 12.4 | |
| (Gyr) | ||
| 4.98 | 6.13 | |
| ) | ||
| 2.16 | 2.34 | |
| (Mpc) |


3.4 HR maps
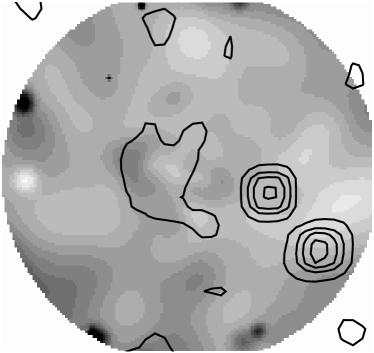
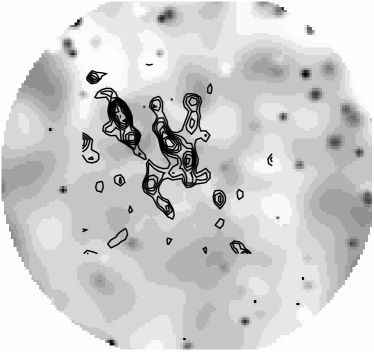
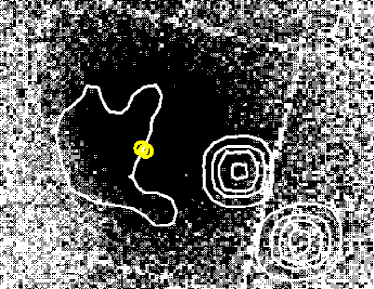
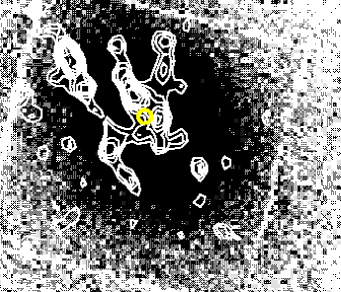
In Fig. 9 we present the hardness ratio images of the central 10 arcmin for both clusters. These maps are obtained by dividing a hard image () by the soft (). The energy ranges for the soft and hard are =(0.5-1.0) keV, and =(2.0-5.0) keV. We avoid the (1.0-2.0) keV energy range as it contains strong background lines. The , and are corrected for exposure, and a background is subtracted, in a similar manner as in Section 3.1. Before we divide the images, we adaptively smooth them, using the smoothing scales derived for the hard image. On the hardness ratio maps we overlay the radio contours, which show the location and extent of the clusters’ radio halos (see Section 6 for more details).
These images show the small scale variations noted in the temperature profiles of Section 3.2.3. For example, the region in the (2-4) arcmin in the east sector in Abell 399 seems to coincide spatially with the extended radio emission from this cluster. The emission from the north of Abell 401 appears softer than elsewhere in the cluster, confirming the results of the spectral fits of Section 3.2.3.
3.5 Summary of Global Results
In Table 5. we collect some key properties of both clusters, derived from the XMM-Newton analysis. The central number density of the ICM is calculated by deprojecting the central surface brightness () found from the spatial analysis of Section 3.1, using eq. (3) and (4) from Sakelliou et al. (1996). The cooling time , which can be treated as an indication of the presence of a cooling flow (Sarazin 1986), is also given in Table 5. The number density and cooling time given are their central values. For the we follow Finoguenov et al. (2001), and for the results of Evrard, Metzer & Navarro (1996) are used.
4 Between Abell 399 and Abell 401
We investigate next the properties of the region between the two clusters. The separation of the cores of the two clusters is 3 Mpc, and their , as calculated from their global temperatures found in Section 3.1.1 are presented in Table 5. In this binary system, the surfaces of both clusters overlap (unless there is a large projected separation between them, which is not justified by the redshift data, as mentioned in the introduction), making it difficult to believe that the properties of each is not influenced by the presence of the other. If they have started merging with each other, or have been through each other already, one would expect the characteristics of the gas between them to show the signatures of these physical processes, and carry some clues about the dynamical state of the system.
As was mentioned above, one of our XMM-Newton pointings (the 201 observation) was centred between the two clusters, and we use it to obtain the X-ray properties of the gas occupying this region. Background subtracted and exposure corrected images are created in a similar way as in Section 3.1, and for the spectral analysis we follow the analysis of Section 3.2.
4.1 Surface brightness
In Fig. 10 we show the count flux along a strip of 1 arcmin width, that passes though the two cluster centres. In Fig. 10(a) we plot the best fit models derived from the fits to the azimuthal average surface brightness profiles of Section 3.1.1. In the same plot, we also show the superposition the two -models with the solid line. Two important conclusions can be drawn from inspection of this plot. Firstly, the azimuthal average profiles do not represent well the data along the narrow strip, but lie systematically above the data at large radii. These negative residuals in respect to the global fits are apparent Fig. 4 (sector-S), and in Fig. 5 (sector-N). Thus, the North-South direction of the narrow strip should exaggerate these discrepancies. In order to try and take into account this behaviour, we plot in Fig. 10(b) the -models derived from the North sector for Abell 401 (sector-N) and the South one for Abell 399 (sector-S), assuming, of course, mirror symmetry about the cluster centre. It is now seen in Fig. 10(b) that these models represent better the surface brightness distribution at large radii to the north of Abell 401. However, the model from sector-S in Abell 399 is still not a good representation of the profile at radii 10 arcmin to the South of Abell 399. Unfortunately, we do not have another pointing to the South of Abell 399, which could check accurately the distribution of the cluster at such radii. Given that the discrepancy is mainly at radii 10 arcmin, where the uncertainties of the vignetting function and the background subtraction become more important, we use the model presented in Fig. 10(b) for the following discussion.
In Fig. 10(b) there is evidence for an excess between the two clusters, which cannot be explained solely by a simple superposition of the flux from the two clusters. In this region we find an average flux above the background of 0.25 , while the combined model predicts a flux of 0.13 .
4.2 Temperature
There are various plausible explanations for the presence of extra gas in-between the clusters. It could be just the ICMs of the two clusters, that have been stretched due to the action of gravitational forces. Alternatively, it could be a compression region, that is created as the two clusters come together. Thirdly, it could be cluster gas left behind after the two cluster cores have passed each other. All these processes should leave different signatures in the spectral properties of the gas. If for example, we are seeing a compression region, its temperature should be higher than the surroundings. In order to investigate this issue we examine the variations in temperature along the line that connects the two cluster centres. Due to the low number of counts in the region between Abell 399 and Abell 401 we extract spectra in 3 wide boxes. Two of them are () arcmin in size, and the central one is () arcmin; all three are adjacent to each other and perpendicular to the line of interest, and they fill the XMM-Newton FOV.
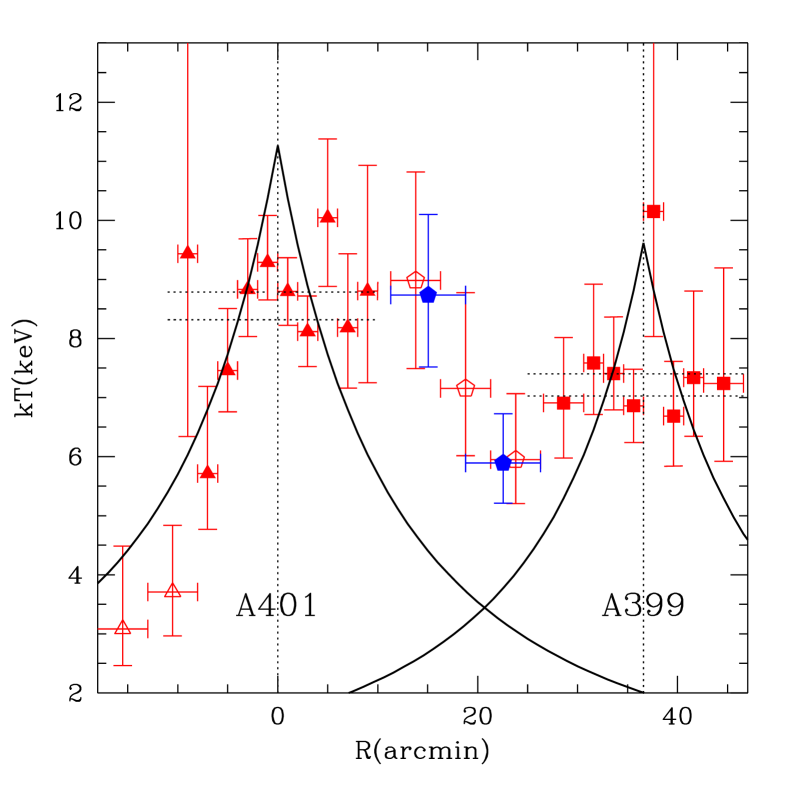
We obtain the data and background spectra, and perform the fitting procedures in xspec as in the previous spectral analysis, fitting single temperature mekal models. Figure 11 shows the temperature of the gas along the line that intercepts the two cluster centres, and the resulting temperatures are plotted with open pentagons. The same figure shows the temperature variations found in Section 3.2.3 and Section 5: with filled triangles we plot the temperatures from the sector-N and -S in Abell 401; open triangles mark the temperatures obtained from the analysis of the 401 observation in Section 5, to the North of Abell 401; filled boxes show the results for Abell 399 obtained in sector-N and -S.
In order to check the confidence of our results for the temperature of the gas in the intercluster region, we increase the width of the previous source regions, so that and we extract the spectra from only two wider boxes. These results are marked with filled pentagons in the same figure.
Recently, Loken et al. (2002) derived a ‘universal temperature profile’ using numerically simulated clusters. They have found that the temperature declines with the distance () from the cluster centre as keV, where . Fits to their simulated data led them to a value for the exponent of of 1.6, and the normalization of 1.3. When compared to the data, this profile is in good agreement with De Grandi & Molendi (2002), and Markevitch et al. (1998), mainly at large radii. Loken et al. (2002) found that they could not reproduce the central core seen in the temperature profiles of De Grandi & Molendi (2002). In Fig. 11 we show with solid lines the temperature profile for both of our clusters, as predicted by the above equation. As virial radii we use the values of from Table 5.
It is apparent from Fig. 11, that the temperature of the intercluster region is enhanced compared to the theoretical expectations, and the XMM-Newton data to the North of Abell 401. However, there is no evidence for a strong shock which could have increased the temperature to values as high as (15-20) keV, as seen in the numerical simulations (e.g., Takizawa 1999).
5 Abell 401 at large radii
The region North of Abell 401 was also observed by XMM-Newton in a different pointing (observation 401). This observation provides us with the opportunity to investigate the temperature structure of this massive cluster, at large radii and away from the region that in principle, should be more disrupted due to the presence of Abell 399. Using observation 401 we extract the spectra in two adjacent boxes that lie along the direction that intercepts the two cluster centres. Both source regions are (5 15) arcmin in size, and the spectral analysis is performed in xspec as before. We plot the resulting temperature values in Fig. 11 with open triangles. Here we concentrate on the temperature structure North of Abell 401 (at negative in Fig. 11). In this figure we also plot the temperature profile from the 301 observations, using the derived temperatures in the sector-N found in Section 3.2.3.
Numerical simulations of structure formation and evolution have demonstrated that the temperature of present-day clusters declines with distance from the cluster centre. Theory predicts that this decline should be significant even within the virial radius (e.g., Frenk et al. 1999). This cluster property is encountered in the north part of Abell 401, as Fig. 11 shows. The temperature drop was initially noted in the analysis of the temperature profiles in the sectors of Section 3.2.3. The analysis of Section 3.2.3 was restricted to the inner 10 arcmin, but now we find that the decline carries further out to 0.7. Figure 11 shows that at a distance of 0.35 the temperature drops to approximately (35-60) percent of its core value. This lower temperature to the north of the cluster centre can also be seen in Fig. 9.
The numerical simulations of Frenk et al. (1999) predict a somehow milder drop. If we also compare our result with the theoretically derived universal temperature profile of Loken et al. (2002), we find once again that our data indicate a temperature decline to the North of Abell 401 marginally steeper than our expectations. Although, it has to be noted that the universal temperature profile of Loken et al. (2002) seems to overpredict the temperature of the core of Abell 401 (see Fig. 11).
Observationally, if we compare with the temperature profiles derived from the BeppoSAX data (De Grandi & Molendi 2002), and ASCA satellite (e.g., Markevitch et al. 1999), we see that the temperature at large radii to the North of Abell 401 is consistent with the lower temperature bounds at similar radii. Recent XMM-Newton observations of the relaxed cluster Abell 1413 have seen a similar temperature drop (Pratt & Arnaud 2002), but again somewhat milder than the one we observe here. They find that at a similar radius (0.35) the temperature is (75-81) percent its core value, however in the case of Abell 1413 it is difficult to define a ‘core’ temperature, since it hosts a mild cooling flow appearing as a dip in the temperature profile.
It has also to be noted here, that the X-ray flux in the same sector at large radii from the cluster centre appears somehow suppressed. The comparisons with the other four surface brightness profiles of Fig. 5, and with the global -model reveal a lack of substantial emission at radii 6 arcmin along sector-N. This behaviour can be also seen in Fig. 10. Additionally, the 1-dimensional analysis of Section 3.1.2 finds the steepest -index (=0.727; see Table 3) in this sector. Thus, in summary, the XMM-Newton data confirm that the temperature to the North of Abell 401 declines. However, this drop seems to be steeper than the theory predicts and observations of relaxed clusters find. Additionally, it is accompanied by a drop in the surface brightness distribution in the same area.
6 Radio Emission
Abell 401 was one of the first clusters along with Coma that were found to host extended radio emission (‘radio halo’), that is not associated with any cluster galaxy (Harris & Romanishin 1974). Radio halos are rare radio sources, and they have been found in the inner, 1 Mpc of X-ray bright and hot clusters [see Giovannini & Feretti (2000) for some recent examples]. They locate the site of relativistic electrons and magnetic fields in clusters. Since the first discoveries, significant advances have been made in understanding their origin. It has been found, for example, that they are always associated with clusters that are undergoing disturbances from recent or on-going merging events (e.g. Buote 2001), although not all merger remnants host a radio halo. Recent deep X-ray and radio observations have confirmed that this is true in some cases studied (e.g., Markevitch & Vikhlinin 2001).
The most favoured explanation for their origin currently, is that the electrons have been recently accelerated to the required relativistic velocities by shock waves or turbulent gas motions, that are generated during cluster mergers (e.g., Feretti 1999).
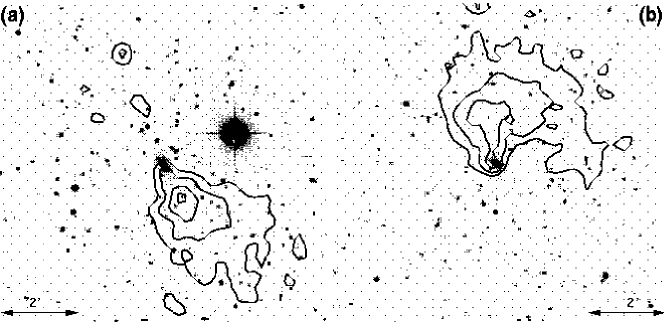
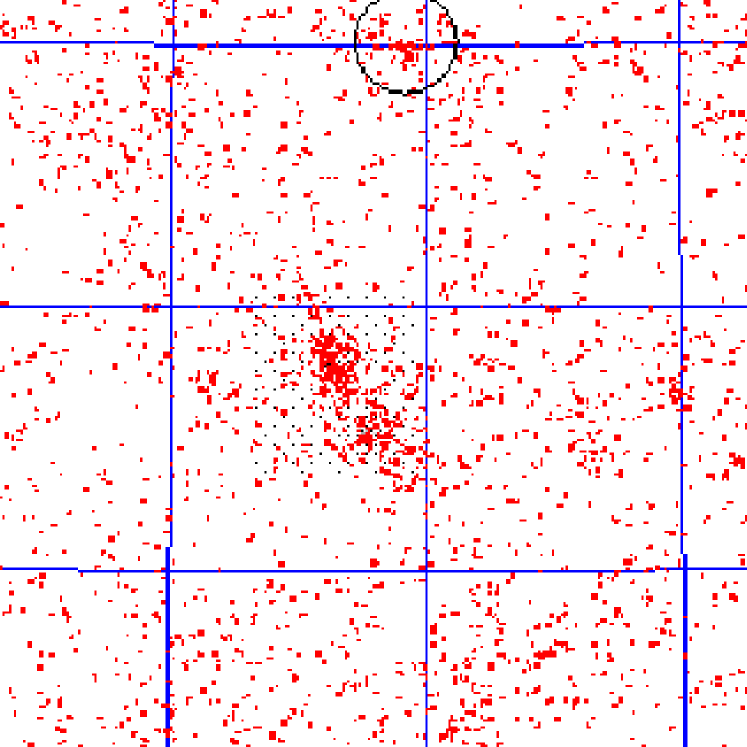
In Fig. 12 we overlay the radio contours taken from the NRAO VLA Sky Survey (NVSS) on the XMM-Newton co-added raw images from the two MOS cameras. An overlay on the hardness ratio images is shown in Fig. 9.
The presence of a radio halo in the core of Abell 401 has been recently confirmed by deep VLA observations (Bacchi et al. 2003). The same is not true for the halo in Abell 399, where the detection in the NVSS data is only significant at the 2 level (G. Giovannini, private communication). This diffuse radio emission was classified as a radio halo by Giovannini, Tordi & Feretti (1999) in their search for new radio halos in the NVSS data, but because the emission is weak it did not meet their selection criteria for its inclusion in their final sample, and was not considered further in their publication.
Inspection of the hardness ratio maps of Fig. 9 and temperature profiles of Fig. 5 does not reveal any harder emission that might be closely associated with the radio halo in Abell 401, although some small scale variations might be present. On the other hand, there is more striking evidence that the halo in Abell 399 might be due to acceleration of electrons by shock waves. It appears to be associated with the bright edge seen in the raw X-ray images of Fig. 12. At its location a higher gas temperature was derived by the fits to the XMM-Newton spectra with thermal models (Fig. 4), indicating that the emission is harder (as also seen in the hardness ratio map of Fig. 9).
In principle, radio halos might serve as chronometers of mergers. The radio emission should fade away quickly (0.1 Gyr, Jaffe 1977), hence the presence of a halo suggests that some recent disturbance has taken place in a cluster. For example, in Abell 399 we find the radio halo associated with harder X-ray emission and the edge. Thus, we might be witnessing there electrons that are currently being accelerated. On the other hand, in Abell 401 we don’t find any close spatial correlation between the radio halo and the X-ray emission. This could be explained if turbulent motion after the merger has given rise to the radio emission.
The peripheries of both clusters also host a number of tailed radio galaxies (e.g., Burns & Ulmer 1980; O’Dea & Owen 1985; Mack et al. 1993). It has been argued (Bliton et al. 1998), that the existence of tailed radio galaxies in clusters is closely connected to the disturbances induced by recent mergers: more tailed sources are found in clusters that have suffered a recent merger event.
Detailed discussion on the radio properties of the clusters, their relation to the X-ray emission, and presentation of our recently approved deep VLA observation is left to a later publication.
7 The large scale environment of the system
As mentioned in the introduction, both clusters are at the same redshift (table 1), and their projected separation is only 3 Mpc. A comparison of this separation with the average separation of Abell clusters of galaxies (20 Mpc), indicates that Abell 399/401 is an exceptionally close pair of clusters. Such close separations are normally encountered only in dense superclusters. It is worth also noting that in Abell cluster catalogues there are only 46 pairs of clusters out of 786 at a redshift less than 0.1, that have closer separation than the Abell 399/401 pair (S. Raychaudhury, private communication). However, there is no previous record of possible membership of Abell 399 and Abell 401 in a dense supercluster.
In order to check if the environment of the system is especially dense, we plot in Fig. 13 the location of all the galaxies found in NED in an area of () degrees around the system. A redshift restriction between redshifts of 0.06 and 0.09 reveals that the most of the galaxies recorded in NED come from the study of Oegerle & Hill (1993), which was concentrated in a small region around the cluster pair. In Fig. 13, one could see some smaller concentrations of galaxies around the binary system. Apart from the foreground Abell 397 (at =03h10m36.1s =+09d48m19s), and the background Abell 421 (=03h10m36.1s =+09d48m19s), the rest either don’t have redshift information or are background objects.
ROSAT All-Sky images (RASS) are no more revealing. The analysis of the RASS images does not show any bright extended source which might be another cluster close by. Using the RASS images to identify smaller galaxy groups we search for traces for a filament/supercluster. We find only 2-3 faint clumps around the pair, but there is no information recorded about them in any database, and they don’t appear to have bright optical counterparts, forcing us to conclude that they are background quasars. Thus, currently, there is no evidence for a dense supercluster, or filamentary structure around the cluster pair.
8 Discussion
8.1 Evidence for interactions between the two?
8.1.1 Tidal interactions
The above XMM-Newton analysis finds the cores of both clusters showing evidence for deviations from the traditional expectations for relaxed clusters. Given their close proximity, one would think that these disruptions may be due to tidal interactions. Next, we compare the strength of the tidal and gravitational fields, and assess the significance of tidal forces in disrupting the clusters at small and large radii.
The gravitational acceleration in a cluster can be derived from its X-ray properties assuming isothermality, as follows:
| (1) |
where the density distribution [] follows the -model:
| (2) |
The central density is , with and being the mean molecular weight, and proton mass respectively.
The tidal field [] experienced by cluster because of the presence of cluster at distance , is :
| (3) |
where is measured from the centre of cluster A. Assuming that both clusters are spherically symmetric, the accelerations can be calculated from eq. (1).
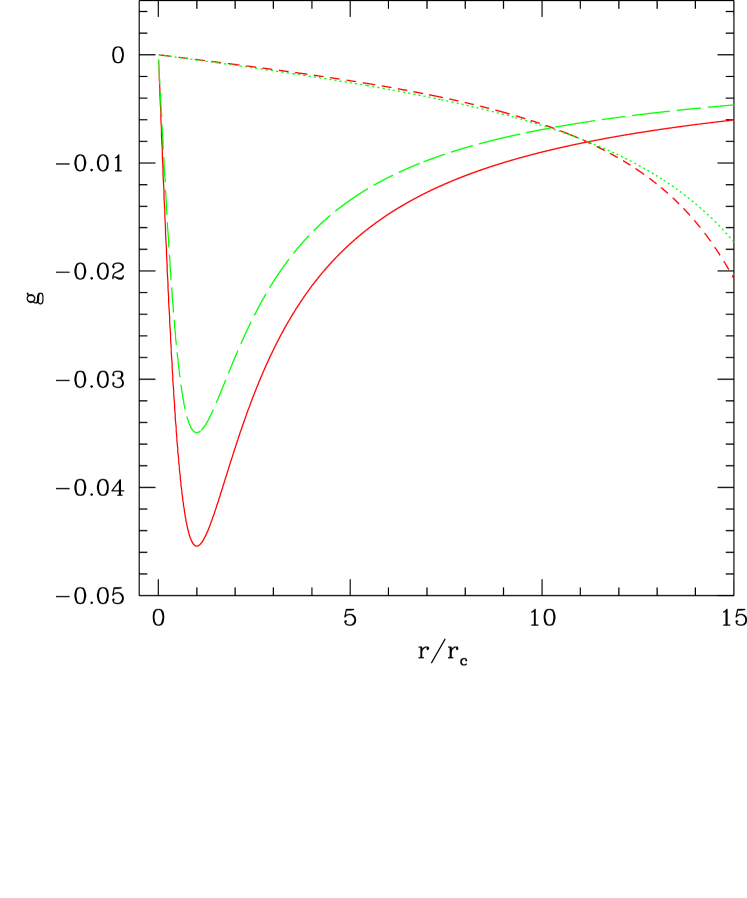
In Fig. 14 we also show the for Abell 401 (short dash) and Abell 399 (dotted line). This figure demonstrates that the tides in both cluster cores are negligible compared to the binding force. The equality is reached at a distance of arcmin. We thus, don’t expect that the tidal field is responsible for the asymmetries we see inside the core regions of both clusters (the temperature structure, the 2-dimensional residuals, the presence of the radio halos).
However, tides may become important at larger radii. For example Fig. 4 and Fig. 5 show that the surface brightness distribution in Abell 399 appears more extended in sectors-N and -W. The same behaviour is observed in Abell 401, where sector-S (the one that is facing Abell 399) has more extended distribution than the other three. According to Fig. 14 at a distance of 8 arcmin 4 the tidal acceleration is 10 percent of the gravitational acceleration binding each cluster, and the difference decreases rapidly further out. Thus, we expect that the tidal field might contribute in modifying the gas distribution of both clusters at large radii.
Tidal forces will tend to stretch the gas along the line that connects the two clusters and compress it along the perpendicular direction. However, for Abell 399/401 the lateral compression should be rather small compared to the expansion. We find for example, that for a shell of gas at a distance of (6-7) arcmin from the cluster centres the force responsible for the lateral compression is always 1 order of magnitude smaller than the force responsible for the extensions towards the other member of the system. If the gas stretches adiabatically we do not expect that its temperature increases as is evident in Fig. 11. An adiabatic expansion results in a temperature decrease, which is not what we observe.
The above discussion demonstrates that tidal forces alone cannot explain the irregularities seen in the surface brightness profiles at (8-10) arcmin radius from the clusters centres. The tidal fields are only 10 percent of the gravitational field that such radii. Thus, tidal forces (stretching or lateral compression) have difficulty in explaining the increased temperature we find in the intercluster gas in Fig. 5.
8.1.2 Compression
A comparison of the temperature profile to the North of Abell 401 with the one to the South (see Fig. 11) reveals that the temperature at (10-20) arcmin from the centre of Abell 401 to the South is somehow increased. Although we have already argued that the temperature drop to the North is steep, a comparison with the universal cluster temperature profile of Loken et al. (2002) also indicates that the temperature appears to be elevated.
In the same region, we found in Section 4.1 an increased flux above a superposition of the two clusters. Thus, in this region we might be witnessing a compression wave, which could be a sign that the two clusters are approaching each other, and their gases have already started interacting.
From the excess of the flux we measured in Section 4.1, we find that (we use index for the post compression quantities, and are the undisrupted values, and is the photon flux). Using , the compressed region is denser by . If the compression is isentropic, we find that the temperature should have increased by a factor . Taking the pre-compression temperature () of this region to be somewhere between the observed value and the theoretical value of Loken et al. (2002) at the same distance to the North of the cluster centre (ie., k keV), we find that a compression could boost the temperature up to (7-8) keV, somewhat lower than the observed of (7.5-10.0) keV, but similar within the errors. Such a compression would reproduce the excess seen in the surface brightness from this region.
Another possible explanation for the increased temperature and flux in this region is that it is due to a shock wave. If this is the case, using eqn. (2) from Markevitch, Sarazin & Vikhlinin (1999), we find that the Mach number of their relative motion should be , and the compression factor 1/. For the above calculation we use , a preshock temperature of k keV, and postshock temperature of k keV. Such a shock wave would have increased the flux by an amount of . Thus, in Section 4.1 we should have measured a flux of , 2.5 times more than what we actually observe (see Section 4.1).
Therefore, we conclude that it is possible that we are witnessing a compression region to the South of Abell 401, in the direction of Abell 399, as a shock would have boosted the flux to much higher levels than the observed. This finding suggests the possibility that Abell 399 and Abell 401 have already started interacting. If it is correct, they should be at early stages of merging, since the XMM-Newton results are not as dramatic as seen in the simulated images of merging clusters (e.g., Takizawa 1999) at later stages of their evolution, and their projected separation is as large as 3 Mpc. Note also that the effects of such an early interaction should not affect the inner regions of the clusters.
8.2 Collisions
8.2.1 Have they been through each other?
As mentioned in the introduction, it has been suggested in the past that the two clusters have already passed through each other (Fabian et al. 1997). Clusters of galaxies comprise two main components: the collisionless dark matter, and the collisional gas. When two clusters collide, the dark matter particles do not interact. Each dark matter distribution can initially retain its ‘identity’, and after the collision carry on moving largely undisturbed. On the other hand, the two gaseous components collide, with dramatic consequences. Shock waves are formed and propagate within the gas, which is heated to high temperatures. As a result the gas does not follow the dark matter, but is left behind, between the two dark matter components. This is clearly seen in numerical simulations of merging clusters. For example, Roettiger, Loken & Burns (1997) show that after core crossing, the dark matter components carry on moving away from each each for a time, before they re-collapse to form a common dark matter halo. However, the two gas components never detach, and don’t follow the two separate dark matter potentials. Hence it seem very unlikely that a past head-on merger could provide an acceptable model for Abell 399/401.
8.2.2 Off-centre collision
Another possible scenario that could potentially explain the core disruptions and the large-scale irregularities is that of an off-centre collision. Abell 399 could have come from the North, and Abell 401 the South, they have swung closely around each other once in the past, and have now separated following this close encounter. A favourable combination of the closest separation and relative velocity could disrupt the clusters’ central regions, by the propagation of strong shocks. Details and results of this process can be seen in the numerical simulations of Ricker (1998) and Ricker & Sarazin (2001). Although this explanation for the dynamics of the system might seem attractive, caution is suggested by the facts that both clusters appear fairly relaxed at large radii, and that their current separation is 3 Mpc.
Based on cosmological arguments, a typical impact parameter for a cluster collision is , where is the clusters scale length [see Sarazin (2001) for further details]. For such an impact parameter, numerical simulations show that after the first close encounter, the clusters never acquire a large separation. Tidal friction brings them together again, after some (3-4) Gyr, and they finally merge to form a single remnant. However, larger impact parameters are possible, so we compare the Abell 399/401 system with the simulations of Ricker & Sarazin (2001), for their maximum impact parameter of . These simulations involve the collision of a pair of 2 keV clusters, so we must scale their results to the larger masses of the 7-8 keV Abell 399/401 system. Since , our clusters are more massive by a factor of 8. If all lengths are scaled as , then densities are unchanged (as required for virialised systems at a given epoch), as is the timescale of the interaction.
The Ricker & Sarazin (2001) simulations predict that 2 Gyr after the first close encounter, the clusters have the largest separation, which is Mpc. Scaling this distance by a factor of two (81/3), we expect a maximum separation after a large impact-parameter encounter, of no more than 2 Mpc, which is smaller than the minimum projected separation of 3 Mpc we observe. Moreover, the temperature map of the collision at t=2 Gyr, shows significant structure, with prominent cold tails emanating from both cluster cores. The XMM-Newton results do not agree well with this picture.
In summary, whilst an off-set collision has the potential to explain both core heating and large scale asymmetries in the gas, the large separation of Abell 399 and Abell 401, and the modest nature of their temperature structure, do not appear to be compatible with such a model.
8.3 Dynamical state of Abell 399
Most of the features uncovered by the analysis of the XMM-Newton data lead us to conclude that Abell 399 is far from being a relaxed cluster, but it is more likely that we are witnessing a young merger remnant: there is an edge to the east of the core (sector-E in the previous discussions), apparent in the XMM-Newton images; the temperature inside this edge is 6.7 keV, while immediately outside it increases to 8.3 (see Fig. 4); the image analysis (1- and 2-dimensional) gives uncommonly low values for ; there is no evidence for a cooling flow; and there appears to be a weak radio halo, which seems to coincide with the location of the edge mentioned above; there are narrow tailed radio galaxies (NATs) at large distances from the cluster centre.
Thus, the most plausible explanation for all these properties is that a small cloud of material has recently fallen towards the centre of Abell 399, roughly in the East-West direction. The impact has created the ‘indentation’ (or edge) to the West of the cluster core. Numerical simulations of merging clusters (e.g., Takizawa 1999; Roettiger, Loken & Burns 1997) show that during the infall of even low mass systems into larger ones such an indentation is created in the gas density distribution, as the velocity field drags gas towards the cluster centre of the more massive cluster. Simulations also predict the existence of two shock waves that propagate in opposite directions along the collision axis. We see some evidence for such structures in the temperature profiles obtained in different sectors of Fig. 4(a): the ‘leading’ shock (in-front of the infalling blob or group), which reaches a maximum temperature of keV in the central 2 arcmin, appears in sectors-W and -S; the ‘back’ shock is expected behind the infalling group, and may be seen in the sector-E at a temperature of keV. As expected, the ‘back’ shock is at larger distances than the leading shock from the cluster centre, as it travels in less dense medium, going down the density gradient.
The exact orientation and temperature of the shocks depends of course on the choice of the sectors, and the 3-dimensional orientation of the collision direction. However, we believe that the merger is taking place close to the plane of the sky. In support of this, the analysis of Girardi et al. (1997) finds no substructure in the redshift data of Abell 399, and the clarity of the ‘indentation’ also suggests that we view the collision from an essentially perpendicular perspective.
As seen in the simulations of colliding clusters, at the early stages of the event the surface brightness distribution appears elongated along an axis perpendicular to the collision direction. This could explain the orientation of the residuals of the 2-dimensional fits, that appear elongated along the North-South direction.
The last piece of evidence that argues for the merger hypothesis is the presence of diffuse radio emission in the central regions of the cluster (see Fig. 12 and Fig. 9). Although its presence is still to be confirmed by deep VLA observations, the XMM-Newton data provide a first evidence that it might be associated with a shock that was created during a recent merger event. Thus, we conclude that Abell 399 is undergoing a merger event with a smaller group, and they are close to the stage when their two cores collide.
8.4 Dynamical state of Abell 401
Abell 401 appears also to be disturbed by a merger: there is temperature structure evident in Fig. 5; the core region is hotter (see Fig. 8); the surface brightness appears elongated along the North-South direction; there is no cooling flow; the -models that describe best the surface brightness distribution are not representative of relaxed clusters; bright residuals are seen in the 2-dimensional spatial analysis; the inner 2 arcmin along sector-N and -S are at hotter temperatures that the rest; there is a significant temperature decline along sector-N, which is accompanied by a rapidly declining X-ray flux; there is a radio halo, brighter than the one in Abell 399 (see Fig. 12), and many tailed radio galaxies.
Thus, a past merger scenario could explain all the above findings, if one considers that a small group or cloud of material has fallen into the main cluster from approximately the North, North-West direction, and now is travelling trough the core region. Its motion has caused the temperature enhancement in the inner 2 arcmin along sector-N and -W. It has also dragged the X-ray emitting material towards the cluster core, depleting sector-N from its gas, in a similar manner as in Abell 399 sector-E.
9 Summary and conclusions
We summarise here the main results of the XMM-Newton study of the Abell 399/401 binary cluster system and the conclusions about the its dynamical state that are favoured by them.
-
•
The XMM-Newton data confirm the lack of cooling flows in the cores of both clusters.
-
•
The image analysis gives values that are lower than the expected canonical value of 0.65 found in rich clusters of galaxies. In neither cluster is the gas azimuthally symmetric around the central cD galaxy.
-
•
A 2-dimensional analysis reveals a lop-sided excess (200 kpc) around the central galaxies.
-
•
There is temperature structure in the inner (200-400) kpc of both clusters, which argues for the presence of complex structures within the cluster cores, possibly due to shock waves and cold fronts.
-
•
Abell 399 shows a sharp edge to the East of the cluster centre, which is associated with harder X-ray emission. The temperature profile to the North of Abell 401 declines steeper than expected, and there is a lack of flux in the same area.
-
•
Both clusters appear to host central radio halos, although the one seen in the NVSS data of Abell 399 requires confirmation. This halo in Abell 399 appears to follow an edge apparent in the X-ray images, and is associated with harder X-ray emission.
-
•
There is a plethora of tailed radio galaxies in and around both systems.
-
•
We find that the flux from the space between the two clusters is slightly enhanced, above what is expected from the superposition of the two clusters. This region appears also hotter than the region on the opposite side of the cluster core, and the temperature distributions predicted for relaxed clusters by numerical simulations.
-
•
The large scale environment around the binary system appears surprisingly empty. There is no evidence in the galaxy distribution and RASS data for the presence of other clusters nearby.
The ‘substructure’ XMM-Newton finds in the core cluster regions cannot be explained by the tidal field generated by the presence of the other cluster. On larger scales, (10-20) arcmin(0.8-1.6) Mpc from the cluster centres, tidal forces become gradually far more important, in shaping the gas distributions. However, we find that the extensions of the gases towards the other member of the system seen in the XMM-Newton data cannot again be solely due to their mutual interactions. If the gases were extended by gravitational forces, their temperature should have been lower than what we observe. It is apparent that an additional driving force is required.
We also find that the properties of Abell 399/401 cannot be reproduced by scenarios that either involve off-centre cluster collisions, or that speculate that they have been through each other once. An offset collision provides the only single mechanism which might explain all the properties of the system, but that it doesn’t seem consistent with the observed large separation and limited disturbance of the clusters at large radii from the cluster centres. On the other hand our analysis finds evidence for increased flux and temperature in the region in-between the two. It appears that the two have already stated interacting mildly, and that we are witnessing a compression region between them.
The most possible explanation for the properties we find in the core region of the clusters is that they are due to each ones past merger activity. It seems that each cluster is a merger remnant. A similar evolutionary scenario has been recently proposed by Belsole et al. (2003) to explain the unequal system Abell 1750. Indeed, in a hierarchical structure formation scenario, binary cluster systems might be the late stages of cluster formation, just before the final merger takes place and one rich cluster is formed. The numerical simulations of Frenk et al. (1996) show two clusters forming at a close proximity, by the merging of smaller units, before the two finally merge to form a single rich cluster at present day. Additional support for our proposed model comes from the inspection of simulated X-ray images and temperature maps (from the Simulated X-ray Cluster Data Archive, http://sca.ncsa.uiuc.edu/). These simulations show the X-ray flux and temperature stucture of clusters as they are formed from the continuous accretion of smaller structure. An extensive search though this archive indicates that pairs of large clusters are formed, indeed by the merging of filaments from directions that do not necessarily coinside with the direction to the nearest massive cluster. Additionally, the development of shock waves can be witnessed when the two clusters are at close separations. Additionally, they confirm the presence of features like the indentaion and shock wave to the East of Abell 399, as being produced during the infall of a smaller group. Hence, for this pair of galaxies, we favour a model which combines some early interaction, with a minor merger history.
Acknowledgments
We are grateful to Somak Raychaudhury and Gabriele Giovannini for helpful discussion and suggestions. We would also like to thank Andrew Read for the use of his software and advice on XMM-Newton analysis. The help of Patrick Motl with the Simulated X-ray Cluster Data Archive, and very useful conversations are also kindly acknowledged. The referee, Jack Burns, provided us with constructive comments. We would also like to acknowledge Elena Belsole for useful discussions and comments. The Digitized Sky Survey, and the NASA/IPAC Extragalactic Database have been used. The present work is based on observations obtained with XMM-Newton an ESA science mission with instruments and contributions directly funded by ESA Member States and the USA (NASA).
References
- (1) Acreman D.M., Stevens I.R., Ponman T.J., Sakelliou I., 2003, MNRAS, 341, 1333
- (2) Bacchi M., Feretti L., Giovannini G., Govoni F., 2003, A&A, 400, 465
- (3) Belsole E., Pratt G.W., Sauvageot J-L., Bourdin H., 2003, astro-ph/0311556
- (4) Bialek J.J., Evrard A.E., Mohr J.J., 2002, ApJL, 578, L9
- (5) Bliton M., Rizza E., Burns J.O., Owen F.N., Ledlow M.J., 1998, MNRAS, 301, 609
- (6) Buote D.A., 2001, ApJL, 553, L15
- (7) Burns, J.O., Ulmer, M.P., 1980, AJ, 85, 773
- (8) Burns, J.O., Motl P.M., Norman M.L., Bryan G.L., 2004, Proceedings of The Riddle of Cooling Flows in Galaxies and Clusters of Galaxies, eds, T. Reiprich, J. Kempner, & N. Soker.
- Cavaliere (1976) Cavaliere A., Fusco-Femiano R., 1976, A&A, 49, 137
- (10) De Grandi S., Molendi S., 2002, ApJ, 567, 163
- Donnelly (2001) Donnelly R.H., Forman W., Jones C., Quintana H., Ramirez A., Churazov E., Gilfanov M., 2001, ApJ, 562, 254
- (12) Evrard A.E., Metzler C.A., Navarro J.F., 1996, ApJ, 469, 494
- Fabian (1997) Fabian A.C., Peres C.B., White D.A., 1997, MNRAS, 285, L35
- (14) Feretti L., 1999, in IAU Symp.199, astro-ph/0006379
- Finoguenov (2001) Finoguenov A., Reiprich T.H., Böhringer H., 2001, A&A, 368, 749
- (16) Frenk S.C., Evrard A.E., White S.D.M., Summers F.J., 1996, ApJ, 472, 460
- Fujita (1996) Fujita Y., Koyama K., Tsuru T., Matsumoto H., 1996, PASJ, 48, 191
- (18) Giovannini G., Feretti L., 2000, New Astronomy, 5, 335
- (19) Giovannini G., Tordi M., Feretti L., 1999, New Astronomy, 4, 141
- Girardi (1997) Girardi M., Escalera E., Fadda G., Guiricin G., Mardirossian F., Mezzatti M., 1997, ApJ, 482, 41
- (21) Gómez P.L., Loken C., Roettiger K., Burns J.O., 2002, ApJ, 569, 122
- (22) Harris D., Romanishin W., 1974, ApJ, 188, 209
- (23) Henriksen M.J., Tittley E.R., 2002, ApJ, 577, 701
- (24) Irwin J.A., Bregman J.N., Evrard A.E., 1999, ApJ, 519, 518
- (25) Jaffe W.J., 1997, ApJ, 212,
- (26) Kempner J.C., Sarazin C.L., Ricker P.M., 2002, ApJ, 579, 236
- (27) Lampton M., Margon B., Bowyer S., 1976, ApJ, 208, 177
- (28) Loken C., Norman M.L., Nelson E., Burns J.O., Bryan G.L., Motl P., 2002, ApJ, 579, 571
- Lumb (2002) Lumb D. 2002, ‘EPIC BACKGROUND FILES, XMM-SOC-CAL-TN-0016, issue 2.0
- (30) Mack K.-H., Feretti L., Giovannini G., Klein U., 1993, A&A, 280, 63
- (31) Markevitch M., Vikhlinin A., 2001, ApJ, 563, 95
- (32) Markevitch M., Forman W.R., Sarazin C.L., Vikhlinin A., 1998, ApJ, 503, 77
- (33) Markevitch M., Sarazin C.L., Vikhlinin A., 1999, ApJ, 521, 526
- (34) Markevitch M., Vikhlinin A., Forman W.R., Sarazin C.L., 1999, ApJ, 527, 545
- (35) Markevitch M., Ponman T.J., Nulsen P.E.J., et al. 2000, ApJ, 541, 542
- (36) Nevalainen J., Markevitch M., Forman W.R., 1999, ApJ, 526, 1
- (37) O’Dea C.P., Owen F.N., 1985, AJ, 90, 927
- (38) Oegerle W.R., Hill J.M., 2001, AJ, 122, 2858
- (39) Oegerle W.R., Hill J.M., 1994, AJ, 107, 857
- (40) Peres C.B., Fabian A.C., Edge A.C., Allen S.W., Johnstone R.M., White D.A., 1998, MNPAS, 298, 416
- (41) Ritchie B.W., Thomas P.A., 2002, MNRAS, 329, 675
- (42) Ricker P.M., 1998, ApJ, 496, 670
- (43) Ricker P.M., Sarazin C.L., 2001, ApJ, 561, 621
- (44) Roettiger K., Burns J.O., Loken C., 1996, ApJ, 473, 651
- (45) Roettiger K., Loken C., Burns J.O., 1997, ApJS, 109, 307
- (46) Pratt G.W., Arnaud M., 2002, A&A, 394, 375
- Pratt (2001) Pratt G.W., Arnaud M., Aghanim M., et al. 2001, astro-ph/0105431
- (48) Sakelliou I., Merrifield M.R., McHardy I.M., 1996, MNRAS, 283, 673
- (49) Sarazin C.L., 1986, Rev. Mod. Phys., 58, 1
- (50) Sarazin C.L., 2001, in Merging Processes in Clusters of Galaxies, ed. L.Feretti, I.M.Goia, & G.Giovannini (Dordrecht: Kluwer), astro-ph0105418
- Slezak (1994) Slezak E., Durret F., Gerbal D., 1994, AJ, 108, 1996
- (52) Schindler S., Müller E., A&A, 269, 93 1993
- (53) Slezak E., Durret F., Gerbal D., 1994, AJ, 108, 1996
- (54) Sun M., Murray S.S., Markevitch M., Vikhlinin A., 2002, ApJ, 565, 867
- (55) Takizawa M., 1999, ApJ, 520, 514
- (56) Ulmer M.P., Cruddace R.G., 1981, ApJL, 246, L99
- (57) White D.A., 2000, MNRAS, 312, 663
- (58) White D.A., Jones C., Forman W., MNRAS, 292, 419