Multiwavelength study of the very long GRB 020410
GRB 020410 is by far the longest -ray burst (with a duration of about 1600 s) to have been followed up from the X-ray through the radio regime. Afterglow emission was detected in X-rays and at optical wavelengths whereas no emission was detected at 8 GHz brighter than 120 Jy. The decaying X-ray afterglow, back extrapolated to 11 hours after the burst, had a flux of erg cm-2 s-1 (2–10 keV); the brightest detected so far. No direct redshift determination is available yet for this GRB, but according to the empirical relationship between the peak energy in the spectrum and the isotropic energy output, is constrained in the range 0.9–1.5. The reconstructed optical afterglow light curve implies at least two breaks in the simple power-law decay. This may be related to emergence of a SN, or refreshment of the external shock by a variation in the circumstellar medium. By comparing the backward extrapolation of the 2–10 keV afterglow decay, it is shown that the long duration of the prompt emission is not related to an early onset of afterglow emission, but must be related to prolonged activity of the “central engine”.
Key Words.:
Gamma rays: bursts; X-rays: bursts1 Introduction
Gamma-ray Bursts (GRB) show great diversity with regard to both their durations and spectral properties. GRBs last from a fraction of a second to thousands of seconds, as established by the BATSE survey (e.g. Paciesas et al. (1999)). Prompt X-ray counterparts of GRBs, detected by Ginga, BeppoSAX, HETE-2 have a very wide distribution of intensities and durations. Tails and precursors of X-ray counterparts were also observed by WATCH/Granat (Castro-Tirado et al. (1994)). Those events characterized by an X-rays-to--rays (2–10/40–700 kev) fluence ratio larger than are classified as X–ray rich (e.g. Feroci et al. (2001)). Moreover, transient X–ray sources with characteristics similar to those of GRB counterparts, although with no simultaneous GRB detection (so called “X-ray flashes”; Heise et al. (2001); Mochkovitch et al. (2003)) were detected by the BeppoSAX Wide Field Cameras (WFC) and, subsequently, by the HETE–2/FREGATE instrument. Recently (in ’t Zand et al. (2003)), have reported the detection of 4 long, faint X-ray transients during sky surveys with the BeppoSAX-WFC. Three of these are confirmed GRBs, because they coincide with BATSE detections. They show durations ranging from 540 s to 2550 s and are characterized by a mildly soft spectrum.
The very different ratios of -ray vs X-ray peak fluxes or fluences point either to different viewing angles of the relativistic jets in which GRBs are formed (e.g. Granot et al. (2002); Yamazaki et al. (2002)) or to a different amount of baryon contamination of the fireball (e.g. Dermer (1999); Huang et al. (2002)). Furthermore, the existence of a class of GRBs with long X-ray durations is important for the investigation of the connection between the prompt and afterglow components and may also suggest a high redshift origin. However, redshift constraints imposed on XRF 020903, 030723 and, possibly, 031203 do not support the high redshift scenario (Soderberg et al. (2003); Prochaska et al. (2003); Fynbo et al. (2004)).
GRB 020410, first detected in X-rays only by the BeppoSAX-WFC (Gandolfi (2002)), stands out for its long duration, more than 1500 s in the 2–28 keV band (see Sect. 3.1), and for the relative weakness of its -ray signal, detected by Konus-Wind in an offline analysis. Based on its X-ray-to--ray fluence ratio (see Sect. 3), GRB 020410 lies in the soft tail of genuine GRBs and marginally qualifies as an “X-ray rich” GRB (see Heise et al. (2001)). Upon detection of the GRB we started an X-ray and optical search and monitoring campaign of its afterglow. We present here the results of our study of the prompt and afterglow emission.
2 Observations
The BeppoSAX Wide Field Camera unit 2 (Jager et al. (1997)) detected a transient event on April 10, 2002, 10:39:40 UT () at coordinates , . The off-axis angle was 109 in a field of view of . Due to battery efficiency degradation, the BeppoSAX Gamma-Ray Burst Monitor (GRBM) was switched off so the association of the WFC event with a GRB could not be immediately verified. After the WFC detection, lacking a GRBM measurement, we searched the ratemeters of other -ray monitors. The most sensitive instrument, apart from the GRBM, with low energy coverage is Konus on the Wind satellite (Aptekar et al. 1995). An off-line analysis of Konus data allowed us to confirm the GRB nature of the event (see Sect. 1.3). In order to exclude the possible recurrent/flaring nature of the source detected by the WFC, we performed a detailed archival analysis on all the BeppoSAX-WFC data around the GRB 020410 position (covering the period 1996–2001). There were 186 observing periods with a net exposure time of 2.8 Ms (32 days). The 2–10 keV flux limit was 0.2 mCrab or erg cm-2 s-1 (this flux level is similar to that measured by the BeppoSAX ToO observations; see below). No stable or flaring source was detected at the position of the candidate GRB. The 2′-radius GRB error circle determined by the WFC was disseminated 4 hours after the event (Gandolfi (2002)). This prompted a fast pointing at the error box of the BeppoSAX Narrow Field Instruments (NFIs), aimed at the detection of the early X-ray afterglow (Section 2), and rapid searches for the optical (Section 3) and radio counterpart from the Southern hemisphere. The follow-up with the BeppoSAX-MECS (see Section 2) resulted in a reduction of the error region; an error box of radius was disseminated on April 18. A subsequent search for a radio counterpart at 8.47 GHz on April 23 yielded an upper limit of 200 Jy (Frail et al. (2002)).
3 Prompt emission
3.1 WFC data analysis
The WFC light curves of GRB 020410 are presented in Fig. 1. The data are background subtracted using rates of 29 and 28 cts s-1 for the lower and higher energy bands respectively. These values were determined from the light curve portions immediately preceding the event and are appropriate for the part of the detector illuminated by the source. Note that, due to the slow rise of the GRB flux at its onset, we set the start time by interpolating the rise of the first peak with an exponential function; corresponds to the time when the function reaches the zero counts level. Although this method is somewhat arbitrary, it is reliable, because our results do not change significantly if we move forward the start time by one minute. In the 16.1 hours time interval prior to the event, no signal was detected. The first sign of activity is distinguishable at high energies about 15 s before the adopted start time. The event consists of four main pulses (hereafter designated as P1, P2, P3 and P4), the first of which, P1, has a maximum peak flux of erg cm-2 s-1 in the 2–10 keV range. Earth occultation caused the end of the observation when the GRB was still active and rising, therefore we can only put a lower limit on its duration and fluence, s and erg cm-2 (2–10 keV), respectively. The truncated peak (P4) has a 2–10 keV flux erg cm-2 s-1 and it is then the highest peak in this range.
However we can make reasonable assumptions to estimate the missing flux due to the truncated peak:
-
•
its shape is Gaussian, i.e. symmetric (usually the decay is slower than the rise so this gives a lower limit to the pulse width);
-
•
it is aligned with the Konus (G1) one (see below);
-
•
its FWHM conforms to the law (see below);
-
•
the total counts are proportional to that of P3 when compared to the Konus (G1) one, i.e. the spectral shape is the same as for P3.
The extrapolated light curve is shown in Fig. 1. We find then that, including the reconstructed portion of the light curve, the event lasts s; the total counts are increased with respect to the measured ones by 22% in the energy band 2–9 keV and by 21% in 9–28 keV. The estimated fluences in 2–10 and 2–28 keV become and erg cm-2 respectively.
With its large X-ray fluence, GRB 020410 ranks in the top 3.4% of the BeppoSAX-WFC GRB+XRFs sample.

The temporally resolved WFC spectra are described by simple power-laws with varying between at start to from about s onward (see Fig. 1, bottom panel). This index range is typical for GRBs (Preece et al. (2002); Frontera et al. (2000)), even though on the soft side of the distribution and its change indicates a hard–to–soft evolution. No evidence of intrinsic absorption is found in any of the spectra; the average upper limit on the intrinsic hydrogen equivalent column density is cm-2 .
3.2 Konus data analysis
Since the event did not trigger Konus in a burst data acquisition mode, we analyzed the non-triggered data, pertaining to photon count rates at 2.944 s resolution in 3 bands: 19.5–75 keV (G1 band), 75–330 keV (G2) and 330–1270 keV (G3). The corresponding time light curves are shown in Fig. 1. The background was estimated in an analogous way as for the WFC, giving 2923 (G1), 1014 (G2) and 420 cts s-1 (G3). These are close to the nominal values, which have an accuracy of 2%. The event is clearly detected by Konus up to a few hundred keV. This confirms the GRB nature of the event detected by the BeppoSAX-WFC. There appears to be an initial signal in the G2 band at about the same time as in the upper WFC band, and the main Konus peak coincides with the first WFC peak. The other WFC peaks are also detected with Konus. A fortunate circumstance is that Konus continued to observe after the WFC pointing ended. The Konus data in the G1 band suggest that the X-ray flux continues to increase for about 100 s past the end of the WFC observation. Therefore, the absolute flux maximum in X-rays was most likely missed.
The spectra obtained by combining the data in the 3 Konus channels are not described by a simple power-law. The flux in the G3 band must be slightly suppressed to satisfy the observed count rate. If this is modeled by a power-law with an exponential cut off, we find that a shallow e-folding cutoff energy of 900 keV, in combination with a photon index of 1.8, is sufficient to explain this suppression. WFC and Konus are not inter-calibrated instruments. Fortunately they have an overlapping energy band so to get the flux in the Konus band we allowed for a free normalization respect to the WFC in a joint fit (keeping constant photon index and cut off energy). The average photon spectrum of WFC and Konus data may be described by the law ph cm-2s-1 keV-1. The 15–1000 keV fluence is erg cm-2 (for 1550 s) and the peak flux erg cm-2 s-1. The 2–10 keV to 15–1000 keV fluence and peak flux ratios are then and respectively. The fluence in the standard BATSE energy range, 50–300 keV, is erg cm-2, so that in this case the soft to hard fluence ratio is . If we consider the BeppoSAX-GRBM energy band 40–700 keV instead, the fluence is erg cm-2, giving a ratio of .
Though these values are not particularly high, they put GRB 020410 in between typical GRBs and X-ray rich events (see Fig. 2, Feroci et al. (2001) and Fig. 3 in Heise et al. (2001)). Finally, by integrating the background subtracted Konus light curves from to s, we detect a marginally significant counts excess of for the G1 and G2 bands. No excess is found in G3.

4 BeppoSAX MECS observations
At the epoch of GRB020410, only the MECS, among the BeppoSAX-NFIs, was operational because of the critical status of the satellite batteries at the end of its lifetime. The error box of the event was observed with the MECS in Target-of-Opportunity (ToO) mode on 11 April 2002, 06:53:21 UT and on 12 April 2002, 16:48:44 UT, i.e. 20.2 and 54.3 hours after the burst onset, respectively. The observations lasted 7.5 and 5.3 hours with exposure times of and ks, respectively. A third pointing was attempted but it failed because of problems in the satellite attitude control system.
A relatively bright source was detected within the WFC error circle at coordinates , (1SAX J2206.48349). The source showed a clear fading between the two epochs. We therefore identify it with X-ray afterglow emission. Thanks to the new calibration of the MECS instrument (Perri & Capalbi (2002)) we were able to set a 90% confidence error circle of radius. This position was away from the center of the WFC error circle (Gandolfi (2002)).

4.1 Spectral analysis
By fitting the MECS spectra of both ToOs with single power-laws we obtain acceptable results. The photon index is quite stable around (), typical for GRBs. The 2–10 keV average flux is and erg cm-2 s-1 for the first and second ToO, respectively. Due to the lack of the LECS data we included in our analysis the lower energy MECS data down to 1.3 keV (instead of the usual 1.6 keV). We verified the validity of the response matrix and data quality in this range. No extra absorption above the Galactic one is detected. However, driven by systematic deviations in the residuals, we also tried to fit additional components. In particular, we added a Gaussian component to model the bump visible around 3 keV (see Fig. 3). In the first ToO the line position is keV ( confidence). The F-test chance probability of fit improvement is 1.7% (). In the second ToO the line position is keV with a F-test chance probability of 3.5% (). Assuming the line detection is authentic, these results suggest its energy is changing, although a blend of multiple components could mimic this behavior instead (see below). Next, we fitted the first ToO split in two, both with a simple power-law and with an additional Gaussian. Also in this case the line position, though at level, is not stable, being keV in the first and keV in the second half of the ToO. The F-test chance probabilities for the two sections are 5.8% and 4.6%, respectively. In Table 1 a summary for all these fits is presented. Because the statistics are poor to confirm the presence of emission lines, our confidence level about the above reported results are (as shown) level results. We performed 3000 spectral simulations (1000 for each of the halves of ToO 1 and 1000 for ToO 2) of a power-law with parameters fixed to those obtained for our data and checking the improvement adding a Gaussian line of width 0.1 keV falling either in the whole MECS bandpass 2–9 keV (where we detect signal) or 2.2–4 keV (line position). For the latter range we derive chance probabilities not significantly different from those derived from the F-test on the observed data. For the wider energy range the statistical significance is a factor 1.5 lower. By randomly selecting one simulated spectrum of the first half of ToO 1, one of the second half of ToO 1 and one of ToO 2, we computed the number of cases in which a line is detected in all the three spectra with line energy centroids within keV of the observed (fitted) ones and significance equal or greater than the observed ones. This number turns out to be 0.2%.
| ToO | |||||
| keV | |||||
| 1 | – | – | 0.93 | ||
| 1 | 0.80 | ||||
| 1a | – | – | 0.81 | ||
| 1a | 0.69 | ||||
| 1b | – | – | 0.80 | ||
| 1b | 0.70 | ||||
| 2 | – | – | 1.13 | ||
| 2 | 0.75 |
-
Note:
errors are 90% confidence level.
-
a
Power-law and the Gaussian normalization constants.
4.2 Temporal analysis
Figure 4 shows the MECS 2–10 keV flux measurements together with the WFC light curve binned in the same 6 time intervals used in Fig. 1 for the spectral indices. Two possible power-law decay fits are shown. One is the best fit model to the MECS ToO data (also shown in the inset), giving a fairly flat decay index of with a reduced of 0.86. The other one is the model obtained by adopting the 90% upper limit of the decay index (0.92).
Following De Pasquale et al. (2002), we calculated the 1.6–10 keV flux 11 hours after the burst using the decay index. The resulting value of erg cm-2 s-1 is the highest among all the BeppoSAX detected GRBs, the second being GRB 010222 with erg cm-2 s-1 (in ’t Zand et al. (2001)).

5 Optical observations
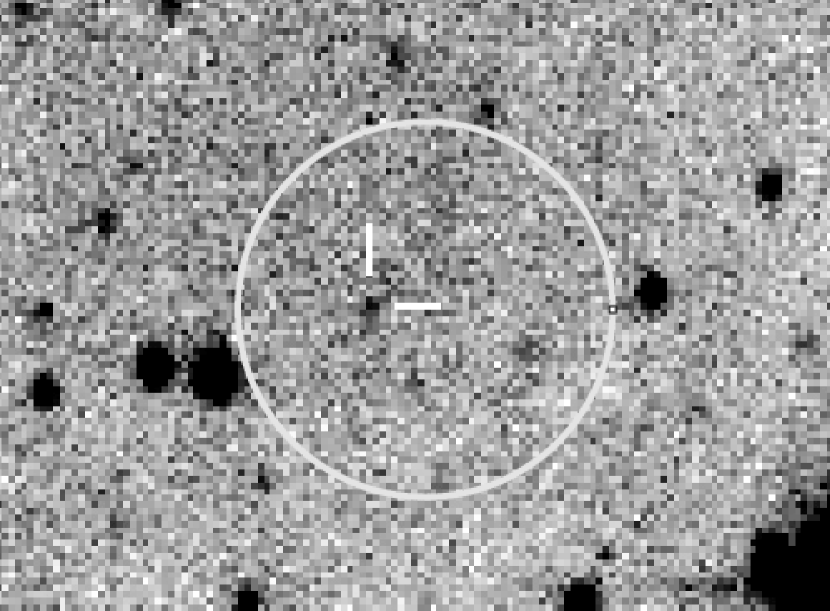
Two optical searches were attempted 6.0 and 6.28 hours after the GRB onset by two groups using two telescopes of the Mount John Observatory (MJO) located in New Zealand: the MJO 0.6-m telescope and the Microlensing Observations in Astrophysics (MOA) 0.6-m telescope. Several images were collected with the two telescope for a total of 900-s (unfiltered) for MJO 0.6-m and 800-s (wide B-band filter) and 600-s (R-band) MOA 0.6-m. No positive detection was reported when compared with the POSS-II red plates down to (Kilmartin et al. (2002); Castro-Tirado et al. (2002)). On April 17, images in UBR bands were collected with the 3.6-m ESO telescope at La Silla (Levan et al. (2004)). Further B and R bands observations were carried out at the 8.2-m ESO VLT on June 11. Due to the very poor seeing conditions () and high airmass (1.95), a limiting (R) magnitude of 24.5 for the OT is derived, which may constrain the SN maximum brightness if an underlying SN is considered. HST observations performed 27.5 and 64 days after the GRB onset revealed a variable source about away from the MECS X-ray position (Fruchter et al. (2002); Levan et al. (2004)). The decay index was . The V magnitudes reported, if converted to R using the relation of imon et al. (2001), become 24.9 and 26.5, respectively. Assuming a constant decay index, this would imply 6 hours after the burst. Driven by this finding, a more accurate analysis of the MOA data was performed leading to the detection of the optical transient with and (see Fig. 5). Re-analysis of the ESO 3.6-m R-band observation performed in April 17.31–17.35 (i.e. 6.87 days after the burst), also revealed a level source at compatible with the mag galaxy 05 away from the OT detected by HST (Levan et al. (2004)). Then we can adopt a limit of to the OT in the ESO image so that the decay index between the MJO and ESO observation is . The optical lightcurve between 10 and 20 days must clearly deviate from this decline (see Fig. 6), and this may be accounted for if the flux increases due to the emergence of another emission component (e.g. a supernova; Woosley (1993)) or a refreshed shock (Panaitescu, Mészáros & Rees (1998)). Whichever is the correct interpretation, like for GRB 991208 (Castro-Tirado et al. (2001)), a double break in the optical light curve must be invoked. A detailed study of the OT behavior and possible explanations for the late time re-bump is reported in Levan et al. (2004).

6 Discussion
GRB 020410 is by far the longest GRB event for which X-ray afterglow emission and an optical counterpart (though weak) have been discovered. The long duration of GRB 020410 can be considered “tail of the distribution” rather than a peculiar case, though peculiar circumstances are required. As the other very long GRBs detected by the WFC (in ’t Zand et al. (2003)), this event shows a high ratio between X-ray and -ray fluence, although it cannot be classified as an X-ray rich GRB. In addition, apart the high X-ray content, X-ray rich GRBs are also characterized by the lack of optical afterglow (not true for the X-ray flashe 030723 and possibly 020903), which is not the case for GRB 020410. We note, however, that the two things could not be linked as the rapidly fading OT of the “not-quite” X-ray rich GRB 021211 has demonstrated (Crew et al. (2003)). Spectroscopically, GRB 020410 does not show peculiarities. This in addition to (a) the measured upper limit on the intrinsic absorption, (b) the “smooth” increase of the spectral index, (c) the late time X-ray “afterglow” decay that does not connect to the late time prompt emission, suggest the prompt event is all due to internal shock rather than being a superimposition of internal and external shocks, or at least the latter is negligible. In the fireball model, a connection between the long duration of the “prompt” event and the slow decay of the afterglow could be accounted for e.g. by the superimposition of several (external) shocks produced by each of the main peak of the internal shock, which are all relatively long when compared to normal GRBs, causing a continuous refreshment of the external shock (e.g. Björnsson et al. (2002)).
Unlike what is observed for several GRBs (e.g. Costa (1999)) the backward extrapolation of the afterglow fading law of GRB 020410 is inconsistent with the flux measured during the last part of the prompt emission (see Fig. 4). This may be linked to the extremely long duration of the event and prevents us to derive an indication of the afterglow emission onset time. We can estimate an upper limit to the afterglow 2–10 keV fluence if, by following Frontera et al. (2000), we assume that the afterglow emission starts at 63% of the duration of the GRB and thus we integrate the fading law between 973 s and s. The result is erg cm-2, corresponding to about 34% of the fluence measured in the prompt event in the same energy range and to about 9% of the prompt fluence in 40–700 keV. These values are well within the observed range of normal GRBs (Frontera et al. (2000)).
Alternatively, it is possible to identify the onset of the external shock at s when the spectrum of the prompt emission becomes consistent with the late time MECS spectra. In the simple case in which the fireball is homogeneous and thin, the GRB variability should be suppressed and the lightcurve be described as a power-law initially rising as and then smoothly turning over to a decay slope which depends on the spectral range and dynamics of the fireball (Sari & Piran (1999)). In fact the lightcurve of GRB 020410 is highly variable after the spectral transition, showing a prominent emission episode at s (P4 in Fig. 1). This behavior can be understood if the inner engine does not turn off at the end of the gamma-ray phase, but releases a sizable amount of energy at s. This late emission, however, should be inefficient in the production of -rays or, in terms of the internal-external shock scenario, it should avoid the internal shock phase. The time s is not the deceleration time of the fireball, but the delay with which the inner engine released the fireball component that re-energized the external shock to produce the P4 rebrightening. The cause of the lack of -ray emission associated with the delayed energy release is not clear and, lacking WFC data for the P4 episode, it is difficult to constrain observationally; though the slight count excess in the Konus soft band could be an hint. The delayed energy release may however be associated to the recycling of the energy wasted while the relativistic jet propagates into the host star (Mészáros & Rees (2001); Ramirez-Ruiz, Celotti & Rees (2002)). In that case, the acceleration of the delayed fireball takes place at the star surface, and is therefore characterized by a variability timescale many orders of magnitude larger than that of the jet, effectively preventing the occurrence of internal shocks.
We also note that among the other GRBs afterglows for which the extrapolation of the decay law to the prompt emission is inconsistent with the observed flux, GRB 990704 (the X-ray richest event observed by BeppoSAX) is the only analogous case. The afterglow X-ray flux decay of XRF 031203 also shows an extrapolation below the “probable” prompt flux (Watson et al. (2004)). GRB 990510, 010222, 010214 show an extrapolation above the prompt emission, which is explained with a break a few hours after the onset (Pian et al. (2001); in ’t Zand et al. (2001); Guidorzi et al. (2003))
The peak width dependence as function of the energy was tested for P1 and P3 (see Fig. 1). To this aim we produced rebinned light curves with bin size between 1 and 8 s. Their FWHM were obtained using Gaussian fits; a 20% systematic error on their estimate was added. By using a law (expected by the synchrotron model, Fenimore et al. (1995)) for the two peaks we obtain for the P1 and for P3 (errors are 90% confidence level). These results are consistent with the results from the BATSE GRBs (Fenimore et al. (1995)) as well as for GRB 960720 (Piro et al. (1998)) and 990704 (Feroci et al. (2001)).
Due to the paucity of data and the complexity of the optical light curve, it is not possible to constrain the fireball and environment properties completely. From X-ray spectroscopy we infer the electron distribution slope under the assumption that X-rays are above the synchrotron cooling frequency. Due to the large uncertainty, the X-ray decay slope of can be accounted for both in an ISM and wind environment. It is tantalizing to note, however, that the early time optical slope seems to be larger than the X-ray one. This would fit in a wind environment scenario, consistent with the possible detection of a supernova bump at late time (Levan et al. (2004)). In this case one would expect and , fully consistent with the X-ray slope and the optical lower limit. Even this interpretation bears however some degree of uncertainty. GRB 020410 has a flux of 10.5 Jy in R and erg cm-2 s-1 in X-rays which falls outside the distribution found by De Pasquale et al. (2002)) (see their Fig. 5) and would classify it as a dark GRB (Lazzati, Covino & Ghisellini (2002)). Even assuming that the cooling frequency lies exactly at the edge of the BeppoSAX band, the synchrotron spectrum would over-predict optical emission by a factor . There are two possible interpretations for this. One possibility is that the X-ray emission is boosted by an IC component, like in the case of GRB 000926 (Harrison et al. (2001)). This would require a moderately dense environment, either uniform or stratified. Alternatively, the optical emission may be extincted by a sizable amount of dust in the host galaxy, with . This would correspond, for a Galactic mixture, to a column density cm-2, consistent with the upper limit derived from X-ray spectroscopy. The lack of constraints on the optical spectrum prevents us to reach a definite conclusion. The optical spectrum should be bluer in the case of IC emission and red in the case of dust obscuration.
Assuming that the emission line in the MECS spectra is real and due to fluorescence of H-like iron (rest energy of 6.97 keV), then the change in line position can be explained by a variable iron recombination edge showing its maximum in the second half of ToO 1 (or later, but before ToO 2). In fact if we derive the redshift from the line position in ToO 2, we obtain which leads to a recombination edge of keV. Also the ratio between the iron recombination edge rest energy, 9.28 keV, and 6.97 keV is , like for the ratio of the ToO 1b over ToO 2 line energies. Again, our statistics does not allow us to perform a simultaneous fit for a Gaussian and a recombination edge line. However this hypothesis appears in agreement with the data.
As no direct measurement exists for GRB 020410, we calculated the peak energy in the spectrum and the isotropic energy for a grid of values. We then compared the results with the relation reported by Amati et al. (2002). We find that the relation is satisfied (with a discrepancy level ) for and erg. This range of would exclude the value of 0.5 obtainable by assuming a 1998bw-like SN re-bump (Levan et al. (2004)) and is marginally in agreement with the value derived above. Even assuming that our flux estimate for the missing part of the X-ray light curve must be increased by an extra 20% (which is unlikely), the lower limit for becomes 0.6. Besides this, we note that together with the reported magnitude of for the host galaxy (Levan et al. (2004)) would place it in the very low end of the galaxy luminosity function (), which is unusual for GRB hosts; this independently of considering the X-ray spectrum derived cm-2 as being “local” or “global”.
Acknowledgements.
This research was supported by the Italian Space Agency (ASI) and Consiglio Nazionale delle Ricerche (CNR). BeppoSAX was a major program of ASI with participation of the Netherlands Agency for Aerospace Programs (NIVR). All authors warmly thank the extraordinary teams of the BeppoSAX Scientific Operation Center and Operation Control Center for their enthusiastic support to the GRB program. One of of us (AJCT) is grateful to the MOA project for granting part of the observing time to the GRB follow-up program and thanks P. Kilmartin, A. Gilmore, Ph. Yock and B. Nelson for their assistance. This research made use of observations retrieved from the ESO data archive.References
- Amati et al. (2002) Amati, L., Frontera, F., Tavani, M., et al. 2002, A&A, 390, 81
- Aptekar et al. (1995) Aptekar, R. L., Frederiks, D. D., Golenetskii, S. V., et al. 1995, Space Sci. Rev., 71, 265
- Barraud et al. (2003) Barraud, C., Olive, J-F., Lestrade, J. P., et al. 2003, A&A, 400, 1021
- Björnsson et al. (2002) Björnsson, G., Hjorth, J., Pedersen, K., & Fynbo, J. P. U. 2002, ApJ, 579, L59
- Castro-Tirado et al. (1994) Castro-Tirado, A., Brandt, S., Lund, N., Lapshov, I. Y., Terekhov, O., & Sunyaev, R. A. 1994, in Gamma-ray Burst Workshop, ed. G. J. Fishman, J. J., Brainerd & K. Hurley, AIP 307, 17
- Castro-Tirado et al. (2001) Castro-Tirado, A., Sokolov, V. V., Gorosabel, J., et al. 2001, A&A 370, 398
- Castro-Tirado et al. (2002) Castro-Tirado, A., Gorosabel, J., Castro Ceron, J. M., Nelson, B., & Tristram, P. 2002, GCN Circ., No. 1355
- Costa (1999) Costa, E. 1999, A&AS, 138, 425
- Crew et al. (2003) Crew, G. B., Lamb, D. Q., Ricker, G. R., et al. 2003, ApJ, 599, 387
- De Pasquale et al. (2002) De Pasquale, M., Piro, L., Perna, R., et al. 2002, ApJ, 592, 1018
- Dermer (1999) Dermer, C. D., Chang, J. & Bottcher, M. 1999, ApJ, 513, 656
- Fenimore et al. (1995) Fenimore, E. E., in ’t Zand, J. J. M., Norris, J. P., Bonnell, J. T., & Nemiroff, R. J. 1995, ApJ, 448, L101
- Feroci et al. (2001) Feroci, M., Antonelli, L. A., Soffitta, P., et al. 2001, A&A, 378, 441
- Frail et al. (2002) Frail, D., Wieringa, M. H., Berger, E., & Wark, R. 2002, GCN Circ., No. 1380
- Frontera et al. (2000) Frontera, F., Amati, L., Costa, E., et al. 2000, ApJS, 127, 59
- Fruchter et al. (2002) Fruchter, A., et al. 2002, GCN Circ., No. 1453
- Fynbo et al. (2004) Fynbo, J. P. U., Sollerman, J., Hjorth, J., et al. 2004, ApJ, accepted (astro-ph/0402240)
- Gandolfi (2002) Gandolfi, G. 2002, GCN Circ., No. 1349
- Granot et al. (2002) Granot, J., Panaitescu, A., Kumar, P., & Woosley, S. E., et al. 1999, ApJ, 570, L61
- Guidorzi et al. (2003) Guidorzi, C., Frontera, F., Montanari, E., et al. 2003, A&A, 401, 491
- Heise et al. (2001) Heise, J., in ’t Zand, J. J. M., Kippen, M., Woods, P. 2001, in ESO Proc. Ser., Gamma-Ray Bursts in the Afterglow Era, ed. E. Costa, F. Frontera & J. Hjorth, Berlin Heidelberg: Springer, p. 16
- Huang et al. (2002) Huang, Y. F., Dai, Z. G., & Lu, T. 2002, MNRAS, 332, 735
- Jager et al. (1997) Jager, R., Mels, W. A., Brinkman, A. C., et al. 1997, A&AS, 125, 557
- Harrison et al. (2001) Harrison, F. A., Yost, S. A., Sari, R., et al. 2001, ApJ, 559, 123
- Kilmartin et al. (2002) Kilmartin, P., & Gilmore, A. 2002, GCN Circ., No. 1350
- Lazzati, Covino & Ghisellini (2002) Lazzati, D., Covino, S., & Ghisellini, G. 2002, MNRAS, 330, 583
- Levan et al. (2004) Levan, A., Nugent, P., Fruchter, A., et al. 2004, ApJ, submitted, astro-ph/0403450
- Mészáros & Rees (2001) Mészáros, P., & Rees, M. J. 2001, ApJ, 556, L37
- Mochkovitch et al. (2003) Mochkovitch, R., Daigne, F., Barraud, C., & Atteia 2003, to be published in Proc. “GRBs in the afterglow era: 3rd Rome workshop (2002)”, eds. L. Piro, F. Frontera, N. Masetti, M Feroci, astro-ph/0303289
- Nicastro et al. (2002) Nicastro, L., Piro, L., Gandolfi, G., Feroci, M., Capalbi, M., Perri, M., Heise, J., & in’t Zand, J. J. M. 2002, GCN Circ., No. 1374
- Paciesas et al. (1999) Paciesas, W. S., Meegan, C. A., Pendleton, G. N., et al. 1999, ApJS, 122, 465
- Panaitescu, Mészáros & Rees (1998) Panaitescu, A., Mészáros, P., & Rees, M. J. 1998, ApJ, 503, 314
- Perri & Capalbi (2002) Perri, M., & Capalbi, M. 2002, A&A, 396, 753
- Pian et al. (2001) Pian, E., Soffitta, P., Alessi, A., et al. 2001, A&A, 372, 456
- Piro et al. (1998) Piro, L., Amati, L., Antonelli, A., et al. 1998, A&A, 331, L41
- Preece et al. (2002) Preece, R. D., Briggs, M. S., Mallozzi, R. S., Pendleton, G. N., Paciesas, W. S., & Band, D. L. 2000, PpJS, 126, 19
- Prochaska et al. (2003) Prochaska, J., Bloom, J. S., Chen, H. W., Hurley, K., Dressler, A., & Osip, D. 2003, GCN Circ. 2482
- Ramirez-Ruiz, Celotti & Rees (2002) Ramirez-Ruiz, E., Celotti, A., Rees, M. J. 2002, MNRAS, 337, 1349
- Sari & Piran (1999) Sari, R. & Piran, T., 1999, ApJ, 520, 641
- imon et al. (2001) imon, V., Hudec, R., Pizzichini, G., & Masetti, N. 2001, A&A, 377, 450
- Soderberg et al. (2003) Soderberg, A. M., Kulkarni, S. R., Berger, E., et al. 2003, ApJ, submitted (astro-ph/0311050)
- Yamazaki et al. (2002) Yamazaki, R., Yoka, K. S., & Nakamura, T. 2002, ApJ, 571, L31
- Watson et al. (2004) Watson, D., Hjorth, J., Levan, A., et al. 2004, ApJ, accepted, astro-ph/0401225
- Woosley (1993) Woosley, S. E. 1993, ApJ 405, 273
- in ’t Zand et al. (2001) in ’t Zand, J. J. M., Kuiper, L., Amati, L., et al. 2001, ApJ, 559, 710
- in ’t Zand et al. (2003) in ’t Zand, J. J. M., Heise, J., Kippen, R. M., et al. 2003, to be published in Proc. “GRBs in the afterglow era: 3rd Rome workshop (2002)”, eds. L. Piro, F. Frontera, N. Masetti, M Feroci, astro-ph/0305361