Near-Infrared Properties of I-Drop Galaxies in the Hubble Ultra Deep Field
Abstract
We analyse near-infrared HST/NICMOS and band photometry of a sample of 27 -drop candidate galaxies in the central region of the HST/ACS Ultra Deep Field (HUDF). The infrared colours of the 20 objects not affected by near neighbours are consistent with a high redshift interpretation. This suggests that the low redshift contamination of this -drop sample is smaller than that observed at brighter magnitudes where values of 10-40% have been reported. The colours are consistent with a slope flat in (), as would be expected for an unreddened starburst. There is, however, evidence for a marginally bluer spectral slope () which is perhaps indicative of an extremely young starburst ( Myr old) or a top heavy initial mass function and little dust. The low levels of contamination, median photometric redshift of and blue spectral slope, inferred using the near-infrared data, supports the validity of the assumptions in our earlier work in estimating the star formation rates and, that the majority of the i-drop candidates galaxies lie at .
keywords:
galaxies: high-redshift – galaxies: starburst – galaxies: evolution – galaxies: formation1 Introduction
In recent years the observational horizon has expanded rapidly and radically for those observing distant galaxies. Large format red-sensitive detectors on wide field imaging instruments, the new generation of 8m class telescopes and the refurbished Hubble Space Telescope (HST), have pushed the limits to which we can routinely detect star-forming distant galaxies progressively from redshifts of one to beyond . At the highest redshifts currently accessible, narrow band emission lines searches using the Lyman- line have moved on from redshifts of 4 (Hu & McMahon, 1996; Fujita et al., 2003), to 5.7 (Hu, McMahon & Cowie, 1999) and now reach to (Kodaira et al., 2003; Hu et al., 2002). Photometric redshifts (e.g. Lanzetta, Yahil & Fernandez-Soto, 1996; Connolly et al., 1997; Fernández-Soto, Lanzetta & Yahil, 1999) are now routinely used to process large datasets and identify high redshift candidates. An application of this method, the continuum based Lyman-break photometric technique pioneered at by (Guhathakurta, Tyson & Majewski, 1990; Steidel, Pettini & Hamilton, 1995), has been extended progressively to z and (e.g. , 1999; Bremer et al., 2004), spectroscopically confirmed, and using -band drop selection further extended to (Stanway, Bunker & McMahon, 2003; Stanway et al., 2004a, b; Bouwens et al., 2003a, b, 2004; Dickinson et al., 2004; , 2003).
The ‘classical’ Lyman break technique used by Steidel et al. (1996) uses three filters, one redward of rest frame Lyman- (Å), a second in the spectral region between rest-frame Lyman- and the rest-frame Lyman limit (912Å) and a third at Å. At z3 the technique relies on the ubiquitous step in the spectra of the stellar component of galaxies at 912Å due to photospheric absorption, supplemented by optically-thick Lyman limit system absorption caused by neutral hydrogen in the galaxy in question or in the intervening IGM. At higher redshifts the evolution in the Lyman- forest absorption, particularly in the spectral region 912-1216Å means that the effective break migrates redward to the Lyman- region. Recently this search technique has been extended to by various authors and -drop samples have been used to constrain the star formation history of the universe (as derived from rest-frame UV luminous, starbursting stellar populations, e.g. Stanway, Bunker & McMahon 2003; Giavalisco et al. 2004; Bouwens et al. 2004; Bunker et al. 2004).
Any such estimation, however, is dependent on the characteristic properties of the -drop population. Although Steidel and coworkers (, 1999, 2001) have successfully shown that a Lyman-break technique cleanly selects galaxies at intermediate redshift (), the -drop varient of the technique lacks a second colour to constrain the redshift distribution and is subject to contamination from both low redshift elliptical galaxies and cool dwarf stars. Until recently, these factors have been essentially unconstrained by observational data.
The HST/ACS Ultra Deep Field (HUDF, Beckwith, Somerville and Stiavelli 2004), imaging an 11 arcmin2 region of the sky to faint magnitudes in the , , and bands, has now allowed a clean sample of -drop objects to be defined and constraints to be placed upon its luminosity function (Bunker et al., 2004). The HST/NICMOS treasury programme, complimentary to the HUDF, has imaged the central region of the ACS field to faint magnitudes at wavelengths of 1.1 and 1.6 microns, allowing the infrared properties of the -drop population (in particular their rest-frame ultra-violet spectral slope, faint-end contamination and luminosity at 1500Å) to be determined. In this paper we discuss the infrared properties of the -drop population defined in Bunker et al. (2004), and their implications for the nature of these objects.
We adopt a -dominated, ‘concordance’ cosmology with , and . All magnitudes in this paper are quoted in the AB system (Oke & Gunn, 1983) and the Madau (1995) prescription, extended to , is used where necessary to estimate absorption due to the intergalactic medium. Beyond absorption is assumed to decrease the transmitted flux by 98% (the decrement observed in the flux of quasars identified by the Sloan Digital Sky Survey, Fan et al., 2003) .
2 HST Observations and Catalog Construction
2.1 HST/NICMOS Observations
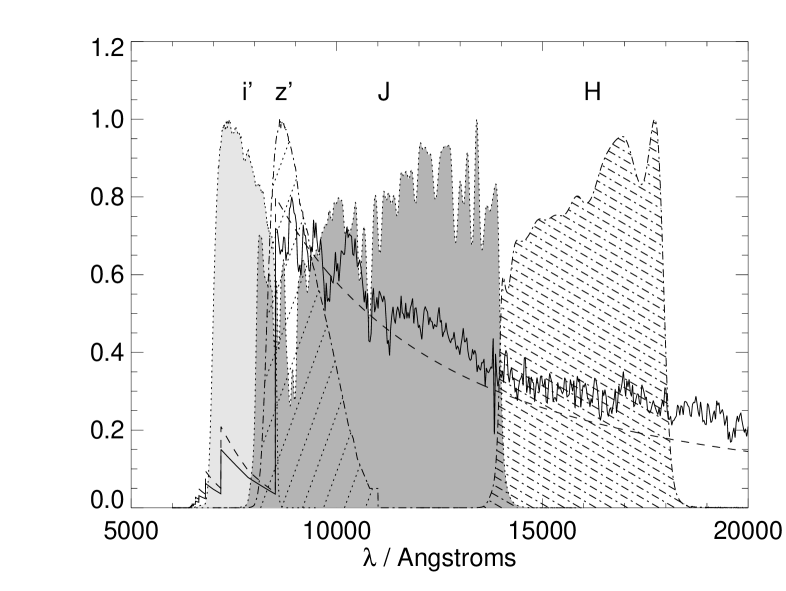
In this paper we utilise the publically released, pipeline-reduced images from the NICMOS UDF treasury programme111Programme GO-9803; PI Thompson; 144 orbit allocation; Available from http://www.stsci.edu/hst/udf. These were taken with the NICMOS 3 camera on HST, in the and filters, with exposures of 8 orbits per band per pointing giving an average exposure time of 21500 seconds per pixel in each image. The transmission profiles of these filters are illustrated in figure 1 and differ from those of standard ground-based and filters, tuned to atmospheric transmission windows. In particular the filter is wide, extending down to 8000Å.
NICMOS 3 uses a pixel detector with a scale of 020 per pixel, giving a field of view of . The images discussed in this paper have been distortion corrected and drizzled onto a grid of 009 per pixel. The available NICMOS fields cover arcmin giving a total area of 5.2 arcmin2 (45% of that of the HST/ACS HUDF) to a depth of and in a 2″ diameter aperture. They comprise mosaics of individual NICMOS pointings and the edge regions (with low exposure times) have been trimmed. Further details on the use for NICMOS for deep surveys can be found in Thompson et al. (1999) which describes the results of 49 orbit and band observations of a single NICMOS pointing of the HDF-N (Williams et al., 1996).
The near-IR ( and band) magnitudes of objects in these images are calculated using the photometric calibration provided by the NICMOS UDF team, with photometric zeropoints given by and 222Note that the photometric calibration of the NICMOS instrument appears to have changed significantly from that reported in earlier work (zeropoints of = 22.7 and =22.8), probably due to the installation of a new cryostat. The older zeropoints have remained in use in the on-the-fly calibration software of the MAST archive. AB magnitudes may be converted to approximate Vega magnitudes using the prescription: , (Koornneef, 1983). The point spread function of unresolved objects (measured on the images) were 04 FWHM (4 drizzled pixels) in the -band and 045 FWHM (5 drizzled pixels) in .
2.2 Catalog Construction
Catalog construction from the imaging data was performed utilising v2.3.2 of the SExtractor photometry software package (Bertin & Arnouts, 1996). For object identification, we demanded at least 5 adjacent pixels above a flux threshold of per pixel. Catalogs were trained in the band and Sextractor was then used in two-image mode to evaluate the equivalent magnitude of each object in the band.
Objects in the resulting catalog were then matched to those in a second catalog of sources detected in the ACS HUDF image, with a match between two objects being assigned if the astrometry agreed to better than 027 (3 pixels on the drizzled band image, one undrizzled NICMOS pixel). The agreement between astrometric systems was generally better than 01 although the discrepancy increases with distance from the field centre.
Given the depth of the HUDF images, the narrower point spread function and smaller pixel scale ACS (PSF and plate scale are both 005 for ACS compared to a plate scale of 02 and a PSF of 04 for NICMOS) can lead to difficulties with this process, since objects identified as single sources on the and band images may be resolveable into several distinct galaxies, or components of a single galaxy, on the optical imaging of the HUDF. As a result the flux corresponding to a single -selected ‘source’ may be underestimated.
The SExtractor software performs source deblending based on a multi-thresholding algorithm as described in detail in Bertin & Arnouts (1996). This process involves rethresholding the flux of each set of connected pixels above the detection threshold into 30 levels spaced between that threshold and the peak flux. At each level, the source may be divided into two components if the flux in each component exceeds a given threshold. As tests in Bertin & Arnouts (1996) indicate, such an approach may fail if there is no saddlepoint in the flux profile of the blended system (i.e. for objects seperated by less than two times the instrumental point spread function, or approximately 0.8″ in this case). To verify this, we performed simulations in which a compact artificial galaxy of was inserted at varying distances from real objects with in the NICMOS UDF images. As expected, source magnitudes were successfully recovered for equal magnitude objects seperated by 08, and for galaxies seperated by 12 even with a two magnitude difference between real and artificial galaxies. On the other hand, the software could not deblend objects closer than these seperations. Hence the photometry of -drops with brighter neighbours within 1″ (indicated with an asterisk in table 1) is not used in the analysis in sections 4 & 5.
We use deblended “total” magnitudes, rather than fixed aperture magnitudes in the and bands. SExtractor calculates the “total magnitude” by computing an elliptical aperture whose ellipticity and elongation are defined by the second order moments of the object’s isophotal light distribution. The flux is measured in an elliptical aperture with 2.5 times the elongation calculated above. Hence the measured flux is independent of an assumed radial light profile.
The use of different photometric apertures in different observation bands may lead to low surface brightness flux being missed in one or more bands. We attempted to quantify this by comparing the - colours obtained using “total” magnitudes with those obtained using fixed circular apertures, and corrected for missing flux assuming a compact radial light profile as appropriate in the band. We found that the resulting colours agree to within approximately 0.2 magnitudes. Given the consistent colours obtained, we decided to adopt the “total” magnitudes rather than assuming a radial light profile for this source population. However, we note that without knowledge of the accurate radial light profile some uncertainty remains in the fraction of flux emitted below the detection threshold in each band.
3 Near-IR Properties of Candidate Objects
3.1 Near-IR properties of bright I-drops in the HUDF
In a previous paper (Bunker et al., 2004), we reported a catalogue of 54 galaxy candidates, including one confirmed galaxy (Bunker #20104, SBM03#1, SiD002, GLARE 1042 in Bunker et al. 2004, Stanway et al. 2004a, Dickinson et al. 2004 and Stanway et al. 2004b). Each -drop object in this selection satisfied and in the HST/ACS images of the HUDF field. Of this catalog, 27 objects lie in region surveyed by the NICMOS UDF (consistent with the 45% of the ACS HUDF area covered by this near-IR imaging.)
The near-IR photometry of these high redshift candidates is presented in table 1 with limits on the magnitudes indicated where appropriate. The photometry of seven of the objects is likely to be affected by bright near neighbour objects at lower redshift.
Interestingly several multicomponent systems of galaxies are observed, perhaps implying that we are observing merger-triggered star formation. As illustrated by figure 5 three -drop galaxies, 24228, 23972 and 24123, form a close system (spanning ) and hence have not been resolved as individual objects in the near-IR (where each pair separated by just 3 undrizzled pixels). As a result, the average colour of this galaxy group, Group 1, has been calculated by summing the optical fluxes of the three components. We note that the majority of near-IR emission is to the north of the group centre, suggesting that object 23972 may be fainter than its neighbours in the near-IR bands.
Similarly, the galaxy pairs 44154 & 44194 (Group 2) and 42929 & 42806 (Group 3) are each treated as a single system, their optical flux summed and compared to the blended near-IR flux of each system. Hence the reported flux for each of these groups of -drop galaxies is a system total rather than that of any particular galaxy.
| ID | RA & Dec (J2000) | |||||||
|---|---|---|---|---|---|---|---|---|
| Group 11 | 03 32 34.29 -27 47 52.8 | 28.06 0.15 | 26.41 0.05 | 26.23 0.10 | 26.09 0.11 | 0.18 0.11 | 0.14 0.15 | 5.93 |
| Group 22 | 03 32 36.46 -27 46 41.5 | 28.72 0.22 | 26.36 0.05 | 26.66 0.11 | 25.82 0.07 | -0.33 0.12 | 0.84 0.13 | 5.75 |
| Group 33 | 03 32 37.46 -27 46 32.8 | 29.74 0.40 | 27.27 0.09 | 26.53 0.13 | 26.29 0.13 | 0.94 0.16 | 0.24 0.18 | 6.65 |
| 20104 | 03 32 40.01 -27 48 15.0 | 26.99 0.04 | 25.35 0.02 | 25.54 0.04 | 25.51 0.05 | -0.19 0.04 | 0.03 0.06 | 5.82 |
| 23516∗ | 03 32 34.55 -27 47 56.0 | 28.57 0.10 | 27.04 0.05 | 26.82 0.13 | 26.85 0.16 | 0.22 0.13 | -0.03 0.21 | 5.73 |
| 25941 | 03 32 33.43 -27 47 44.9 | 29.30 0.18 | 27.32 0.06 | 27.52 0.16 | 27.24 0.15 | -0.20 0.17 | 0.28 0.22 | 5.91 |
| 26091∗ | 03 32 41.57 -27 47 44.2 | 29.74 0.25 | 27.38 0.06 | 26.44 0.12 | 26.33 0.13 | 0.94 0.13 | 0.11 0.18 | 6.67 |
| 24458† | 03 32 38.28 -27 47 51.3 | 29.11 0.15 | 27.51 0.07 | 27.7 | 27.4 | 0.19 | 5.81 | |
| 49117∗ | 03 32 38.96 -27 46 00.5 | 29.77 0.26 | 27.74 0.08 | 26.36 0.10 | 25.35 0.06 | 1.34 0.13 | 1.01 0.12 | 6.82 |
| 27270 | 03 32 35.06 -27 47 40.2 | 30.4 | 27.83 0.08 | 27.32 0.16 | 27.30 0.20 | 0.51 0.18 | 0.02 0.26 | 6.34 |
| 14751† | 03 32 40.92 -27 48 44.8 | 29.39 0.17 | 27.87 0.09 | 27.7 | 27.4 | 0.14 | 5.78 | |
| 35084∗ | 03 32 44.70 -27 47 11.6 | 29.86 0.28 | 27.92 0.09 | 27.7 | 27.4 | 0.22 | 5.93 | |
| 46503† | 03 32 38.55 -27 46 17.5 | 29.43 0.20 | 27.94 0.09 | 27.7 | 27.4 | 0.24 | 5.77 | |
| 19953∗ | 03 32 40.04 -27 48 14.6 | 29.50 0.21 | 27.97 0.09 | 27.7 | 27.4 | 0.27 | 5.78 | |
| 21111† | 03 32 42.60 -27 48 08.9 | 29.69 0.24 | 28.02 0.10 | 27.7 | 27.4 | 0.32 | 5.83 | |
| 46223† | 03 32 39.87 -27 46 19.1 | 30.4 | 28.03 0.10 | 27.7 | 27.4 | 0.33 | 6.08 | |
| 22138† | 03 32 42.80 -27 48 03.3 | 30.4 | 28.03 0.10 | 27.7 | 27.4 | 0.33 | 6.08 | |
| 46234 | 03 32 39.86 -27 46 19.1 | 30.4 | 28.05 0.10 | 27.7 | 27.4 | 0.35 | 6.08 | |
| 12988∗ | 03 32 38.49 -27 48 57.8 | 30.4 | 28.11 0.11 | 27.7 | 27.4 | 0.41 | 6.08 | |
| 24733† | 03 32 36.62 -27 47 50.0 | 30.4 | 28.15 0.11 | 27.7 | 27.4 | 0.45 | 6.08 | |
| 21530† | 03 32 35.08 -27 48 06.8 | 30.24 0.39 | 28.21 0.12 | 27.7 | 27.4 | 0.51 | 5.96 | |
| 35271† | 03 32 38.79 -27 47 10.9 | 29.77 0.26 | 28.44 0.14 | 27.7 | 27.4 | 0.74 | 5.70 | |
| 22832∗ | 03 32 39.40 -27 47 59.4 | 30.4 | 28.50 0.15 | 27.7 | 27.4 | 0.80 | 6.08 | |
| Stack (mean)† | 30.14 0.17 | 28.13 0.05 | 28.56 0.16 | 28.45 0.16 | -0.43 0.17 | 0.11 0.23 | ||
∗ Photometry may be affected by near neighbour objects.
† Object has contributed to the stack of undetected objects, the mean properties of which are given in the last line.
1 2 3 and band fluxes of these groups of objects are blended (see text for details). Photometry is given for the group as a whole. Group 1 comprises objects 24228, 24123 & 23972. Group 2 comprises objects 42929 & 42806. Group 3 comprises objects 44154 & 44194.


3.2 Near-IR properties of fainter I-drops in the HUDF
Fourteen candidate high redshift galaxies identified by Bunker et al. (2004) lie within the NICMOS field yet are undetected to in the and -band images. Of these, nine are isolated, lying more than an arcsecond away from their nearest neighbours. In order to investigate the properties of this fainter sub-catalogue of -drop objects, sections of the NICMOS images, centered on the -band coordinates of the 9 isolated candidate objects, were stacked. The resultant images (shown in figure 4) were then analysed with the SExtractor software as described in section 2.2.
The background noise in the stacked images is a factor of lower than in the original NICMOS images, allowing the average properties of these candidates to be probed to a depth over a magnitude fainter in each band. Their mean photometry is shown in table 1. Clearly, this analysis assumes that the 9 -drop candidates considered are similar in colour and that the mean colour is not heavily skewed by a single source. However, the objects analysed are similar in flux (spanning less than 1 magnitude) and have near-IR limits in the NICMOS images which rule out identification as low redshift elliptical galaxies. The mean colours of these faint galaxies are bluer than those for which secure NICMOS detections are available, suggesting a steep mean rest-frame UV spectral slope (see section 4.3).
4 Discussion
4.1 Faint Contaminants in -Drop Selection
The very red, old stellar populations of elliptical galaxies at around (Extremely Red Objects, or EROs) allow them to contaminate any sample of objects selected using a simple colour criterion (as illustrated by figure 2, see also figure 2 of Stanway, Bunker & McMahon 2003). The degree of sample contamination has long been uncertain, affecting the analysis of population statistics at high redshift.
Utilising the v0.5 release of data from the deep Great Observatories Origins Deep Survey (GOODS), we have previously defined a sample of 20 -drop objects with in the 300 arcmin2 GOODS fields (Stanway, Bunker & McMahon, 2003; Stanway et al., 2004a). Of these 2 (10%) are probable EROs and a further six (30%) cool Galactic stars giving a contamination at the bright end of 40%. Dickinson et al. (2004), working with somewhat deeper GOODS data and to a lower signal-to-noise limit reported a contamination fraction of their -drop sample that increased at fainter magnitudes, reaching as high as 45% for resolved galaxies (c.f. 10% for our bright sample), although they report that their catalogue was affected by a number of spurious sources not expected to be a problem in the HUDF. Bouwens et al. (2004), also using GOODS (v1.0) and with a similar selection, reported a contamination of their -drop sample by lower redshift ellipticals of 11% based on the presence of flux in the or bands (unlikely for galaxies at ).
The availability of NICMOS imaging in the central portion of the HUDF field allows lower redshift galaxies to be cleanly excluded from our sample, as illustrated in figures 3, and 2. Of the 27 -drop objects for which NICMOS infrared data is available, only one (49117) has colours which may be consistent with those of elliptical galaxies.
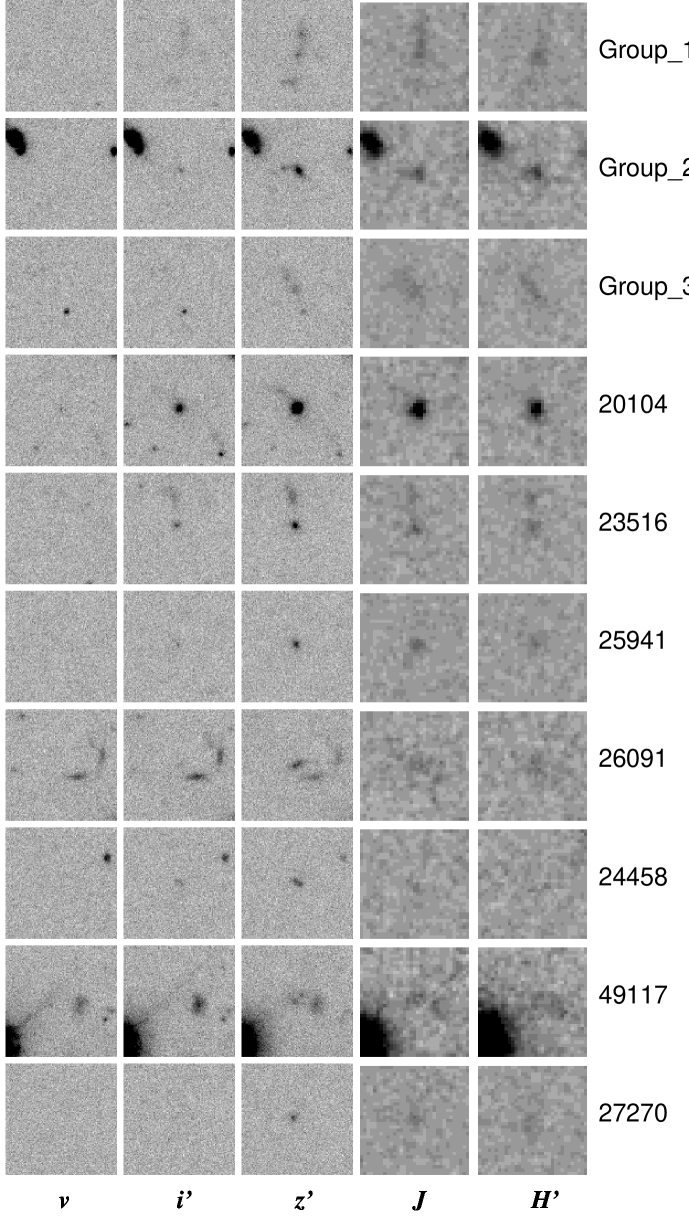
Object 49117 is likely tp be subject to contamination from two neighbouring objects: one star, bright in the band () and separated from the candidate by 23, and a second galaxy of comparable magnitude to the candidate and separated from it by only 06 (, see figure 5), unresolved from it. None of the objects undetected in and have colour limits consistent with lying at low redshift. This allows us to place an upper limit on the low redshift galaxy contamination in this -drop selected catalog of at most 1 objects in 27 (), or more likely no elliptical galaxies in this sample.
All these objects are also resolved in the -band, the only unresolved -drop object reported in this field by Bunker et al. (2004) having been excluded for having significant -band flux. When combined with the near-IR evidence from the NICMOS UDF exposure, this suggests that the contamination of this -drop sample is less than % - significantly lower than has been found by previous -drop studies at brighter magnitudes, suggesting that we may be seeing through the Galactic disk at these faint magnitudes.
4.2 Redshift Discrimination
The -drop method is, in principle, sensitive to any galaxy bright in the rest-frame ultraviolet and lying at redshifts between and (where the Lyman-break shifts out of the filter). However, the sharp fall off in filter transmission beyond 8500Å biases the selection towards the low redshift end and renders unlikely the detection of galaxies beyond .
The availability of extremely deep imaging across a wide wavelength range, allows the photometric redshift method to be used with good results. The publically available software package hyperz (Bolzonella, Miralles & Pelló, 2000) was used to calculate the photometric redshifts of each object in table 1 given their magnitude, or magnitude limit, in the , , , and bands (spanning Å). This package performs fitting of the object flux to a set of predefined template spectra, selecting both the best fitting template and the best fitting redshift simultaneously. Coleman, Wu & Weedman (1980) E, Im, and Sbc templates were used, together with power law spectra of the form with -1.0, -1.5, -2.0, -2.2, -2.5 (where is suggested by the infrared colours of the -drop sample, see section 4.3).
Trial redshifts were varied in the range at intervals of . All sources were found to lie above using this method. To improve redshift discrimination the range was further narrowed to for the remaining objects, with a redshift interval , resulting in the photometric redshifts presented in table 1 and illustrated in figure 6. All objects were best fit by power law spectra with slopes with the exception of objects 49117 (CWW E).
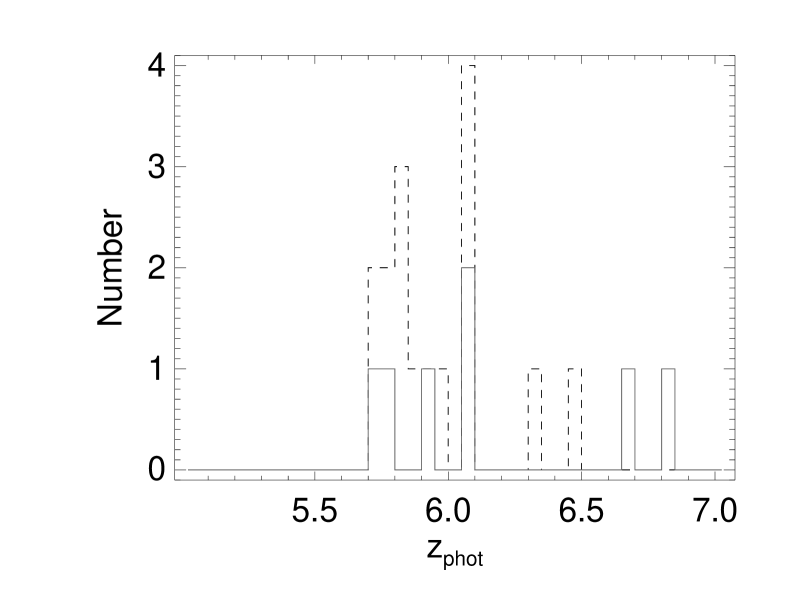
One -drop in this field has a confirmed spectroscopic redshift, object 20104 at (Dickinson et al., 2004; Stanway et al., 2004a, b). Its photometric redshift is consistent with this (). The mean of the total -drop sample is . The mean of the -drop sample using only the objects(16) that have photometry unaffected by blending is and for those that may be effected by blending with companion objects(7). Hence a central assumed redshift of 6.0 (Bunker et al., 2004) is in good agreement with the data.
4.3 Effect of Spectral Slope and Line Contamination
Interestingly, those objects for which measured colours are available indicate an average spectral slope steeper than , as do the mean colours of fainter objects detected in the stacked image. The evidence for this trend is clear in figure 3 as the colour has a longer baseline than and hence is more sensitive to spectral slope. Although the error on each colour is large, the colours of most of those objects for which photometry is available lie between the redshift tracks predicted for objects with spectral slopes of and .
Strong line emission in the -band might explain these observed colours. Narrow-band selected Lyman- emitters at are known to have strong emission lines, with typical rest-frame equivalent widths (EWs) of 50-150Å (Ajiki et al., 2003; Hu et al., 2004) and in some cases much higher (Å e.g. Malhotra & Rhoads 2002, Rhoads et al. 2003). In the observed frame at , these correspond to equivalent widths of 1000Å. The -band filter on NICMOS is broad with a FWHM of 5880Å. Hence a line emitter with an observed equivalent width of 1000Å could contribute up to 17% of the flux in this band or 0.2 mag. This, in fact, underestimates the potential contribution of line flux to the -band magnitude since line blanketing below the Lyman break will suppress the -band flux for objects at redshifts greater than 5.6.
The observed colours are thus consistent with a redder intrinsic rest-frame UV spectral slope (due to stellar continuum emission) of , if every object has a powerful emission line. The single -drop object in this field with a spectroscopically confirmed emission line, however, has a much lower rest-EW (Å, contributing 5% of the flux, Stanway et al. 2004a, Dickinson et al. 2004), as do several other -drop objects which have now been confirmed spectroscopically (Bunker et al., 2003; Stanway et al., 2004b).
An alternative explanation for the observed near-IR colours of this sample may be evolution in the intrinsic spectral slope of starbursts from that observed at lower redshifts. The observed rest-frame UV spectral slope in star forming galaxies is influenced by two factors: the intrinsic spectral energy distribution of the stellar population (shaped by the initial mass function (IMF), and star formation history) and the reddening due to dust extinction. The Lyman break population at has a typical observed spectral slope of (Adelberger & Steidel, 2000), as expected for dust-reddened starburst galaxies with an intrinsic spectral slope of . Leitherer et al. (1999), using their Starburst99 stellar synthesis code, find that starbursts less than 200 Myr in age are well approximated by the power law () model. They predict an intrinsic spectral slope at 1500Å of for young (1-10 Myr), low metallicity starbursts (Leitherer et al. 1999, figures 71 & 72), independent of evolution and initial mass function (IMF) effects (where IMFs considered include the classical (1955) IMF, a Salpeter IMF truncated at 30M⊙ and a steeper IMF with an enhanced proportion of low mass stars). In these young systems, hot OB type stars dominate the rest frame ultraviolet continuum. The predicted falls to -2.0 on an IMF dependent timescale of the order of Myr and falls more slowly with increasing metallicity.
These models do not account for the contribution to the UV spectral slope due to dust reddening. The typical colour excess from the stellar continuum of Lyman break galaxies at (, 1999) is ES()=0.16. Calzetti et al. (2000), studying a large sample of local starburst galaxies, found a relation between colour excess, E() and observed spectral slope, , of where is the intrinsic spectral slope, although the scatter on this relation is considerable (approx 0.5 mag). If the dust properties of the very young starbursts at are similar to those of Lyman break galaxies at lower redshift, this would imply an intrinsic spectral slope of -2.9 for objects with (typical for our sample, see sections 4.2 and 4.3), outside the range of slopes predicted from starburst models. This suggests that, if the colours – and photometric redshifts – are good indicators of spectral slope, this -drop sample is less affected by dust reddening than Lyman break galaxies at lower redshift.
Given the fraction of -drops that are observed to be in close pairs which may be interacting systems, these near-IR observations suggest that we may be observing young starbursts triggered by an epoch of merger activity.
5 Implications for Star Formation History
The linear relation between star formation rate (SFR) and UV luminosity density at Å (, 1998) has been widely used to study the volume-averaged star formation history of the universe (e.g. Madau et al. 1996, Steidel et al. 1999). The broad-band photometry of a source may be used to determine its luminosity density, if the redshift and appropriate -correction (from the effective wavelength of the filter to 1500Å) is known. Clearly the -correction for UV luminous galaxies depend on their spectral slope, .
Galaxies selected by the -drop technique present several difficulties in this regard. Firstly, with no strong constraint from bands at longer wavelength than (=9200Å, Å at ), the spectral slope of these objects has been unknown and a value of has been assumed (e.g. Stanway, Bunker & McMahon 2003) or a lower redshift Lyman-break galaxy has been adopted as a template (e.g. Giavalisco et al. 2004). Furthermore, since the redshift distribution of objects is much broader than that of galaxies selected using the more traditional two-colour Lyman-break approach, luminosity densities have been calculated by placing the candidate objects at some model-dependent redshift, representative of the sample as a whole. For -drop samples this representative redshift has varied between (Bunker et al., 2004) and (Giavalisco et al., 2004) depending on details of models and the selection criteria.
Clearly, if the majority of objects lie at redshifts much higher or much lower than has been estimated, the star formation density calculated in earlier works will be unreliable. While the near-IR data now available for -drop candidates in the NICMOS UDF do not place a tight constraint on the redshift of individual objects, their properties (discussed in sections 4.2 and 4.3) are reassuringly consistent with those predicted in simulations for the redshift range (Stanway et al., 2004b; Giavalisco et al., 2004; Bouwens et al., 2004), with a median colour consistent with lying at as expected. However, as discussed in section 4.3, there is some evidence for a slightly steeper spectral slope than the assumed value of . A slope of would imply that the -corrections hitherto applied to the data have led to a slight overestimation of the star-formation density.
Figure 7 compares the mean SFRs derived from the and band filters, centered at Å and Å at respectively, for the subsample of objects isolated from lower redshift sources and for which a secure band detection was made. The luminosity-SFR relation of (1998) (which uses a (1955) initial mass function) is used ( (SFR/M⊙ yr-1) ergs s-1 Hz-1). Objects were assumed to lie at the mean redshift of (see Bunker et al., 2004). The total flux of these seven objects in each waveband was summed before conversion to star formation rates using the spectral slope specified. If the value of used to calculate the -correction accurately represents the population mean slope, then the star formation rates derived from any two bands should converge.
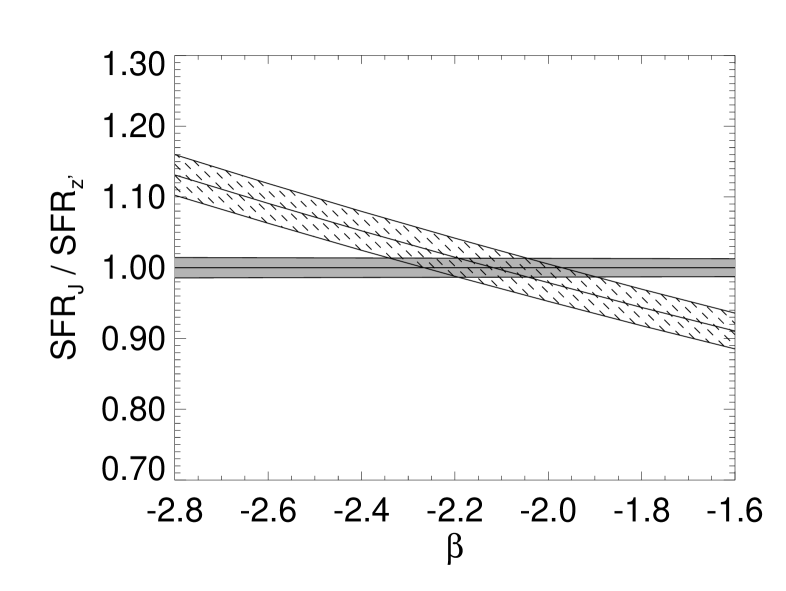
The photometric errors at these faint magnitudes, and the consequent uncertainties in the SFRs, are large. Nonetheless, the slope which gives the best agreement between and -band derived star formation rates in the -drop sample () does suggest a slightly steeper slope than , as expected given the colour distribution. In practise, varying the spectral slope between and changes the calculated star formation rate by only %. The derived value of is also consistent with a slope flat in () used in earlier computations of star formation rates (e.g. Bunker et al. 2004).
The infrared properties of this -drop sample do suggest further caveats to be applied when calculating the star formation density at . If, -band drops are indeed young starbursts, then the (1998) luminosity-star formation rate relation may be underestimating the star formation density. Stellar populations 10 Myr old yield SFRs more than 50% higher than given by the (1998) calibration when modelled using stellar synthesis techniques (Leitherer & Heckman, 1995; Kennicutt, 1998; Leitherer et al., 1999).
On the other hand, a top-heavy IMF rich in massive stars has been hypothesised at very high redshifts (e.g. , Clarke & Bromm 2003) and such an IMF could explain the steep UV spectral slope observed. If so, this would also alter the luminosity-SFR calibration which extrapolates the formation of high mass stars to the low mass regime. A top heavy IMF would reduce the star formation rate inferred from a given 1500Å luminosity.
6 Conclusions
-
1.
The near-infrared properties of a faint sample of -drop objects (defined by Bunker et al. 2004) has been investigated, using the deep and images of the HST/ACS Ultra Deep Field.
-
2.
The infrared colours of all objects not suffering from contamination by near neighbours are consistent with a high redshift interpretation. This suggests that the contamination of this -drop sample is smaller than that observed at brighter magnitudes.
-
3.
The spectral slopes inferred from near infrared colours are consistent with although there is evidence for a marginally steeper spectral slope of .
-
4.
These steep spectral slopes suggest that the dust extinction of the sample is small and that the -drop population may comprise galaxies with young starbursts - possibly triggered by mergers (several close systems of galaxies are observed in this sample).
-
5.
The low levels of contamination, and the steep spectral slope, inferred from near-infrared data supports the validity of our previous star formation density estimates based on -drop samples.
Acknowledgements
Based on observations made with the NASA/ESA Hubble Space Telescope, obtained from the Data Archive at the Space Telescope Science Institute, which is operated by the Association of Universities for Research in Astronomy, Inc., under NASA contract NAS 5-26555. These observations are associated with programs #9803 and #9978. We thank Paul Hewett, Richard Ellis and Malcolm Bremer for useful discussions. ERS acknowledges a Particle Physics and Astronomy Research Council (PPARC) studentship supporting this study. We also thank Steve Beckwith and the HUDF team for making these high quality images publically available.
References
- Adelberger & Steidel (2000) Adelberger, K. L., Steidel, C. C., 2000, ApJ, 544, 218
- Ajiki et al. (2003) Ajiki et al., 2003, AJ, 126, 2091
- (3) Beckwith, S., Somerville, R., Stiavelli, M. 2003, STScI Newsletter vol 20 issue 04
- Bertin & Arnouts (1996) Bertin E., Arnouts S., 1996, A&AS, 117, 393
- Bolzonella, Miralles & Pelló (2000) Bolzonella, M., Miralles, J. M., Pelló, R., 2000, A&A, 363, 476
- Bouwens et al. (2003a) Bouwens R. et al., 2003a, ApJ, 593, 640
- Bouwens et al. (2003b) Bouwens R. et al., 2003b, ApJ, 595, 589
- Bouwens et al. (2004) Bouwens R. et al., 2004, preprint (astro-ph/0403167)
- Bremer et al. (2004) Bremer, M. N., Lehnert, M. D., Waddington, I., Hardcastle, M. J., Boyce, P. J., Phillipps, S., 2004, MNRAS, 347, L7
- Bunker et al. (2003) Bunker, A. J., Stanway, E. R., Ellis, R. S., McMahon, R. G., McCarthy, P. J., 2003, MNRAS, 342, L47
- Bunker et al. (2004) Bunker, A. J., Stanway, E. R., Ellis, R. S., McMahon, R. G., 2004, preprint (astro-ph/0403223)
- Clarke & Bromm (2003) Clarke, C. J., Bromm, V., 2003, MNRAS, 343, 1224
- Calzetti et al. (2000) Calzetti, D., Armus, L., Bohlin, R. C., Kinney, A. L., Koornneef, J., Storchi-Bergmann, T., 2000, ApJ, 533, 682
- Coleman, Wu & Weedman (1980) Coleman G. D., Wu C.-C., Weedman D. W., 1980, ApJS, 43, 393
- Connolly et al. (1997) Connolly A. J., Szalay A. S., Dickinson M., Subbarao M. U., Brunner R. J., 1997, ApJ, 286, L11
- Dickinson et al. (2004) Dickinson M. et al., 2004, ApJ, 600, L99
- Fan et al. (2003) Fan X. et al., 2003, AJ, 125, 1649
- Fernández-Soto, Lanzetta & Yahil (1999) Fernández-Soto A., Lanzetta K. M., Yahil A., 1999, ApJ, 513, 34
- Fujita et al. (2003) Fujita et al., 2003, AJ, 125,13
- Giavalisco et al. (2004) Giavalisco M. et al., 2004, ApJ, 600, L103
- Guhathakurta, Tyson & Majewski (1990) Guhathakurta, P., Tyson, J. A., Majewski, S. R.,, 1990, ApJL, 357, 9
- Hu & McMahon (1996) Hu, E. M., McMahon, R. G., 1996, Nature, 382, 281
- Hu, McMahon & Cowie (1999) Hu E. M., McMahon R. G., Cowie L. L., 1999, ApJ, 522, L9
- Hu et al. (2002) Hu, E.M. et al., 2002, ApJL, 568, 75
- Hu et al. (2004) Hu, E. M., Cowie, L. L., Capak, P., McMahon, R. G., Hayashino, T., Komiyama, Y., 2004, AJ, 127,563
- Kennicutt (1998) Kennicutt, R. C., 1998, ARA&A, 36, 189
- Kinney et al. (1996) Kinney, A. L., Calzetti, D., Bohlin, R. C., McQuade, K., Storchi-Bergmann, T., Schmitt, H. R., 1996, ApJ, 467, 38
- Kodaira et al. (2003) Kodaira, K. et al., 2003, PASJ, 55, L17
- Koornneef (1983) Koornneef J., 1983, A& A, 128, 84
- Lanzetta et al. (2002) Lanzetta K. M., Yahata N., Pascarelle S., Chen H., Fernández-Soto A., 2002, ApJ, 570, 492
- Lanzetta, Yahil & Fernandez-Soto (1996) Lanzetta K. M., Yahil A., Fernandez-Soto A., 1996, Nature, 381,759
- Leitherer et al. (1999) Leitherer et al., 1999, ApJS, 123, 3
- Leitherer & Heckman (1995) Leitherer, C., Heckman, T. M., 1995, ApJS, 96, 9
- (34) Madau P., Pozzetti L., Dickinson M., 1998, ApJ, 498, 106
- Madau et al. (1996) Madau P., Ferguson H. C., Dickinson M. E., Giavalisco M., Steidel C. C., Fruchter A., 1996, MNRAS, 283, 1388
- Madau (1995) Madau P., 1995, ApJ, 441, 18
- Oke & Gunn (1983) Oke J. B., Gunn J. E., 1983, ApJ, 266, 713
- (38) Salpeter E. E., 1955, ApJ, 121, 161
- Schlegel, Finkbeiner & Davis (1998) Schlegel D. J., Finkbeiner D. P., Davis M., 1998, ApJ, 500, 525
- Stanway, Bunker & McMahon (2003) Stanway E. R., Bunker A. J., McMahon R. G., 2003, MNRAS, 342, 439
- Stanway et al. (2004a) Stanway E. R. et al., 2004a, ApJ, 604, L13
- Stanway et al. (2004b) Stanway E. R., Bunker, A. J., McMahon, R. G., Ellis, R. S., Treu, T., McCarthy, P. J., 2004b, ApJ, 607, 704
- Steidel, Pettini & Hamilton (1995) Steidel C. C. Pettini M., Hamilton D., 1995, AJ, 110, 2519
- (44) Steidel C. C., Adelberger K. L., Giavalisco M., Dickinson M. E., Pettini M., 1999, ApJ, 519, 1
- (45) Steidel C. C., Pettini M., Adelberger K. L., 2001, ApJ, 546, 665
- Thompson et al. (1999) Thompson R. I., Storrie-Lombardi, L. J., Weymann, R. J., Rieke, M. J., Schneider, G., Stobie, E., Lytle, D., 1999, AJ, 117, 17.
- Williams et al. (1996) Williams et al., 1996, AJ, 112, 1335
- (48) Yan H. Windhorst R. A., Cohen S., 2003, ApJ, 585, L93