Variation in Emission and Absorption Lines and Continuum Flux by Orbital Phase in Vela X-1
Abstract
High resolution spectral studies were undertaken at orbital phases () 0, 0.25 and 0.5 on the high-mass X-ray binary (HMXB) Vela X-1 using archival Chandra data. We present (a) the first detailed analysis of the multiple strong narrow emission lines present in 0.5 (b) an analysis of the absorption of the continuum in 0.5, and (c) the first detection of narrow emission and absorption lines in 0.25. Multiple fluorescent and H-and He-like emission lines in the band 1.6 - 20 Angstrom (Å) in eclipse are partially obscured at 0.25 by the X-ray continuum. The 0.25 spectrum displays 3 triplets, 2 with a blue-shifted resonance (r) line in absorption and the intercombination (i) and forbidden (f) lines in emission, and shows in absorption other blue-shifted lines seen in emission in eclipse. At 0.5 the soft X-ray continuum diminishes revealing an ”eclipse-like” spectrum, however line flux values are around 13-fold those in eclipse. We conclude the narrow emission lines in Vela X-1 become apparent when the continuum is blocked from line of sight, either by eclipse or by scattering and/or absorption from a wake or cloud. The H-and He-like lines arise in warm photoionised regions in the stellar wind, while the fluorescent lines (including a Ni K line) are produced in cooler clumps of gas outside these regions. Absorption of the 5-13 Å continuum at 0.5 may be caused by an accretion wake comprised of dense stagnant photoionized plasma inside a Stromgren zone. Multiple fluorescent emission lines may be a common feature of the supergiant category of HMXBs.
1 Introduction
High-mass X-ray binaries (HMXBs) including Vela X-1 have served to illuminate the evolution of giant binary stars, to probe their radiation-driven winds, and to study accretion processes and the fundamental parameters of compact objects. The 130 known HMXBs fall into 2 categories, Be/X-ray and supergiant systems (Liu et al., 2000). Vela X-1 is one of 11 supergiant systems (which include GX 301-2 and 4U 1700-37), while the vast majority (around 80%) of HMXBs are Be/X-ray systems detected as transients (Kaper, 2001; White, Nagase & Palmar, 1995). Supergiant systems have a relatively short life of 10,000 years before the secondary star explodes in a supernova leaving a neutron star binary or 2 single neutron stars (Kaper, 2001). Once a massive main-sequence star evolves to a supergiant the Roche lobe may become filled and accretion flow becomes sufficient to power a strong X-ray source.
Vela X-1 is an eclipsing system at an estimated distance of 1.9 kpc (Sadakane et al., 1985) containing an B0.5Ib supergiant (mass 23 and radius 34 ) and a wind-fed pulsar with a period of 283 s (Nagase, 1989). The neutron star (NS) orbits in a period of 8.96 days very close to the non-synchronously rotating surface of the supergiant with a semi-major axis 53.6 (Barziv et al., 2001), so it is fully embedded in the acceleration zone of the stellar wind. The NS mass of 1.9 is the highest known (Barziv et al., 2001; van Kerkwijk et al., 1995) and the system has been studied at infrared (Huthoff & Kaper, 2002), UV (Sadakane et al., 1985; van Loon, Kaper & Hammerschlag-Hensberge, 2001), gamma (Raubenheimer et al., 1994) and at optical (van Kerkwijk et al., 1995; Kaper et al., 1994) wavelengths. It has not been detected at radio frequency (detection limit at mean cm radio flux density (mJy) (Fender & Hendry, 2000).
Orbital modulation of the spectra have been noted in the UV, X-ray, and optical wavelengths. Sadakane et al. (1985) noted absorption of Al III and Fe III in the UV, limited to the orbital phase () 0.5 and higher, and postulated the presence of a trailing wake. Bessell, Vidal, & Wikramsinghe (1975) reported an absorption component in the H spectrum around 0.6. Kaper et al. (1994) postulated that an absorption component in the optical spectrum resulted from a photoionization wake that trails the X-ray source, rather than the accretion wake which does not sufficiently obscure the supergiant. Smith (2001) studied an asymmetric dip in the UV lightcurve at 0.46-0.7 and concluded spectral ratios (predip/dip) contain information about the mechanism responsible for the variability. Absorption of soft X-rays during the 0.5 and higher was first reported in Tenma data (Nagase, 1989). Feldmeier et al. (1996) showed that a trailing photoionization wake can explain the asymmetry in the X-ray band during the eclipse ingress and egress.
Sako et al. (1999) using ASCA data demonstrated that the spectrum in eclipse was comprised of recombination lines and radiative combination continua (RRC) produced by photoionization in the stellar wind; they suggested the fluorescent K-shell lines from near-neutral atoms indicated that the X-ray -irradiated portion of the wind in Vela X-1 consists of cool dense clumps in a hotter, more ionized gas.
Schulz et al. (2002a) presented the first high-resolution spectrum during eclipse, and using RRC (including Ne X RRC) deduced a temperature of 1.2 K for the plasma. The spectrum showed clear evidence of photoionization processes, and the resonance (r) lines in the He-like triplets were of roughly equal strength to the forbidden (f) lines, consistent with resonant scattering.
We unexpectedly found that in 0.5 the emission lines were stronger than in eclipse by an order of magnitude, associated with the near disappearance of the soft X-ray continuum. This result, together with the unusual finding of multiple fluorescent emission lines, led us to further investigate emission line production in HMXBs by a study of Vela X-1 comparing eclipse, 0.25 and 0.5 using high-resolution Chandra datasets. We outline the data reduction proceedure in section 2, give our results in section 3 and present the discussion in section 4.
2 Observations
An analysis of Vela X-1 in eclipse (Chandra Dataset ObsId 102) has previously been reported (Schulz et al., 2002a). Three newer datasets obtained during one binary orbit (Figure 1) in 2001 with the Chandra High Energy Transmission Grating Spectrometer (HETGS) representing the orbital phases eclipse ( 0), 0.25 and 0.5 were available from the public archive (ObsIDs 1926, 1928, 1927, respectively (see Table 1). These datasets have not been previously reported, except for a specialized study of pulse-phased resolved emission of the Fe K line (Paul et al., 2002), and a summary report in a review of stellar winds in 5 HMXBs (Sako et al., 2003). The telescope operated in ”faint” data mode, with a timed readout (frame time) of 1.74 seconds. The HETGS employs two sets of transmission gratings: the Medium Energy Grating (MEG) with a range of 2.5-31 Angstroms (Å) (0.4-5.0 keV) and the High Energy Grating (HEG) with a range of 1.2-15 Å (0.8-10.0 keV). The resolution of the first-order HEG spectrum is = 0.012 Å, and MEG spectrum = 0.023 Å. The dispersed spectra were detected with the ACIS-S linear array of 6 CCD detectors. The HETGS/ACIS-S combination provides an undispersed (zeroth order) image and dispersed spectra from the gratings. The zeroth-order image of the non-eclipse datasets were affected by photon pileup and were not used in spectral analysis.
A complete re-processing was undertaken using Ciao software (version 2.3 with Caldb version 2.22) (including the tools acis_process_events, tgdetect etc) (Chandra X-ray Center Data analysis111http://asc.harvard.edu/ciao/) to produce grating ancillary response files (ARFs) and redistribution matrix files (RMFs). For spectral response the files acisheg1D1999-07-22rmfN0004.fits and acismeg1D1999-07-22rmfN0004.fits were used for the HEG and MEG respectively.
Measurement of emission lines in photoionized spectra involves consideration of the contribution to the lines by a continuum, and using Isis (version 1.0.50) lines were fitted with a gaussian plus a polynomial to fit the narrow regions adjacent to the line.
Initial inspection of the 0.25 spectrum showed a jagged appearance with few apparent narrow features apart from the Fe K line. For all datasets a fast fourier transform routine in Isis was used to smooth the spectral curve, which was viewed ”in counts” to assess statistical quality and find instrumental features, ”in flux density” to compare HEG and MEG spectra, and in ”delta-chi” to see the relative significance of deviations. This procedure identified a number of previously unreported emission and absorption features in the 0.25 spectrum, including 3 He-like triplets. ”Features” that do not appear both in HEG and MEG spectra are likely noise, or are more prominent in the HEG spectrum due to its higher resolution (Figures 2,3). Broad systematic flux differences are due to residual calibration errors. For 0.25 spectra, the statistical uncertainties are about 6% and 11% for MEG and HEG, respectively, near 7.5 Å, and rise to about 18% and 32% near 11.5 Å.
Pileup in a Charge-Coupled Device (CCD) occurs when there is coincidence of two or more photons per CCD frame-time within an event detection cell. Two or more photons interact in a detection cell of the detector resulting in a pulse height that is roughly the sum of the pulse heights of the individual photon events.This causes a lower event detection rate and distortion of the observed spectrum towards higher energies (Davis, 2001). The zero-order images of ObsID 1928 and 1927 showed visual evidence of pile-up. We checked for pileup in Vela X-1 (ObsId1928) first dispersion order very carefully, as its flux and mean MEG count rates are comparable to another X-ray binary 4U 1543-624 (ObsId 702) which is known to have mild pileup in the first order. The important metric in determining pileup is the counts/frame/cell, where a cell is a 3 pixel bin along the spectral dispersion axis (Dewey D 222http://space.mit.edu/HETG/technotes/pileup/pileup_9912.html)
Vela X-1 has 0.0345 and 4U 1543-624 has 0.045 counts/frame/cell, that is 4U 1543-624 has counts/frame/cell 30% higher than Vela X-1. Dewey argues the value of this metric indicates the magnitude of pileup effects: for values of 0.01 and less pileup effects are negligible; for values of 0.01 to 0.1 pileup may produce changes in event rates less than 10%; for values above 0.1 pileup can be severe and the data quality dubious.
The lack of pileup in Vela X-1 is demonstrated by a careful comparison of the HEG and MEG datasets in the range 1.7-15.2 Å. There is close agreement in the first-order spectra. In a graded series of 5 spectra with varying degrees of pileup, all spectra with pileup (including 4U 1543-624, the mildest case of the 5) show lack of close agreement between the MEG and HEG (J Davis 333http://cxc.harvard.edu/ccw/proceedings/02_proc/presentations/j_davis/pileup.html). The MEG has a larger effective area than HEG, and in the event of pileup the MEG will be piled (or more piled) than HEG, and the MEG spectrum saturates and does not follow (shows lower flux) than the HEG.
The assessment of absorption features in the 0.25 spectrum found photoelectric neutral K absorption edges from S, Si and Mg in cold gas. An optical depth (tau) of the neutral edge was assessed:
= ;
where is the X-ray flux on top of the edge at the high wavelength side and is the X-ray flux at the bottom of the edge at the low wavelength side (Schulz et al., 2002b). This optical depth is directly proportional to neutral absorption column densities and assesses the total amount of photo-electric absorption, which includes absorption in the vicinity of the source as well as the interstellar medium in the line of sight.
Smith (2001) in studying the dip in the UV lightcurve at 0.46-0.7 compared spectra predip to dip to obtain a ”ratioed spectrum”:
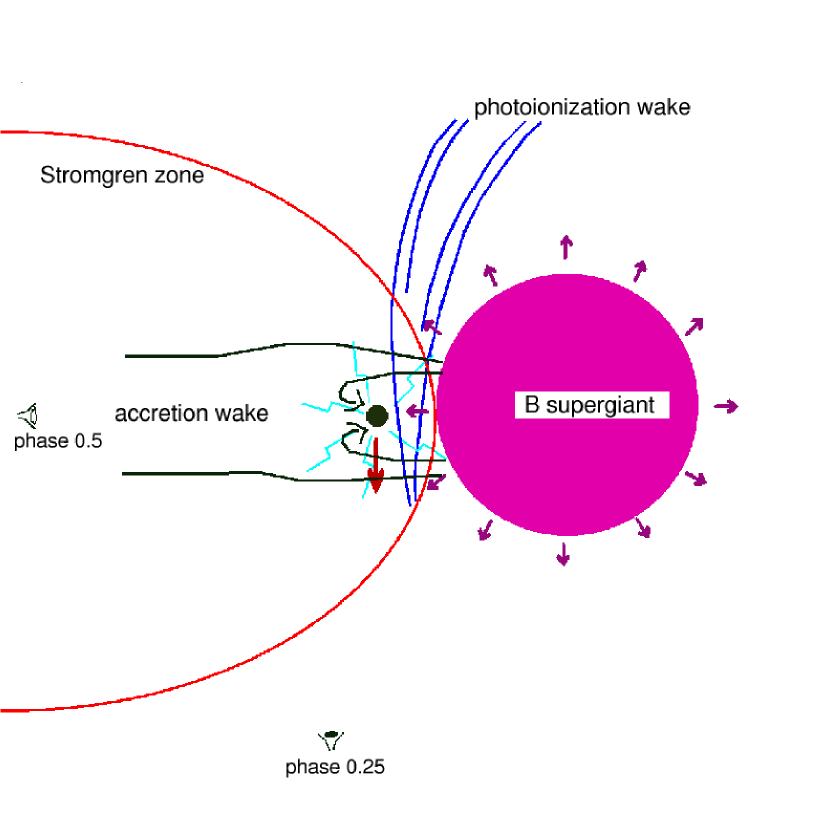
Between 5 and 13 Å, the strong X-ray continuum noted in 0.25 was markedly attenuated in 0.5. We consider a simple hypothesis in which an absorber (accretion wake associated with Bondi-Hoyle accretion) causes absorption at 0.5, but is not in the line-of sight at 0.25 (Figure 4). We estimated the ”ratioed spectrum,” and also modeled an optical depth of the absorption using:
.
3 Results
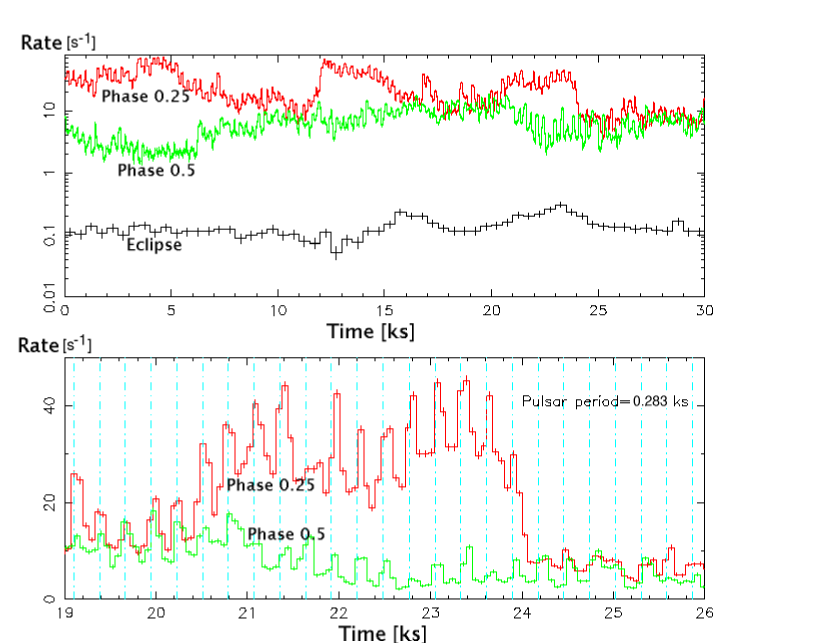
The 3 datasets were observed during 1 orbit of the companion by the NS (Figure 1) and no flaring behaviour occurred. The lightcurves from the 3 observations are compared in Figure 5, in which pulsed emission (period 283 s) may be discerned.
The 0.5-10 keV spectra were fit with a model of 2 absorbed powerlaws, a scattered and direct component (Sako et al., 1999). The photon index was fixed to 1.7 in both powerlaws in eclipse, with the second powerlaw index allowed to vary in the other phases (see Table 1, Figure 6). The total flux in 0.5 is reduced compared to 0.25 (Table 1, Figure 2).
Details of selected spectral lines and RRC are set out in Tables 2, 3,& 4. A rich mosaic of 10 H-like, 12 He-like and 15 fluorescent lines (including the unusual Ni K line), and 2 RRC were detected in the eclipse phase. Our results in eclipse phase are in general agreement with those reported by Schulz et al. (2002a), and were not significantly different from ObsID 102.
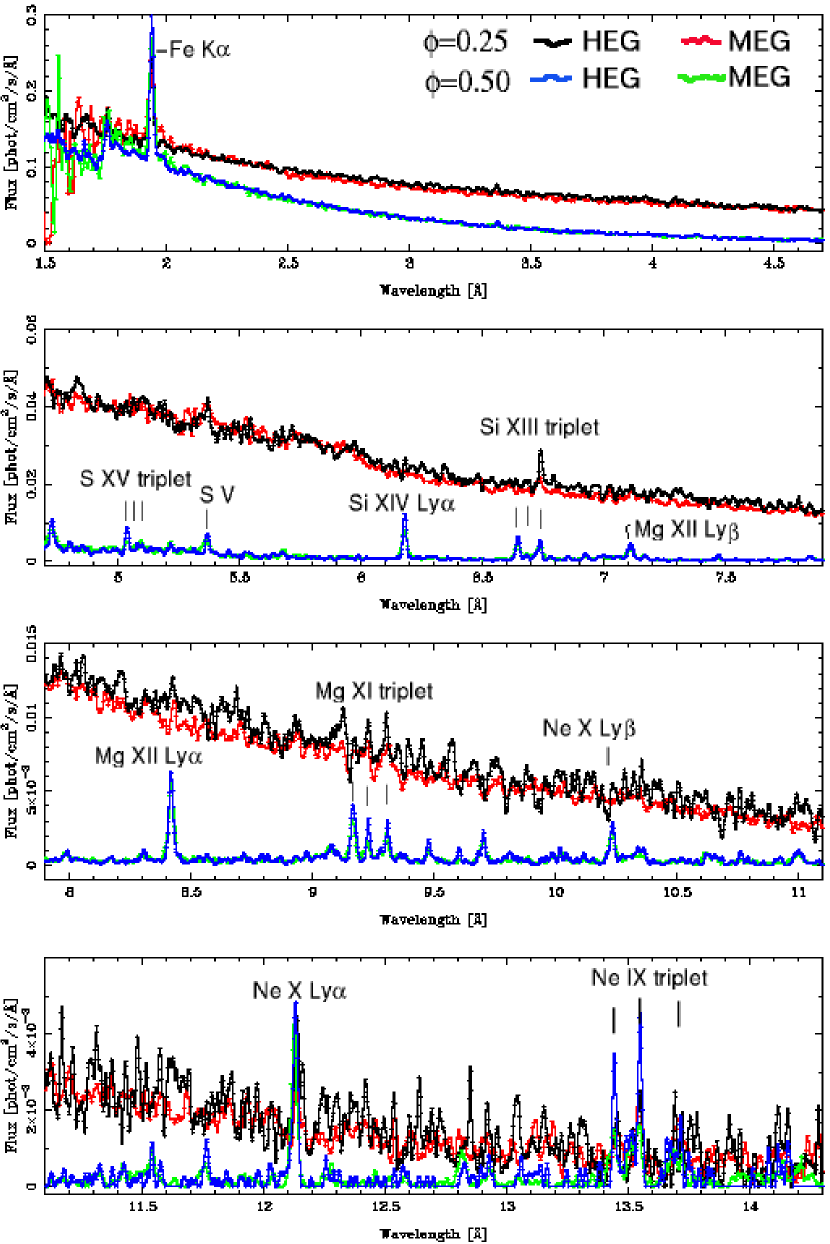
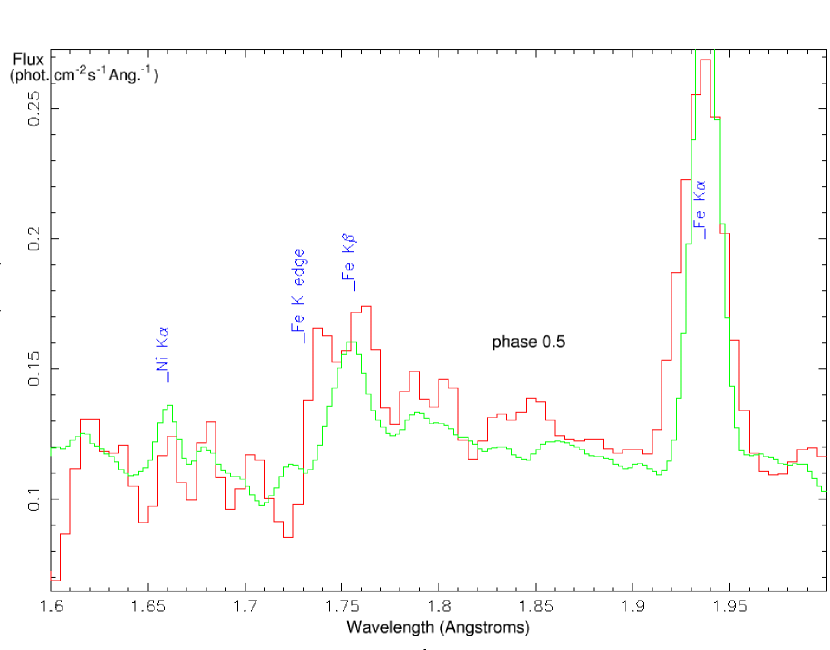
Comparisons of 2 spectra (from 0.25 and 0.5) are presented in Figure 2 (wavelength range 1.5-14.3 Å) and Figure 3 (1.6-2.0 Å).
The 0.25 displays a mix of narrow features in emission and in absorption (Tables 2, 3 ; Figures 2,3), and 5 photo-electric absorption edges were detected (Table 5). The narrow emission and absorption lines in this phase (including three He-like triplets) have not been previously reported. Two triplets have blue-shifted r lines seen in absorption, while the intercombination (i) and f lines are seen in emission (Figures 2, Table 3).
Comparing 0.5 to eclipse, the H- and He-like emission lines are 13 fold stronger at 0.5 (mean value for comparisons on 11 lines where firm confidence intervals established). The Fe K is 21 fold and Fe K 31 fold stronger. The Ca and Ar fluorescent lines seen in eclipse are not found in 0.5, probably due to the stronger direct continuum below 5 Å in 0.5. The Ni K line and a Fe K edge are shown in Figure 3. Vela X-1 is the only XRB with a Ni K line reported, however our study of GX 301-2 (in progress) has detected this line (Table 2).
In 0 and 0.5 the r and f lines of the He-like triplets have roughly equal strength. However in 0.25 the triplet r line is a little weaker than the f line (Ne IX) or is in absorption (Mg XI, Si XIII) (Figure 2).
The He and H-like emission lines showed a red-shift at 0 (of around 300 km ), and at 0.25 (of around 200 km ). However lines seen in absorption at 0.25 have a blue shift of around 300 km , consistent with the orbital velocity of the NS. At 0.5 the emission lines have a blue-shift (of around 150 km ).
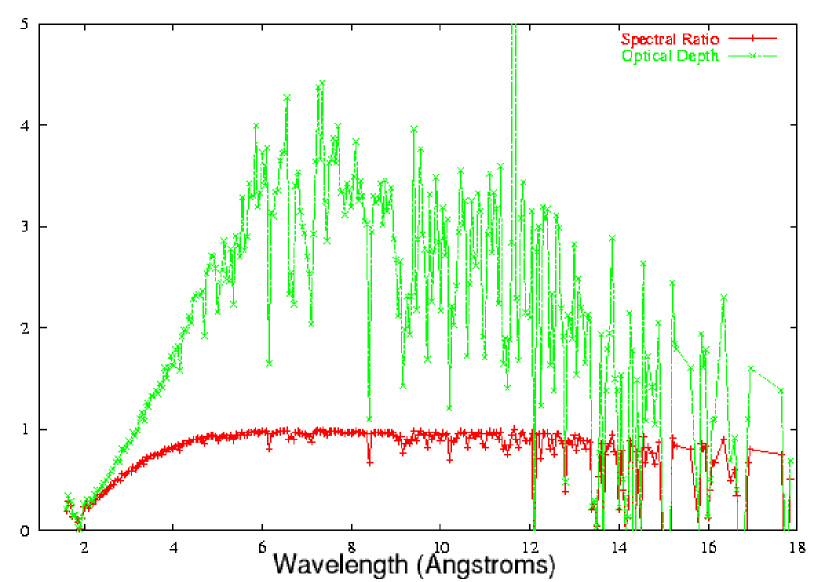
The dramatic attenuation of the X-ray continuum at 0.5 compared to 0.25 is modeled both as a spectral ratio ( 0.25/ 0.5) and as an optical depth in Figure 7. The optical depth increases steeply between 3 and 6 Å, then gradually declines from 6-13 Å.
4 Discussion
These results provide insights into how narrow lines are produced in HMXBs, and particularly into multiple fluorescent emission and orbital changes in emission line strength. The main features to be discussed below are:
(a) changes with orbital phase in emission lines and the strong narrow emission lines present in 0.5, the first detection of narrow emission and absorption lines in 0.25, and an analysis and measurement of the absorption of the X-ray continuum in 0.5.
(b) new aspects of the multiple fluorescent emission in Vela X-1, including the identifications of the Ni K line in Vela X-1, and also in GX301-2; the variation in line strength of Fe and Ni K with orbital phase, attributed (following Matt et al 1997) to an accreting system where the direct radiation is blocked, and only reflected radiation is visible; and the finding that multiple fluorescent emission lines may be a common feature of the supergiant category of HMXBs.
(c) Doppler shifts of emission lines in 0.5 indicate a slowing of the wind associated with the presence of the X-ray source and formation of the Stromgren zone and accretion wake. Two triplets in 0.25 show blue-shifted resonance lines seen in absorption while the intercombination and forbidden lines are seen in emission, with the blueshifted line in absorption having a different source to the lines seen in emission.
The X-ray luminosity of Vela X-1 is known to demonstrate considerable variation on time intervals from hours to days (Kreykenbohm et al., 1999; van Kerkwijk et al., 1995); there may be pulse-to-pulse variations even though the pulse profile averaged over many pulses is quite stable. Clearly our Chandra results (where flux change, and absorption change between phases are carefully measured) relate to only the observed orbit.
4.1 Photoionized Plasma
In Vela X-1 spectral features indicating plasmas in photoionization equilibrium (PIE) include (a) multiple fluorescent ions (b) narrow RRCs (Ne X and Ne IX) (c) relatively weak or apparent absence of iron L-shell emission in presence of K-shell emission from lighter elements (S, Si, Mg, Ne and O) (Liedahl et al., 2001), and (d) He-like triplet ratios that are consistent with photoionization and resonant scattering (involving photoexcitation) in a PI plasma. For Ne X the Lyman series (Ly:::) have line ratios of 1.0:0.35:0.17:0.12 in eclipse and 1.0:0.46:0.34:0.13 in 0.5. These flux ratios support the existence of photoexcitation since the fluxes of the higher lines in the series are higher than expected from a purely recombining or purely collisional plasma (Schulz et al., 2002a).
PIE are characterised by processes of photoionization (absorbed photon ejects electron from ion) and recombination (electron recombines with ion and emits photon or excites another electron). In PIE the ratio of the X-ray flux to the electron density is sufficiently high that collisional ionization processes are negligible relative to photoionization processes (Heeter et al., 1999). Spectra of PIE consist of either recombination emission, or fluorescent emission, or a composite of these (Liedahl, 1999). The dominance of fluorescence over recombination, or vice versa, is related to the charge state distribution, with highly ionized plasmas being recombination-dominated, while colder, less ionized plasma are fluorescence-dominated.
The He-like triplets have r and f line fluxes of roughly equal strength (except in the 0.25, see section 4.4) (Table 3,Figure 2). This is consistent with resonant scattering, defined as photoexcitation and subsequent decay by Wojdowski et al. (2003). The strong r line in eclipse in a photoionized plasma occurs because the Ly lines of H-like ions and the r lines of He-like triplets have large oscillator strengths (unlike the i and the f lines). Line emission of lines with large oscillator strengths is enhanced in the wind of an X-ray binary by photoexcitation from radiation from the compact source. However outside of eclipse photons from the NS may be scattered out of the line of sight to the observer, reducing the line flux of the r line of the He-like triplet (and the Ly lines), and if sufficient photons are scattered the r line may be seen in absorption, as noted in 0.25 with Si XIII and Mg XI (Table 3, Figure 2). In 0.5 the absorption of the continuum creates an ”eclipse-like” spectrum and triplets in 0 and 0.5 display similar ratios.
Narrow RRCs from Ne X and Ne IX (at 9.10 Å and 10.37 Å) were detected in eclipse and 0.5 and indicate a plasma temperature of 1.2 (Table 4). The measured Ly/RRC flux ratio for Ne X was 1.9 in eclipse and 2.1 in 0.5, which is not consistent with the ratio of 1.3 predicted for a purely recombining plasma, and implies photoexcitation is present (Schulz et al., 2002a).
4.2 The fluorescent lines.
There are 9 NS systems in the OB-supergiant category of HMXBs, to which Vela X-1 belongs, and 2 black hole systems (Kaper, 2001). Of 5 systems for which high-resolution X-ray spectra are available, multiple fluorescent lines are present in 3: Vela X-1 (this study, Schulz et al. (2002a)), GX 301-2 (our study in progress) and 4U 1700-37 (Boroson et al., 2003). Our study of GX 301-2 reveals Ca II- VII at 3.358 Å, Ar VI- IX at 4.18 Å, Si IX at 5.316 Å, S V at 3.367 Å and Si V at 7.116 Å, in addition to Ni and Fe K lines. Fe K transitions are common in photoionized X-ray spectra, but otherwise a multitude of fluorescent lines is unusual in X-ray astronomy. Matt, Fabian & Reynolds (1997) suggest that fluorescent emission from elements other than iron from neutral, externally X-ray illuminated matter may occur if the direct radiation is blocked and only reflected radiation is visible; then neutral ions of Ne, Mg, Si, S, Ar, Ca, Cr and Ni may be detected, and the line flux increases with increasing inclination angle of the gas slab. Thus in both Vela X-1 and GX301-2 the Fe K flux may vary in orbit as the angle changes, and when it is maximal the Ni K line (and other fluorescent lines) are most apparent (Table 2).
Photoionization and Compton ionization by high-energy X-ray or Gamma-ray photons are effective ways to remove inner shell electrons from an atom or ion, and the vacancy in the inner shell is filled by electron cascades from higher level shells of the ion. The process involves either a radiative transition - fluorescence - or a non-radiative transfer of energy to an electron (Auger effect), so the fluorescence yield, defined as the probability that radiation is emitted during the filling of the vacancy, is less than 1. The probability scales as , so high-Z K lines such as Fe are more common (Liedahl et al., 2001). The Ni K emission line in Vela X-1 was first detected by Sako et al. (1999), and is present in the scattered component of the eclipse and 0.5 spectra. This line is rarely detected in X-ray binaries or X-ray astronomy in general, and the first unambiguous detection in an active galactic nucleus was reported in 2003 (Molendi, Bianchi & Matt, 2003).
A K line occurs where an inner-shell ionization event causes a vacancy in the 1s shell, and the electron making a transition to fill the vacancy is a 2p electron. By contrast in collisional plasmas the processes of collisional excitation and excitation-auto-ionization mostly affect the outer electrons, and are less often associated with inner-shell auto-ionization (Kaastra & Mewe, 1993).
Fluorescent lines in Vela X-1 are an indicator of cooler clumps in the wind. Sako et al. (1999) developed a differential emission measure distribution to model Vela X-1, which has well-constrained system parameters, and achieved a realistic reproduction of the ASCA spectrum. The model had to accomodate lines from near-neutral Mg, Si, S, Ar, Ca, Fe, and Ni. In a simple homogenous wind model the local ionization parameter in the emission region was far too high to support near-neutral ions. The fluorescent lines must be produced in dense clumps or filaments in the wind that may be 100 times denser than in the ambient wind, and have local ionization parameters that are up to 2 orders of magnitude lower so they can support ions of low charge state. Liedahl (1999) has described in irradiated accretion disks how hard X-ray photons can ”burrow” into cool material, and are absorbed through K-shell photoionization producing fluorescent emission.
4.3 Doppler Shifts of Emission lines
The orbital velocity of the NS was calculated at 300 km , consistent with Sako et al. (1999). In 0.25, the lines seen in absorption (directly in line of sight of the NS) generally had a blueshift consistent with this value (Tables 2, 3). However other lines seen in emission (as a result of scattering) had a redshift of the order of 200 km , indicating their source in ions in part of the stellar wind with a relative bulk motion of around 500 km .
In eclipse the H- and He-like ions demonstrate a modest redshift, and in 0.5 they are blueshifted. The lines are produced in a process (resonant scattering) whereby ions in the wind absorb a photon from the X-ray source, and emit a photon in the line of sight to the observer. In eclipse these ions are located in regions of the wind (from the supergiant) which are receeding, and out-of eclipse are approaching the observer. The mean blueshift was 179 km in 13 lines in 0.5 where fits with narrow ( km ) confidence limits were obtained. This indicates that the supergiant’s wind velocity is less than expected, since at the distance of the NS from the supergiant’s surface, it should be around 860 km s-1, that is around 50% of the wind terminal velocity of 1700 km -1 (Dupree et al., 1980)). The result suggests that the high photoionization conditions effectively quench the driving force and acceleration of the wind, contributing to the formation of a Stromgren zone (see section 4.5 below).
Precise line-shifts were difficult to obtain in the fluorescent ions, with the exception of the Fe K line. The Fe K line does not follow the same pattern as H- and He-like ions: although there is a small redshift apparent in eclipse, in 0.5 there is no blueshift as found in the H- and He-like ions. This is consistent with the above argument that the fluorescent ions arise in different regions of the stellar wind. The Fe K line has a redshift around 200 km in 0 and 0.5, and a small blueshift at 0.25. This shift is consistent with lightly ionized Fe VIII- X (House, 1969), and the orbital motion of 300 km may explain the blueshift at 0.25.
4.4 Absorption and Emission lines at 0.25
Haberl, White & Kallman (1989) noted that when the X-ray source of HMXBs is viewed through the stellar wind captured by the compact object, absorption K-edges such as O, Si, S, and K- and L- edges of Fe are seen. Many of these edges are apparent in 0.25, but only the K-edges of S and Fe are seen in 0.5 (Table 5).
Several lines seen in emission in eclipse appear in absorption at 0.25 (Ne X Ly, the r lines of the Mg XI (Figure 2, Table 3) and Si XIII triplets (Table 3), and Mg V (Table 2). These features only became clear when the smoothing technique was applied. Smoothing (or binning) on the scale of the resolution make weak absorption and emission features easily visible. The photons from the X-ray source in the line of sight may be scattered or absorbed by the stellar wind en route to the observer. Miller et al. (2002) also noted these triplets with r in absorption and i and f in emission in another supergiant HMXB, the black hole system Cyg X-1. We expect the phenomenon may also be found in other X-ray binaries such as 4U 1700-37, when spectra at various orbital phases are available. Some emission lines are seen at 0.25 as a result of resonant scattering (Ne X and Mg XII Ly and Ly lines, Ne IX triplet), although others may be obscured by the continuum. The Doppler shifts of the lines seen in absorption and those seen in emission are different reflecting their different regions of origin.
In 0.5 no absorption features are detected, apart from edges at 5.0 and 1.74 Å(Figure 3). Phase 0.25 has numerous absorption lines and edges, so a further study between these 2 phases may be warranted to find a transition phase with more absorption features.
4.5 Strong Emission Lines at 0.5
It is generally considered in HMXBs such as Cen X-3 and Vela X-1 that the emission lines are most prominent in eclipse, but persist outside of the eclipse phase of the orbit (Miller et al., 2002). We consider the marked absorption of the continuum at 0.5 (Figure 7) to be responsible for the unexpectedly strong emission lines seen in this phase. In eclipse only X-rays which have been reprocessed in a visible part of the wind are observed. The 0.5 line emission displays the same features as in 0, only fluxes are stronger. Thus at 0.5 there is an ”eclipse-like” condition with the disappearance of the X-ray continuum in the band 4-12 Å associated with the detection of the strong line emission due to scattering of photons in the stellar wind.
SMC X-1 is a further example of stronger line emission apparent when the continuum is blocked out of eclipse (Vrtilek et al., 2001). In SMC X-1 when out-of-eclipse in the high state the X-ray source is not blocked and the observer sees only a continuum (similar to the Vela X-1 0.25 spectrum), but when the source is blocked by precession of the disk (signified by the low-state) the line emission is apparent (Vrtilek et al., 2001). Vela X-1 has no precessing disk, but the absorption of soft X-rays and other radiation bands around 0.5 has been reported by many investigators.
Liedahl et al. (2001) note that if local material intervenes with our line of sight to the continuum source, then absorption may produce observable photoelectric edges or otherwise alter the shape of the continuum. The X-ray irradiated gas in the vicinity of the continuum source radiates lines and continua characteristic of the local conditions and may intercept continuum radiation at energies corresponding to atomic level separations. Thus a photon can be absorbed, and subsequently re-emitted at nearly the same energy, but with a new direction, so a subtraction from the photon flux propagating toward the observer may occur.
We postulate that a wind structure in the line of sight accounts for the increased optical depth in the 3-12 Å band in 0.5. Two distinct structures are described in the various reports of absorption (including those that find a higher absorption after 0.5 than before it). These are the photoionization wake, and the accretion wake (Figure 4). The X-ray source creates a Stromgren zone in which the high photoionization conditions effectively quench the driving force and acceleration of the wind. The stagnant flow inside the ionization zone collides with the accelerating wind at the trailing border to form a photoionization wake, as shown in Figure 4. In the UV investigators have concluded the dip in the lightcurve around 0.5 is due to the photoionization wake, because the source is large (the supergiant) and the accretion wake could not sufficiently occlude it. By contrast the X-ray source is very compact and is readily occluded by the accretion wake at 0.5 (Figure 4). Dumm et al. (2000) has reported how an accretion wake in an X-ray nova has modified the lightcurve in the UV.
Supergiant stars have prodigious mass loss through stellar winds, typically per year. Wind material departs uniformly from the surface of the star, and accretes onto the NS if it passes within a critical distance forming an accretion column. Adjacent material that is perturbed in its flow but is not accreted forms an accretion wake.
The discovery of this wind structure in Vela X-1 may be helpful in interpreting emission lines in other X-ray binaries. 4U 1700-37 is also reported to have strong emission lines out-of-eclipse ( 0.7) (Boroson et al., 2003). These authors consider the possibility that the emission lines appear because the X-ray source is seen ”through an enhanced-density gas stream”. However it may be argued that the lines are seen via scattered photons. Analogous to the case of Vela X-1, the lines may be seen in emission because the continuum X-rays approaching directly from the source are absorbed by an accretion stream or wake, allowing the scattered photons to be viewed. Haberl et al. (1989) have modelled the accretion stream and wake in 4U 1700-37, which was found to act as an absorber at 0.6.
4.6 Source of X-rays
Raubenheimer et al. (1994) has suggested that X-rays and gamma rays from Vela X-1 are produced by the same mechanism, that is by a beam of charged nucleons accelerated in the strong magnetic field at some distance from the surface of the NS. The beam interacts with accretion material to form mesons which decay to gamma rays which escape when the production region is far enough from the NS so they are not depleted by pair production in the strong magnetic field, and the density is low enough to avoid absorption. However, Liedahl et al. (2001) and Wojdowski et al. (2003) prefer resonant scattering of X-rays from an accretion “hot spot”. This study provides further support for resonant scattering.
Vela X-1 may have an accretion column, as well as an accretion wake. Vela X-1’s X-ray signal is strongly pulsed, indicating there is a hot spot on the NS surface. A hot spot is predicted from the cyclotron scattering resonance features with a cyclotron resonance high-energy cutoff of 15-20 keV, corresponding to a magnetic field strength of 2.3 Gauss (White et al., 1995). The hot spot is a thermal radiator and the pulse profile is determined by the variation in the projected area of the hot spot as the NS rotates (Lyne & Graham-Smith, pp 131-143, 1998). The pulse has high amplitude (amplitude 45% in the 1.2-2.3 keV band and 55% in the 13.5-18.5 keV band of the time-averaged signal), and a notch or ”double pulse shape” in the main pulse in the X-ray and UV pulse profiles (shown in Figure 7 of Boroson et al. (1996)). Pulse profiles at different energies are further determined by shadowing of surface radiation by the accretion column and gravitational focusing of column radiation. A notch in the main pulse may result where the accretion column is optically thick, causing scattering of radiation propagating vertically through the accretion column.
Insight as to how these complex structures interact to produce a strong absorption of the 5-12 Å band may be provided by study of pulse-phase resolved emission. In a study of the HEG spectra Paul et al. (2002) demonstrated weak phase dependence of the Fe K line and suggested that this represented an anisotropic velocity distribution; further studies on additional lines are in progress.
5 Conclusions
X-ray emission in Vela X-1 results from capture and accretion of gas in the stellar wind of the supergiant star onto the hot spot on the NS. Wind material departs uniformly from the surface of the star, and accretes onto the NS if it passes within a critical distance forming an accretion column. Adjacent material that is perturbed in its flow but is not accreted forms an accretion wake. The X-rays ionize and heat the surrounding gas, and are reprocessed in the stellar wind. Spectra at orbital phases 0, 0.25 and 0.5 reflect the processes of mass loss in the stellar wind of the supergiant and mass accretion onto the NS.
The Doppler shifts at 0.5 indicate slowing of the supergiant’s wind velocity in the vicinity of the NS, consistent with X-ray photoionization and destruction of ions with strong UV resonance transitions that otherwise drive the stellar outflow. The X-ray source creates a Stromgren zone in which the high photoionization conditions effectively quench the driving force and acceleration of the wind.
Spectra at 0.25 reveal simultaneous evidence of emission lines produced by scattering, and absorption lines that are produced in different regions of the binary system.
Narrow emission lines in Vela X-1 become apparent when the continuum is blocked from line of sight, either by eclipse or by scattering and/or absorption from a wake or cloud. The X-ray source is very compact and is readily occluded by the accretion wake at 0.5, accounting for the absorption of soft continuum. Absorption of the continuum at 0.5 has allowed detection of scattered radiation and emission lines whose strength is an order of magnitude higher than those in the eclipse phase. The eclipse and 0.5 spectra have a similiar appearance, and the ratios of lines in the He-like triplets are consistent with photoionization and resonant scattering (involving photoexcitation) in a PI plasma.
Multiple fluorescent emission lines have been detected in 3 of 5 supergiant HMXBs for which high resolution X-ray spectra are available. This study suggests fluorescent emission from externally X-ray illuminated matter may occur from elements other than neutral iron if the direct radiation is blocked and only reflected radiation is visible, when neutral ions of Ne, Mg, Si, S, Ar, Ca, Cr and Ni may be detected.
Differences in Doppler shifts of various lines indicate different origins of lines, from direct radiation from the surface of the NS (lines seen in 0.25 in absorption) and from adjacent regions in the stellar wind from scattered radiation.
References
- Barziv et al. (2001) Barziv, O., Kaper, L., Van Kerkwijk, M. H., Telting, J. H., & Van Paradijs, J. 2001, A&A, 377, 925
- Bessell, Vidal, & Wikramsinghe (1975) Bessell, M.S., Vidal, N.V., & Wikramsinghe, D.T. 1975,ApJ,195,L117
- Boroson et al. (1996) Boroson, B., McCray, R., Kallman, T., & Nagase, F. 1996,ApJ,465,940
- Boroson et al. (2003) Boroson, B., Vrtilek, S.D., Kallman, T., & Corcoran, M. 2003, ApJ, 592, 516
- Davis (2001) Davis, J.E. 2001, ApJ,562,575
- Dumm et al. (2000) Dumm, T., Folini, D., Nussbaumer, H., Schild, H., Schmutz, W., & Wilder, R. 2000, A&A,354,1014
- Dupree et al. (1980) Dupree, A., Gursky, H., Black, J.,(and 17 other authors) 1980, ApJ,238,969
- Feldmeier et al. (1996) Feldmeier, A., Anzer, U., Borner, G. & Nagase, F. 1996, A&A,311,793
- Fender & Hendry (2000) Fender, R.P., & Hendry, M.A. 2000, MNRAS,317,1
- Haberl, White & Kallman (1989) Haberl, F., White, N.E., & Kallman, T.R. 1989, ApJ,343,409
- Heeter et al. (1999) Heeter, R., Emig, J., Foord, M., Thoe, R., Springer, P., Bailey, J., Cuneo, M. & Deeney, C. 1999, X-Ray Photoionized Plasmas in the Laboratory, in HEASARC Conf. Ser., Atomic Data Needs for X-ray Astronomy, ed. M. A. Bautista, T. R. Kallman, & A. K. Pradhan (Goddard:NASA),135
- House (1969) House, L. 1969 ApJS,18,21
- Huthoff & Kaper (2002) Huthoff, F., & Kaper, L. 2002, A&A,383, 999
- Kaastra & Mewe (1993) Kaastra, J.S., & Mewe, R. 1993, A&AS, 97,443
- Kaper (2001) Kaper, L. 2001, in ASSL Conf. Ser., The Influence of Binaries on Stellar Population Studies, ed. D. Vanbeveren (Dordrecht: Kluwer Academic Publishers), 125
- Kaper et al. (1994) Kaper, L., Hammerschlag-Hensberge, G., & Zuiderwijk, E. J. 1994, A&A, 289,846
- Kreykenbohm et al. (1999) Kreykenbohm, I., Kretschmar, P., Wilms, J., Staubert, R., Kendziorra, E., Gruber, D. E., Heindl, W. A., & Rothschild, R. E. 1999, A&A, 341,141
- Liedahl et al. (2001) Liedahl, D., Wojdowski, P., Jimenez-Garate, M., & Sako, M. 2001, in ASP Conf. Ser. 247, Spectroscopic Challenges of Photoionized Plasmas, ed. G. Ferland & D.W. Savin (San Franscisco:ASP),417
- Liedahl (1999) Liedahl, D.A. 1999, in Lecture Notes in Physics, X-Ray Spectroscopy in Astrophysics, ed. J. van Paradijs & J. Bleeker (Amsterdam:Springer),236
- Liu et al. (2000) Liu, Q., van Paradijs, J., & van den Heuvel, E. 2000, A&AS,147,25
- Lyne & Graham-Smith (pp 131-143, 1998) Lyne, A.G. & Graham-Smith, F. 1998, Pulsar Astronomy, (2d ed.;Cambridge:Cambridge University Press)
- Matt, Fabian & Reynolds (1997) Matt, G., Fabian, A., & Reynolds, C. 1997, MNRAS, 289,175
- Miller et al. (2002) Miller, J. M., Wojdowski, P., Schulz, N.S., Marshall, H.L., Fabian, A.C., Remillard, R.A., Wijnands, R., & Lewin, W. H. G. 2002, preprint (astro-ph/0208463)
- Molendi, Bianchi & Matt (2003) Molendi, S., Bianchi, S., & Matt, G. 2003 , MNRAS, 343, L1
- Nagase (1989) Nagase, F. 1989, PASJ, 41, 1
- Paul et al. (2002) Paul, B., Dewangen, G., Sako, M., Kahn, S., Paerels, F., Liedahl, D., Wojdowski , P., & Nagase, F. 2002, PASJ, 355
- Raubenheimer et al. (1994) Raubenheimer, B.C., North, A.R., De Jager, O.C., Meintjes, P.J., & Nel, H.I. 1994, ApJ, 428,777
- Sadakane et al. (1985) Sadakane, K., Hirata, R., Jugaku, J., Kondo, Y., Matsuoka, M., Tanaka, Y., & Hammerschlag-Hensberge, G. 1985, ApJ, 288, 284
- Sako et al. (1999) Sako, M., Liedahl, D., Kahn, S., & Paerels, F. 1999, ApJ, 525,921
- Sako et al. (2003) Sako, M S., Kahn, M. Paerels, F., Liedahl, D. A. Watanabe, S., Nagase, F., Takahashi, T., 2003, preprint (astro-ph/0309503)
- Schulz et al. (2002a) Schulz, N., Canizares, C., Lee, J., & Sako, M. 2002a, ApJ, 564, L21
- Schulz et al. (2002b) Schulz, N., Cui, W., Canizares, C., Marshall, H., Lee, J., Miller, J.M., & Lewin, W.H.G. 2002b, ApJ, 565,1141
- Smith (2001) Smith, M.A. 2001, ApJ,562,998
- van Kerkwijk et al. (1995) van Kerkwijk, M. H., van Paradijs, J., Zuiderwijk, E. J., Hammerschlag-Hensberge, G., Kaper, L., & Sterken, C. 1995 A&A, 303, 483
- van Loon, Kaper & Hammerschlag-Hensberge (2001) van Loon, J. Th., Kaper, L. & Hammerschlag-Hensberge, G. 2001, A&A, 375,498
- Vrtilek et al. (2001) Vrtilek, S. D., Raymond, J. C., Boroson, B., Kallman, T., Quaintrell, H., & McCray, R. 2001,ApJ, 563, L139
- White, Nagase & Palmar (1995) White,N.E., Nagase,F., & Palmar A.N. 1995, in X-ray Binaries, ed. W. Lewin, J. van Paradijs, & E. van den Heuvel (Cambridge:Cambridge University Press),1
- Wojdowski et al. (2003) Wojdowski, P., Liedahl, D., Sako, M., Kahn, S., & Paerels, F. 2003, ApJ,582,959
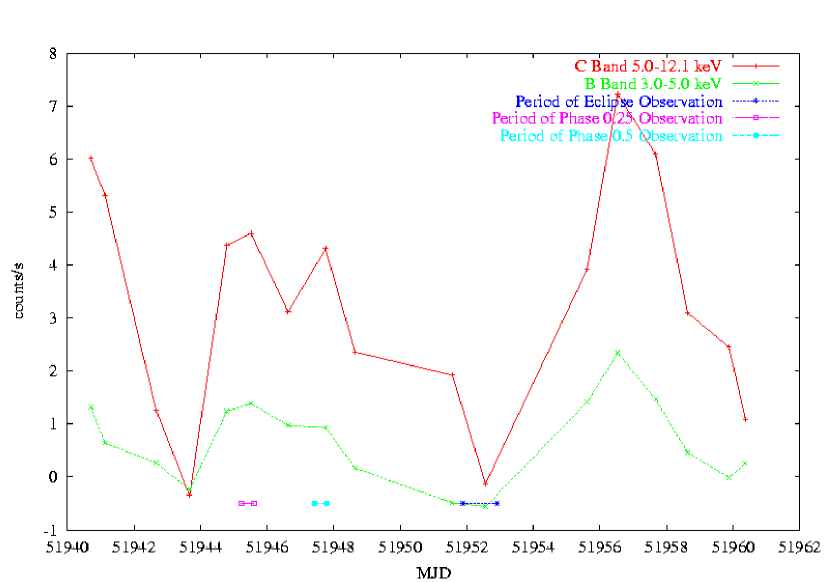
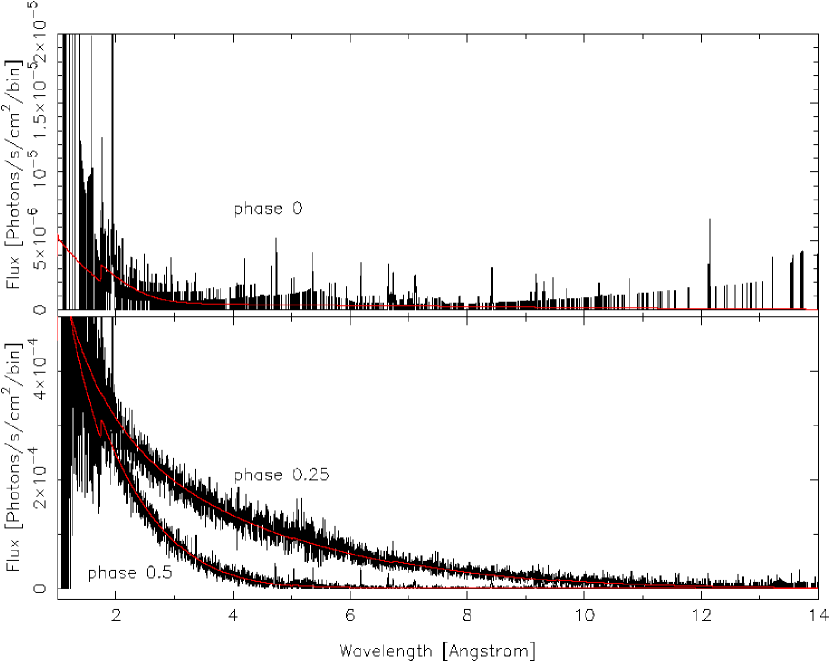
Fig. 2 NEXT PAGE Comparison of smoothed spectra, showing the strong continuum in phase () 0.25 (upper spectrum) that partially obscures the emission lines apparent in phase 0.5 (panels 2 and 3). There are 2 curves for each phase, representing the high and medium energy grating (HEG and MEG) spectra. In 0.25 HEG (black line) with higher resolution has more sharp unresolved features than MEG (red line), and its lower area gives it larger statistical uncertainty. For 0.25 spectra, the statistical uncertainties are about 6% and 11% for MEG and HEG, respectively, near 7.5 Å, and rise to about 18% and 32% near 11.5 Å. There are three lines (Mg XI triplet r, Ne X Ly and Ly) in absorption in 0.25 and in emission in 0.5. The inverted Mg XI triplet r is blueshifted compared to the i and f lines.
| Parameter | Eclipse(ObsId 102) | Eclipse(ObsID 1926) | 0.25 | 0.5 |
|---|---|---|---|---|
| Scattered | ||||
| aain units of | 0.5 | 0.5 | 0.5 | 0.5 |
| Powerlaw normbbin units of photons | 0.00060 | 0.00064 | 0.0083 | 0.0066 |
| Powerlaw PI | 1.7 | 1.7 | 1.7 | 1.7 |
| Direct | ||||
| 39.9 | 39.0 | 1.2 | 12.2 | |
| Powerlaw norm | 0.0081 | 0.0074 | 0.22 | 0.12 |
| Powerlaw PI | 1.7 | 1.7 | 0.92 | 0.60 |
| Flux(0.5-10 keV)ccin units of ergs | 1.17e-11 ddSchulz et al. (2002a) reported a measurement of 0.88e-11 ergs on this dataset | 1.13e-11 | 3.16e-9 | 2.04e-9 |
| Dataset Details | ||||
| ObsID | 102 | 1926 | 1928 | 1927 |
| Start Date | 2000-04-13 | 2001-02-11 | 2001-02-05 | 2001-02-07 |
| Duration (ks) | 30 | 85 | 35 | 30 |
| 0.98-0.02 | 0.97-0.08 | 0.23-0.27 | 0.48-0.52 | |
| Ionaafrom House (1969) | Expected | Ob 1926 | Ob 1928 | Ob 1927 | Ratio | |||
|---|---|---|---|---|---|---|---|---|
| Å | 0 | 0.25 | 0.5 | Flux | ||||
| Shiftbbin units of km ; positive values are redshifted | Fluxccin units of photons | Shift | Fluxddnegative flux value indicates line is seen in absorption | Shift | Flux | 1927/26 | ||
| Ca II-VII | 3.359 | -119 | 0.5 | 22.6 | ||||
| Ar VI-IX | 4.186 | 847 | 0.2 | -82 | 3.9 | 20.5 | ||
| S IX | 5.320 | 198 | 0.5 | -377 | 2.2 | 4.2 | ||
| S V | 5.367 | 34 | 0.5 | 11.6 | -150 | 3.8 | 7.1 | |
| Si XI-XII | 6.750-6.813 | 0.1 | 1.8 | 18.0 | ||||
| Si X-XI | 6.813-6.882 | 0.3 | 0.9 | 3.0 | ||||
| Si IX | 6.947 | 3.0 | 2.9 | |||||
| Si VIII | 7.007 | 0.3 | -396 | 1.0 | 3.2 | |||
| Si VII | 7.063 | -85 | 0.2 | 1.6 | 8.2 | |||
| Si V | 7.117 | 3.2 | ||||||
| Mg VIII-IX | 9.436-9.544 | |||||||
| Mg V | 9.814 | -763 | 0.1 | 539 | 0.6 | 5.4 | ||
| Mg II | 9.890 | -217 | 0.5 | -10 | 0.6 | 1.3 | ||
| Neutral Fe and Ni Fluorescent Lines in Vela X-1 | ||||||||
| Ni K | 1.660 | -328 | 4.860 | 15.1 | ||||
| Fe K | 1.756 | 31.1 | ||||||
| Fe K | 1.937 | 20.7 | ||||||
| Expected Line Shift Associated with Orbital Motioneefor directly observed photons originating on or near the surface of the neutron star | ||||||||
| -22 | -322 | -22 | ||||||
| Neutral Fe and Ni Fluorescent Lines in GX 301-2eefor directly observed photons originating on or near the surface of the neutron star | ||||||||
| 0.1-0.2 | 0.96-0.98 | 0.47-0.48 | ||||||
| Ni K | 1.660 | 370 | 17 | |||||
| Fe K | 1.756 | |||||||
| Fe K | 1.937 | |||||||
| Ion | Expected aafrom Chandra X-Ray Center Atomic Database(http://asc.harvard.edu/atomdb/) | Ob 1926 | Ob 1928 | Ob 1927 | Ratio | |||
|---|---|---|---|---|---|---|---|---|
| Å | 0 | 0.25 | 0.5 | Flux | ||||
| Shiftbbin units of km ; positive values are redshifted | Fluxccin units of photons | Shift | Fluxddnegative flux values indicate lines that are seen in absorption | Shift | Flux | 1927/26 | ||
| H-like Ions | ||||||||
| S XVI | ||||||||
| Ly | 4.730 | 9.5 | ||||||
| Si XIV | ||||||||
| Ly | 5.217 | 322 | 0.3 | 16.5 | ||||
| Ly | 6.183 | 16.0 | ||||||
| Mg XII | ||||||||
| Ly | 7.106 | 7.1 | ||||||
| Ly | 8.422 | 14.4 | ||||||
| Ne X | ||||||||
| Ly | 9.481 | 262 | 0.14 | -356 | -1.6 | 12.9 | ||
| Ly | 9.708 | 5 | 0.2 | 24.2 | ||||
| Ly | 10.239 | -186 | -1.7 | 15.6 | ||||
| Ly | 12.135 | 11.9 | ||||||
| O VIII | ||||||||
| Ly | 18.970 | 563 | 0.48 | 73 | 1.6 | 3.4 | ||
| He-like Triplets | ||||||||
| S XV | ||||||||
| r | 5.039 | 401 | 0.97 | 9.9 | ||||
| i | 5.065 | 426 | 0.20 | -96 | 0.6 | 3.0 | ||
| f | 5.102 | 264 | 4.8 | 10.9 | ||||
| Si XIII | ||||||||
| r | 6.648 | 10.1 | ||||||
| i | 6.687 | 287 | 0.1 | 152 | 39 | |||
| f | 6.740 | 10.6 | ||||||
| Mg XI | ||||||||
| r | 9.169 | 17.3 | ||||||
| i | 9.230 | 309 | 0.22 | -97 | -172 | 8.7 | ||
| f | 9.314 | 19.6 | ||||||
| Ne IX | ||||||||
| r | 13.447 | 201 | 0.34 | 359 | 2.6 | |||
| i | 13.552 | 299 | 0.10 | -199 | 16.1 | |||
| f | 13.699 | 328 | 0.42 | 241 | 5.2 | |||
Note. — for H-like (and He-like i) doublets the mean of the 2 lines is used.
| Parameter | Eclipse | 0.5 | ||
|---|---|---|---|---|
| Ne X | Ne IX | Ne X | Ne IX | |
| normbbin units of photons | 0.6 | 0.6 | 6.5 | 6.0 |
| edgeccin units of keV | 1.3628 | 1.1956 | 1.3628 | 1.1956 |
| kTddin units of keV (kT of 0.01035 keV represents a temperature of 1.2 ) | 0.01035 | 0.01035 | 0.01035 | 0.01035 |
Note. — The measured Ly/RRC flux ratio for Ne X was 1.9 in eclipse and 2.1 in 0.5
| Edge | (Å) | Opt. Depth | |
|---|---|---|---|
| 0.25 | S K | 5.00 | 0.026 |
| Si K | 6.72 | 0.054 | |
| Mg K | 9.50 | 0.097 | |
| Ne K | 14.30 | 0.42 | |
| Fe L3aaFe L3 edge is due to transition from the level | 17.55 | 0.12 | |
| 0.5 | S K | 5.0 | 0.17 |
| Fe KbbFe K edge is present at 1.74 Å in 0.5, and absent from other phases, consistent with variation in the angle of the slab of gas with orbital phase. This edge is also present (and stronger = 0.90) in GX 301-2 | 1.74 | 0.15 |