X-ray Luminosity Functions of Active Galactic Nuclei
Abstract
In this proceedings paper, I overview the current status of the X-ray luminosity function of AGNs in the soft (0.5-2 keV) band, extended using XMM-Newton and Chandra survey data. We found that the number density of low luminosity AGNs peaks later in the history of the universe () than the that of high luminosity AGNs (). I also describe the basic results of a spectroscopic followup project of a complete HEAO-1 hard X-ray limited sample of AGNs using ASCA and XMM-Newton and present separate intrinsic hard X-ray luminosity functions for unabsorbed and absorbed AGNs. We found that the absorbed AGN XLF drops more rapidly at high luminosities, indicating a deficiency of absorbed luminous AGNs.
1 Introduction
X-ray surveys are practically the most efficient means of finding active galactic nuclei (AGNs) over a wide range of luminosity and redshift. In order to construct an X-ray luminosity function (XLF) of AGNs, enormous efforts have been made to follow up X-ray sources with optical telescopes to establish their nature as AGNs and to measure their redshifts. Now that we have fairly complete samples of X-ray selected AGNs over 6 orders of magnitude in flux, from surveys ranging from all the high galactic latitude sky to the deepest pencil-beam fields. These enable us to construct and probe luminosity functions over cosmological timescales.
In this proceedings article, I overview the current progress of a few projects related to AGN XLF. Firstly, I overview the results of the soft X-ray (0.5-2 keV) luminosity function (SXLF), which is the continuation of our previous work with ROSAT samples[11], extended with deep XMM-Newton and Chandra surveys.
While the soft X-ray surveys select against obscured AGNs, in the current situation, the number of available objects and area-flux coverage from extensive surveys make them useful for probing detailed behaviors of XLFs of the unabsorbed portion of the AGN activity. A complementary XLF in the hard band (2-10 keV) (HXLF) enables us to also look into obscured AGNs, and thus it provides most direct measure of the accretion onto supermassive blackholes (SMBHs). Ueda et al. in this volume covers our extensive recent work on HXLF (see also Ueda at al. 2003[20] for a full description).
In this article, we also present the results of our XMM-Newton and ASCA spectroscopic followup of a complete hard X-ray flux-limited sample of bright AGNs selected from HEAO-1 catalogs[19], the basic results of which have been integrated in the Ueda et al’s HXLF.
2 AGN Soft X-ray Luminosity Function and Evolution
2.1 The Combined Sample
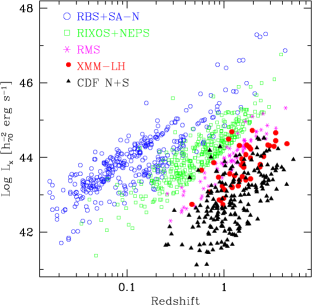
In addition to the ROSAT samples used in our previous work[11, 12], we have added AGNs from the ROSAT North Ecliptic Pole Survey (NEPS)[6], from an XMM-Newton observation on the Lockman Hole [8] and the Chandra Deep Surveys South[17]/North[2]. For the Lockman Hole region, the inner part based on the ROSAT HRI has been replaced by a new XMM-Newton sample[8]. Four medium-deep ROSAT surveys used in our previous work[11, 12], i.e., the UK Deep Survey[9], Marano Field[22], North Ecliptic Pole (deep PSPC-pointing)[3] and the outer part of the Lockman Hole (PSPC)[15] are now collectively called the ROSAT Medium-Sensitivity Survey (RMS). The combined area versus limiting flux relation and the redshift-luminosity diagram are shown in Fig. 1. The samples are summarized in Table 2.1. We have tried to limit our analysis to “type 1” AGNs (including narrow-line Seyfert 1 galaxies). In the ROSAT samples, we selected type 1 AGNs mainly from the optical classifications. For the XMM-Newton Lockman Hole and Chandra DEEP field samples, the optical classification is supplemented by hardness ratios of the X-ray sources. AGNs with have been excluded from the analysis to avoid the possible effects of the local large scale structure. Details will be explained in Hasinger et al. (in preparation).

2.2 SXLF and Evolution with Redshift
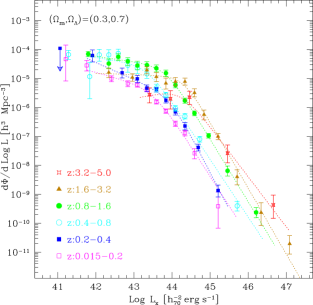
The soft X-ray Luminosity functions (SXLF) in different redshift bins have been calculated using the estimator, where each redshift bin has been maximum-likelihood fitted with a smoothed two power-law form and the model value at the center of each bin is multiplied by the ratio of the actual number of AGNs in the bin to the model-predicted number[12]. Nominally, corrections for incompleteness due to unidentified X-ray sources have been made by using an effective survey area, derived by multiplying the geometrical survey area by the completeness of the survey (i.e. identified fraction of the detected X-ray sources). This method is valid when sources remain unidentified because of random reasons that are not correlated with the intrinsic properties of the source (e.g. optical magnitude). This is not necessarily true, especially in the deepest surveys. Thus we also calculated the XLF or number density upper bounds, where all the unidentified XMM-Newton and Chandra sources are assigned (in duplicate) the central redshift of each bin. Figure 2 (left) shows the SXLF in different redshift bins (plotted only the nominal incompleteness correction case).
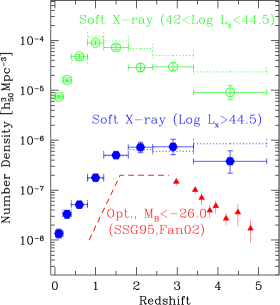
Figure 2 (right) shows the AGN number densities as a function of redshift separately for low and high luminosity AGNs. The incompleteness upper bounds (see above) are shown in dotted lines. Even in the most extreme cases of the incompleteness correction, we see that the number density of the low-luminosity AGNs peaks much later in the history of the universe () than the high-luminosity case. This is in the opposite sense to the prediction from a analytical model based on the hierarchal merging and self-regulated accretion by Wyithe & Loeb [21]. According to their prediction, the number density of more luminous AGNs peak at later in the history of the universe. On the other hand, a prediction from a numerical simulation by Di Matteo et al.[4], where gas density, star formation, and AGN formations are assumed to be related in a certain simple way, is consistent with the observed trend.
For comparison, we overplot the redshift evolution of optically-selected luminous () QSO number density[14, 5]. In the high X-ray luminosity bin, we are not still certain (within the uncertainties in the incompleteness correction) whether we have detected the decline (with ) in the number density at , where the densities of luminous optical [14, 5] and radio[18] QSOs clearly show a drop. Note, however, that when we take a different method on incompleteness correction involving optical magnitude limits with our soft X-ray sample, a density decline at is preferred even for the high-luminosity sample (Hasinger et al. in preparation).
3 The Brightest Hard X-ray Sample
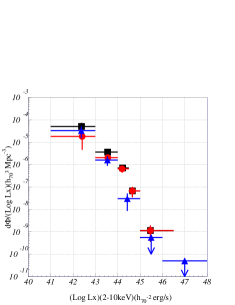
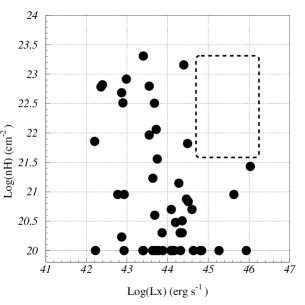
In order to construct the luminosity function of AGNs in the intrinsic X-ray luminosity, X-ray surveys in the hard band ( keV) and X-ray spectroscopic (or at least hardness) information are crucial. In order to complement deeper ASCA, XMM-Newton and Chandra surveys with smaller survey areas, we have defined a bright hard X-ray selected sample from the HEAO-1 all-sky surveys. In addition to the famous Piccinotti et al.[13] sample from the HEAO-1 A2 experiment, we have defined a somewhat deeper hard X-ray flux-limited sample of AGNs from the MC-LASS catalog of X-ray sources from the HEAO-1 A1/A3 experiments 111http://heasarc.gsfc.nasa.gov/docs/heao1/archive/heao1_catalog.html in a limited region. The AGN sample from the latter catalog was investigated in detail by Grossan[7]. As a total, 49 AGNs are defined and we have made spectral analysis of all of them (except one) using ASCA and XMM-Newton observation from archive as well as our own proposals. We have determined the intrinsic absorption and underlying power-law index . This enabled us to construct separate local HXLFs for absorbed and unabsorbed AGNs as functions of de-absorbed (intrinsic) luminosity (Fig. 3, left). We see that the absorbed AGN HXLF drops more rapidly than the unabsorbed one at high luminosities. This can also be demonstrated in the – plot (Fig. 3, right). Suppose absorbed and unabsorbed AGNs had the same HXLF shape, there would be AGNs in the region enclosed by a thick dashed line in this figure. See Shinozaki et al.[19]. Full results will be reported by Shinozaki et al. (in preparation).
Acknowledgments
I thank my collaborators on the projects described in this article, especially Günther Hasinger, Maarten Schmidt, Keisuke Shinozaki, Yoshitaka Ishisaki and Yoshihiro Ueda. I thank the conference organizers for the invitation to give a talk. This work has been supported by the NASA LTSA grant NAG5-10875.
References
- [1] I. Appenzeller et al. A&A, 364, 443 (2000)
- [2] A. Barger et al. AJ, 126, 632 (2003)
- [3] R.G. Bower et al. MNRAS, 281, 59 (1996)
- [4] T. Di Matteo et al. ApJ, 593, 56 (2003)
- [5] X. Fan et al. AJ, 121, 54 (2001)
- [6] I.M. Gioia et al. ApJS, 149, 29 (2003)
- [7] B. Grossan PhD Thesis, MIT (1992)
- [8] V. Mainieri et al. A&A, 393, 425 (2002)
- [9] I.M. McHardy et al. MNRAS, 295, 641 (1998)
- [10] K.O. Mason et al. MNRAS, 311, 456 (2000)
- [11] T. Miyaji, G. Hasinger, M. Schmidt A&A, 353, 25 (2000)
- [12] T. Miyaji, G. Hasinger, M. Schmidt A&A, 369, 49 (2001)
- [13] G. Piccinotti et al. ApJ, 253, 485 (1982)
- [14] M. Schmidt, D.P. Schneider, J. Gunn AJ, 110, 68 (1995)
- [15] M. Schmidt et al. A&A, 329, 495 (1998)
- [16] A. Schwope et al. AN, 321, 1 (2000)
- [17] G.P. Szokoly et al. ApJS submitted (astro-ph/0312324) (2004)
- [18] P.A. Shaver et al. Nature, 384, 439 (1996)
- [19] K. Shinozaki, T. Miyaji, Y. Ishisaki, Y. Ueda et al. in Proceedings of the ”Stellar-Mass, Intermediate-Masss, and Supermassive Black Holes” in press (2004) (astro-ph/0402363)
- [20] Y. Ueda, M. Akiyama, K. Ohta, T. Miyaji ApJ, 598, 886 (2003)
- [21] J.S.B. Wyithe , A. Loeb ApJ, 595, 614 (2003)
- [22] G. Zamorani et al. A&A, 346, 731 (1999)