Dust and gas obscuration in ELAIS Deep X-ray Survey reddened quasars
Abstract
Hard X-ray surveys have uncovered a large population of heavily obscured AGN. They also reveal a population of quasars with moderate obscuration at both visible and X-ray wavelengths. We use Chandra selected samples of quasars from the ELAIS Deep X-ray Survey (EDXS) and the Chandra Deep Field-North to investigate the obscuration towards the nuclei of moderately obscured AGN. We find an inverse correlation between the optical to X-ray flux ratio and the X-ray hardness ratio which can be interpreted as due to obscuration at visible and X-ray wavelengths. We present detailed optical and near-infrared data for a sample of optically-faint () quasars from the EDXS. These are used to constrain the amount of rest-frame UV/optical reddening towards these quasars. It is found that optically-faint quasars are mostly faint due to obscuration, not because they are intrinsically weak. After correcting for reddening, the optical magnitudes of most of these quasars are similar to the brighter quasars at these X-ray fluxes. Combining with gas column densities inferred from the X-ray observations we consider the gas-to-dust ratios of the obscuring matter. We find that the quasars generally have higher gas-to-dust absorption than that seen in the Milky Way – similar to what has been found for nearby Seyfert galaxies. We consider the possible existence of a large population of X-ray sources which have optical properties of Type 1 (unobscured) quasars, but X-ray properties of Type 2 (obscured) quasars. However, we find that such sources only contribute about 6% of the 0.5-8 keV X-ray background. Finally we show that the observed distribution of optical-to-X-ray flux ratios of quasars at is skewed to low values compared to the intrinsic distribution due to the fact that the observed-frame -band light is emitted in the UV and is more easily obscured than hard X-rays.
Subject headings:
galaxies: active – galaxies: emission lines – X-rays: galaxies1. Introduction
The hard spectral shape of the X-ray background led to the idea that a large population of obscured active galactic nuclei (AGN) exist which fail to show up in optically-selected quasar surveys (Comastri et al. 1995). Deep hard X-ray surveys with Chandra and XMM-Newton have now revealed the sources responsible for the 0.5-10 keV X-ray background (e.g. Hornschemeier et al. 2001; Tozzi et al. 2001; Hasinger et al. 2001; Manners et al. 2003). As expected, the majority of the optical counterparts to hard X-ray sources are galaxies containing optically-obscured AGN.
Seyfert galaxies at low redshift often show complex absorption structures consisting of both cold (neutral) and warm (partially ionized) absorbers (Mushotzky, Done & Pounds 1993). A fraction of Seyferts appear to be Compton thick and their observed X-ray emission is reflection dominated. Due to the low signal-to-noise of the X-ray spectra of the sources responsible for the X-ray background, there is only limited knowledge of their absorption properties. It is unknown whether the orientation-based obscuration scheme which works well for low-redshift Seyferts can also be applied at higher redshifts. There are still only a handful of Type 2 narrow-line quasars found in deep X-ray surveys (Almaini et al. 1995; Norman et al. 2002; Stern et al. 2002; Crawford et al. 2002; Mainieri et al. 2002; Szokoly et al. 2004), seemingly at odds with simple unification schemes (however there are still many faint objects without redshifts in these surveys which could be Type 2 quasars). The relative lack of luminous Type 2 quasars and the dominance of obscured AGN at lower luminosities (Ueda et al. 2003; Hasinger et al. 2003) suggests that the fraction of obscured objects is a strong function of luminosity, as had previously been found for low-radio-frequency selected AGN (Simpson, Rawlings & Lacy 1999; Willott et al. 2000). The fraction of Compton thick AGN in the X-ray background sources is also quite uncertain (e.g. Fabian, Wilman & Crawford 2002).
The dust properties of the high redshift X-ray absorbing material have not yet been well studied. There are certainly objects at low redshift with dust absorption quite different from that expected from the observed X-ray absorption based on a Galactic gas-to-dust ratio (Simpson 1998; Maiolini et al. 2001a) and a few cases of such discrepancies at higher redshifts have been reported (Akiyama et al. 2000; Risaliti et al. 2001; Willott et al. 2003; Watanabe et al. 2004). In this paper we discuss the dust and X-ray absorption present in hard X-ray sources contained within the ELAIS Deep X-ray Survey and the implications for understanding the sources responsible for the X-ray background.
In Sec. 2 we discuss the observed correlations between optical and X-ray properties of X-ray selected quasars and what these suggest about obscuration. Sec. 3 presents near-infrared and optical data for optically-faint X-ray selected quasars. In Sec. 4 we fit model quasar spectra to the observations to constrain the reddening towards these quasars. In Sec. 5 we compare the obscuration in the UV/optical with that in X-rays to determine the gas-to-dust ratio of the obscuring material and compare this with values in the Milky Way, the Small Magellanic Cloud and low-redshift AGN. In Sec. 6 we discuss the effect that obscuration plays in altering the intrinsic optical-to-X-ray flux ratios of quasars to those observed. We assume throughout that , and .
2. Optically faint quasars in Chandra surveys
In this paper, we will concentrate on X-ray sources which are associated with unresolved optical counterparts. With the exceptions of a few stars (readily identified by their high optical to X-ray flux ratios) these sources have optical and (usually) near-IR emission which is dominated by the active nucleus. We will commonly refer to these objects as quasars for simplicity, but the reader should bear in mind that the moderate optical and X-ray luminosities place them around the border with Seyfert Type 1s. It may seem strange that we decide to concentrate on quasars when galaxies dominate the hard X-ray background sources. However, quasars likely dominate the high-redshift, moderate-luminosity population (Barger et al. 2002; Hasinger et al. 2003; Steffen et al. 2003) and the presence of optical AGN continuum emission allows a more detailed investigation of the optical obscuration toward the nucleus, unlike the totally optically-obscured X-ray sources associated with galaxies.
The ELAIS Deep X-Ray Survey (EDXS) consists of two 75 ks Chandra pointings in northern ELAIS (European Large Area ISO Survey; Oliver et al. 2000) fields which have detected a total of 233 X-ray sources. Full details of the EDXS are given in Manners et al. (2003) and Gonzalez-Solares et al. (2004). In this paper we only consider sources in the EDXS-N2 region at RA= DEC= (J2000.0), because this region has superior optical imaging (seeing 0.75 arcsec) which allows the separation of unresolved point-sources and extended galaxies (which have typical sizes arcsec) to a magnitude limit of . As we will see below, classification at this magnitude limit is essential for identifying quasars at faint X-ray fluxes.
To increase the number of data points and therefore decrease statistical uncertainties in some of our analyses, we will also use X-ray sources from the Chandra Deep Field-North Survey (CDF-N). The 1Ms Chandra exposure detected 370 point sources (Brandt et al. 2001). Deep optical imaging of this field has been obtained and, crucially for our analyses, optically-compact sources have been identified and flagged ‘C’ for compact (Barger et al. 2002). Sources showing broad emission lines in their optical spectra are flagged ‘B’ and sources both compact and with broad lines ‘BC’. We include as quasars sources flagged as ‘BC’ or ‘C’ and also the four sources flagged ‘B’ at redshifts since the optical luminosities of these suggest they are dominated by an AGN and the fact they were not classified as compact is likely due to the proximity of companions on the images.

2.1. Correlation between optical and X-ray fluxes
Fig. 1 shows the -band magnitude versus X-ray flux for X-ray sources from the EDXS-N2 and CDF-N surveys. Sources are shown as quasars if they are optically-compact in EDXS-N2 or are quasars as defined above in the CDF-N. The vertical line shows a full-band (0.5-8 keV) flux limit of erg cm-2 s-1 which will be adopted for the remainder of this paper. This flux limit was chosen since it is equivalent to a signal-to-noise of for most of the EDXS-N2 Chandra image. We use the full band flux rather than just the hard band (2-8 keV) flux since the energy dependent response of Chandra is such that even moderately hard sources may be detectable in the full band, but not in the hard band. Note that at this flux limit a quasar with an optical to X-ray flux ratio (the ratio between the fluxes in the -band and the 0.5-8 keV band) of 0.1 has – close to the limiting magnitude at which one can separate unresolved from extended sources in ground-based optical imaging.

Fig. 1 shows that the quasars tend to have a fairly small range of optical to X-ray flux ratio as has been demonstrated before (Schmidt et al. 1998). There is some indication that the typical optical to X-ray flux ratio for quasars decreases at faint X-ray fluxes (in the faintest bin on Fig. 1) but this is not statistically significant. However, if there are significant numbers of quasars which we have not identified as such, this difference and its significance could be increased. We will investigate in this paper how this plot of optical and X-ray fluxes is affected by the existence of a sizeable number of partially obscured quasars.
2.2. The X-ray hardness ratio and optical and X-ray fluxes
In order to determine whether obscuration may play a role in the observed optical to X-ray ratios, we now consider the hardness of the X-ray spectra of these sources as defined by (H-S)/(H+S) (where H is the flux in the 2-8 keV band and S is the flux in the 0.5-2 keV band; see Manners et al. 2003 for more details). In the XMM-Newton survey of the Lockman Hole, Mainieri et al. (2002) showed that the full range of hardness values in surveys such as these can be explained by X-ray sources with a constant intrinsic power-law slope of and a range of obscuring columns of . Therefore we will use the observed hardness as an indicator of the gaseous obscuring column since the sources we discuss typically do not have enough counts for detailed spectral analyses. It should be remembered that a range of intrinsic power-law slopes could account for some of the scatter in observed hardness ratios.
Fig. 2 shows the hardness ratio for quasars in the EDXS-N2 and CDF-N surveys plotted against -band magnitude and optical to X-ray flux ratio. The binned data show some evidence that at faint optical magnitudes and at low optical to X-ray flux ratios, the typical hardness values of quasars increases, presumably because the X-ray emission becomes more heavily obscured. To test whether there are significant correlations we perform a Spearman rank correlation analysis. The results show that there is a correlation between -band magnitude and hardness significant at % confidence and between optical to X-ray flux ratio and hardness at %.
| Source | Near-IR position | 0.5-8 keV flux | HR | mag | mag | mag | mag | |
|---|---|---|---|---|---|---|---|---|
| N2_15 | 16:37:04.40 +40:56:24.7 | 1.562 | ||||||
| N2_35aaNo near-infrared spectroscopy was obtained for these sources. Optical spectroscopy is described in Sec. 3.2 | 16:36:49.28 +41:03:23.7 | 2.741 | — | |||||
| N2_47 | 16:36:36.21 +41:05:09.2 | 0.884 | ||||||
| N2_60 | 16:36:19.18 +41:04:36.5 | 1.498 | ||||||
| N2_61 | 16:36:18.23 +41:00:37.4 | 1.390 | ||||||
| N2_64 | 16:36:14.45 +41:03:48.7 | — | ||||||
| N2_68aaNo near-infrared spectroscopy was obtained for these sources. Optical spectroscopy is described in Sec. 3.2 | 16:37:25.33 +41:00:20.2 | 2.218 |
Note. — EDXS-N2 optically-faint quasars with near-infrared or optical spectroscopy presented in this paper. 0.5-8 keV fluxes are in units of erg cm-2 s-1. Hardness ratios are calculated by HR=(H-S)/(H+S). Optical and near-IR magnitudes are measured in a 3 arcsec aperture. N2_35 is not detected at -band but is detected at with . The imaging data are described in González-Solares et al. (2004), Roche et al. (2002) and Ivison et al. (2002).
It is important to realize that the -band magnitude is very strongly anti-correlated with the optical to X-ray flux ratio (%) because most sources lie close to the X-ray flux limit. Hence the appearance of both variables correlating with hardness could be induced by just one of the two being physically related to hardness. To ascertain if this is true, we employ a Spearman partial rank correlation analysis of the correlations present between the three variables. This method (e.g. Macklin 1982) assesses the statistical significance of correlations between the two named variables in the presence of the third. This analysis shows that the correlation between -band magnitude and hardness (independent of correlations with optical to X-ray flux ratio) is only significant at % confidence. However, the correlation between optical to X-ray flux ratio and hardness (independent of correlations with -band magnitude) is statistically significant at % confidence. Therefore we find a significant increase in the X-ray obscuration of quasars at lower optical to X-ray flux ratios. Note that this correlation has the opposite trend from that expected if the optical and X-ray obscuration are completely independent.
This increase in X-ray obscuration of quasars at lower optical to X-ray flux ratios could be explained by an absorbing medium that contains dust and gas. At the typical redshifts of these quasars ( – see Sec. 3), the observed -band flux is probing the rest-frame UV and the observed 0.5-8 keV X-rays originate at harder energies. Therefore the observed -band flux is much more easily depressed than the X-ray flux. This idea will be revisited in a more quantitative way in Sec. 5. First we need to understand how much optical reddening there is in these quasars and then compare with the amount of X-ray absorption.
3. Observations
To understand the properties of quasars with low optical to X-ray flux ratios, we studied all those X-ray sources from the EDXS-N2 which have optically-unresolved counterparts with , full-band fluxes erg cm-2 s-1 and Chandra snr . There are nine quasars obeying these criteria. Fig. 1 shows that almost all these sources are located close to the optical to X-ray flux ratio = 0.1 line. One X-ray source, N2_25111The full IAU name for this source is CXOEN2 J163655.7+405910. We use the abbreviated names of EDXS-N2 sources in this paper. Cross-referencing of the abbreviated and full names can be found in Manners et al. (2003), already has near-infrared and optical spectroscopy presented in Willott et al. (2003) and is found to be a quasar with fairly narrow emission lines (2000 km s-1) subject to reddening of . In contrast to this fairly small amount of reddening, this quasar has a very hard X-ray spectrum indicating an obscuring column of .
3.1. Near-infrared spectroscopy
One source in the sample of nine quasars, N2_35, has a particularly faint near-infrared counterpart () and hence was not targeted since it was unlikely to yield a spectrum with sufficient snr for analysis. The remaining seven quasars apart from N2_25 and N2_35 were the subject of a program of near-infrared spectroscopy with the OH-airglow suppression Spectrograph (OHS; Iwamuro et al. 2001) on Subaru Telescope. The observations were carried out on the nights of UT 2002 May 20-24. Due to time constraints we were only able to observe five of our targets. N2_37 and N2_68 were not observed. Optical spectra of N2_68 and N2_35 have been obtained instead (see Sec. 3.2). The seven quasars which have data presented in this paper are listed in Table 1.
The OHS spectrograph uses a fixed grism giving simultaneous and -band spectra over the wavelength ranges m and m. The seeing was in the range arcsec for all observations and a 0.5 arcsec slit was used giving a resolution of Å (equivalent to km s-1). The total exposure times per object varied from 3200 - 7000 s depending upon their near-IR magnitudes. These integrations were split into nodded frames of typically 1000 s each. Stars of spectral type F were observed immediately after each target to enable correction for atmospheric extinction.
The OHS data were reduced in a broadly standard manner, with extra care being taken to remove detector artifacts due to the faintness of our targets. Wavelength calibration was performed by observing the planetary nebula NGC 7027, while flux calibration and atmospheric extinction corrections were determined using the observations of HIP 80419. Further details can be found in Simpson et al. (2004). Photometric flux-calibration was performed by scaling the reduced spectra by an aperture correction to account for slit losses. This calibration agrees well with the magnitudes from our own near-IR imaging (González-Solares et al. 2004). The snr per resolution element (4 pixels) in -band for all the reduced spectra lie in the range 5 - 7.
3.2. Optical spectroscopy
For two of the three quasars that we could not obtain near-infrared spectra of, we have instead obtained optical spectra. N2_35 was observed with the GMOS spectrograph at the Gemini-North Telescope using nod-and-shuffle multi-object spectroscopy for a total of 3 hours. The data were reduced in a similar manner to as described in Abraham et al. (2004). N2_68 was observed in long-slit mode with the ISIS spectrograph at the William Herschel Telescope in a similar manner to the observations described in Willott et al. (2003). An optical spectrum of N2_64 was also obtained with ISIS after the near-infrared spectrum failed to reveal a redshift.
3.3. Redshifts
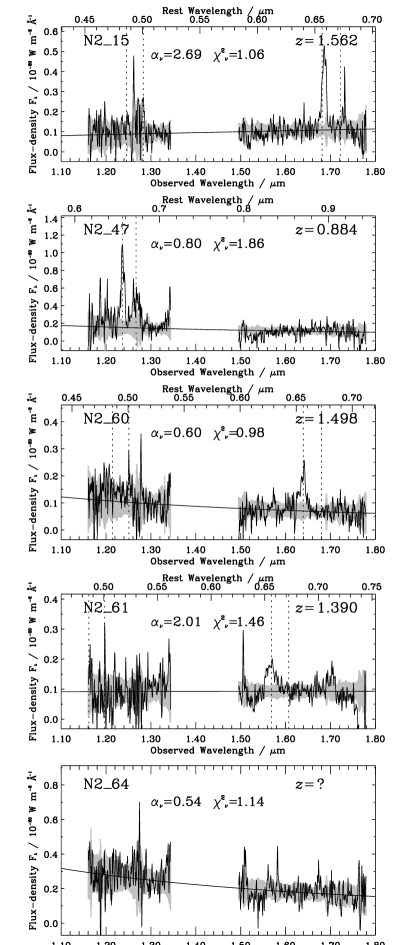
The five OHS near-IR spectra are shown in Fig. 3. Emission lines are detected in four of the five X-ray sources. Two sources (N2_15 and N2_60) have H and [O iii] emission lines detected. The velocity offset of +700 kms-1 from H to [O iii] in N2_15 is quite common in high-redshift quasars (McIntosh et al. 1999). In N2_47 there is one strong emission line which we identify as H and a probable detection of [S ii] at the same redshift. N2_61 has just one secure emission line. We believe this is H due to its high equivalent width and velocity width of km s-1 identifying it as a permitted line. There is a spike in the spectrum at the location of [O iii] for this redshift, but it is not definitely a real feature. N2_64 shows no emission lines in the OHS spectrum.
The optical spectrum of N2_68 showed a blue object with two strong, broad () emission lines. The wavelengths of these lines indicate they are Ly and C iv at a redshift of . A one-dimensional spectrum could only be extracted from the blue-arm data; there was insufficient signal in the red-arm to locate the quasar. The spectrum is shown and used along with photometry in Sec. 4 to constrain the amount of reddening of this quasar.
The optical spectrum of N2_35 has a blue continuum and several emission lines. The strongest emission line at 5790 Å has a deep absorption trough close to its center and what appears to be an absorption trough a few thousand km/s blueward of the peak. Other weak, marginally significant emission lines are visible at 6139 Å and 7142 Å(these look more significant in the 2D spectrum than in the 1D spectrum). The locations of these emission lines gives us a high degree of certainty that the redshift is and that the strongest line is C iv rather than Ly at . The tentative absorption trough blueward of C iv could indicate this to be a broad absorption line quasar. The spectrum is shown and discussed in Sec. 4.
Only N2_64 does not show any reliable emission lines in either its optical or near-IR spectra. The optical spectrum does show weak continuum extending down to 3800 Å without a break, suggesting a redshift of . We note that for redshifts in the ranges or the two strongest lines in the spectra of N2_15, N2_47 and N2_60 would not be observed in the wavelength range covered by the OHS spectra, so these are likely redshift ranges for N2_61. The lack of a Ly emission line in the optical spectrum supports the range, but reddened quasars can have very weak Ly lines due to resonant dust scattering (Charlot & Fall 1991) so the higher range is also possible. We have considered the possibility that N2_64 is a BL Lac object with optical and X-ray fluxes dominated by beamed synchrotron. However, this object is not detected in a very deep 1.4 GHz radio observation (rms Jy; Ivison et al. 2003) which leads us to conclude that it is not a BL Lac.
4. Spectral fitting
Single power-law continuum fits to the OHS spectra were attempted for all five quasars with near-IR spectra. Wavelength regions containing quasar emission lines were masked out and an iterative chi-squared fit was performed. The best-fit power-law slopes, , and the associated reduced chi-squared, , are labelled on Fig. 3. The mean optical spectral index of radio-quiet quasars is (Brotherton et al. 2001). Two of the quasars, N2_15 and N2_61 have very steep spectra with . The other three quasars have , which is slightly steeper than the mean spectral index but within the red tail of the distribution observed in optically-selected samples such as the SDSS (Richards et al. 2003). For N2_15, N2_60 and N2_64 a power-law provides a good description of the continuum shape (). N2_47 has and shows deviations from a power-law, particularly a dip at a rest-frame wavelength of m which is also apparent in the SDSS composite quasar spectrum (Vanden Berk et al. 2001). Although for N2_61 the best fit has , the fitted slope of describes the overall continuum slope well.
Table 1 lists the optical , and and near-infrared magnitudes of these quasars. At the redshifts of these quasars, the observed optical emission is probing the rest-frame ultraviolet. The colors of a typical unreddened quasar would be and . It is clear from this table that the rest-frame UV and UV–optical colors of the quasars we have observed are considerably redder than those of a typical quasar.
The red colors of these quasars can be explained by an intrinsic shape similar to ordinary quasars which is reddened by a foreground screen of dust. There are other possible explanations for red quasars: (i) an optical-synchrotron dominated spectrum (e.g. Francis et al. 2001); (ii) a host galaxy dominated spectrum (e.g. Vanden Berk et al. 2001). We discount the former possibility because optical synchrotron only dominates in powerful radio-loud quasars with flat radio spectra and the latter because our near-infrared observations show that these sources are unresolved in 0.5 arcsec seeing.
To constrain the amount of reddening required to produce these red quasars we have performed a fit to the optical photometry and near-infrared spectroscopy. The fact that our objects are spatially unresolved in both the optical and near-IR means we can use a single component quasar fit. For a typical quasar template we use the composite radio-quiet quasar spectrum from the FIRST Bright Quasar Survey (FBQS; Brotherton et al. 2001). We use this rather than the SDSS composite of Vanden Berk et al. (2001) because the SDSS composite shows a break at Å where contamination by host galaxy light becomes important. In contrast, the FBQS radio-quiet quasar composite spectrum shows a constant power-law from the UV right out to 6000 Å. We extend the composite redward of 6000 Å by continuing the power-law slope of . We do not add in emission lines such as H , since we will only be using the line-free regions of the quasar spectrum for continuum fitting. The composite quasar spectrum is then subjected to a variable amount of dust reddening and an iterative routine determines the best-fit amount of reddening. The routine allows for reddening with three different extinction laws: that of our galaxy, the LMC and the SMC, adopting the parametric extinction laws of Pei et al. (1992).
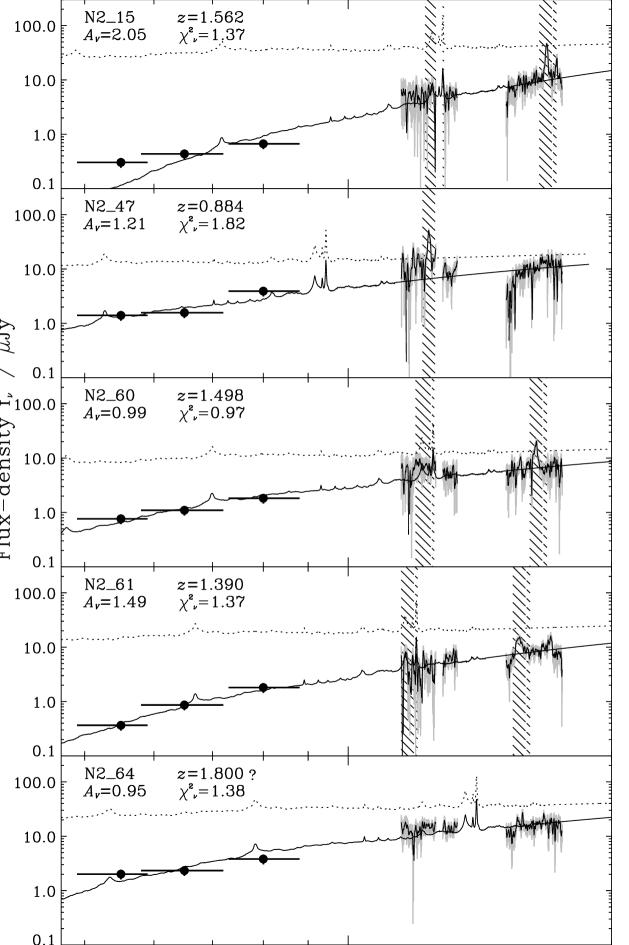
The optical photometry and near-infrared spectroscopy for these five quasars are shown in Fig. 4. Also plotted are the results of the reddened quasar fitting process - both the reddened spectrum and the original unreddened spectrum. This illustrates that none of the five quasars have optical and near-infrared spectra similar to the unreddened quasar template. It also shows that the observed flux in the optical has been heavily affected by absorption (by factors of ). Although the fitting was performed for three different extinction laws, only the SMC extinction law is shown in this plot. The values for the different extinction laws varied by % for most objects (the main exception being N2_15 where a Galactic extinction law fits the optical photometry much better and has a ). The best-fit values are systematically higher for LMC (120% of SMC) and Galactic (130% of SMC) type dust because of their lower ratios of UV to optical absorption. With the limited data available we are not able to draw any firm conclusions on which dust extinction law provides the best fit to these reddened quasars.


For N2_68, we do not have near-IR spectroscopy but we do have an optical spectrum from the blue-arm of ISIS at the WHT and optical () and near-IR () photometry. The snr in the optical photometry is sufficient to tell that the source is spatially unresolved. However, the source is faint in the near-IR (, , ) and it is not possible to tell if the near-IR emission is resolved or not. A passively evolving galaxy formed in an instantaneous starburst at has at the redshift of N2_68, so it is certainly possible that the near-IR fluxes are dominated by extended, host galaxy emission. In Fig. 5 we show the optical spectrum and photometry data for N2_68. We have performed reddened quasar fitting to these data in a manner similar to described previously for the other EDXS quasars. We find there is relatively little reddening for N2_68 ( for an SMC extinction law and for a Milky Way law). If the near-IR fluxes are dominated by the host galaxy, then the data are consistent with an unreddened quasar.
N2_35 does not have near-IR spectroscopy but does have an optical spectrum described in Sec. 3.3 and shown in Fig. 6. This spectrum is used to fit the same range of reddened quasar models as detailed above. N2_35 is very faint in the near-IR and is undetected at the and bands. It is detected at -band with and is clearly resolved in that image (0.6 arcsec seeing). As mentioned in the preceding paragraph, this magnitude is consistent with that of a quasar host galaxy at this redshift. Therefore the -band photometry was not included in the quasar fitting algorithm. The optical spectrum appears to show no reddening. Note that the quasar -band magnitude predicted by this fit is which explains why the host galaxy outshines the quasar at .
5. Comparison of X-ray and optical absorption

For eight of the nine quasars in our optical magnitude limited EDXS-N2 sample, we have constrained the amount of reddening of the optical quasar emission. The optical dust reddening is calculated from the fitted values assuming the standard values of (Galactic) or (SMC). We can determine the gaseous X-ray absorbing column by using the observed Chandra hardness ratio and assuming an intrinsic power-law with as found by Mainieri et al. (2002). X-ray absorption in the hard, soft and full bands is determined following the prescription of Morrison and McCammon (1983).
Fig. 7 plots the optical reddening due to dust against the absorbing column due to gas for these quasars. The left panel shows the results of fits with Galactic dust and the right panel is for SMC dust. Also shown are curves for a Galactic gas-to-dust ratio (; Bohlin et al. 1978) and a SMC gas-to-dust ratio (; Bouchet et al. 1985). The factor of 10 difference between these is attributed to the lower metallicity in the SMC meaning less metals available for dust formation.
The EDXS quasars tend to have higher gas-to-dust absorption ratios than Galactic, although some of them are quite close to the curve and do not show a statistically significant deviation from the Galactic value. In contrast, the quasars are evenly distributed around the SMC gas-to-dust ratio. Note that sources with are not likely to be in our sample because their rest-frame UV emission may be too highly obscured for them to pass the magnitude limit and/or the host galaxy may dominate giving an extended appearance. Similarly, there are many quasars with which have and were therefore not followed up in this paper (Pérez-Fournon et al. 2004). So this diagram should be interpreted as the gas column densities of a nearly complete sample of lightly reddened quasars.
The discovery of N2_25 with a gas-to-dust absorption ratio 100 times Galactic (Willott et al. 2003) along with other reports of high gas-to-dust ratio in the literature were the motivation for this study. The only other quasar with such an extreme ratio is N2_35. This quasar appears to be completely unobscured in the optical, but has a very hard X-ray spectrum. The optical spectrum shows hints that this is a broad absorption line quasar - these quasars are known to have hard X-ray spectra due to a large column density (Gallagher et al. 2002), but comparatively little optical reddening (Reichard et al. 2003). Apart from these two quasars with extreme gas-to-dust absorption ratios, a ratio in the range 1-10 times Galactic is typical of the rest of the sample.
Maiolino et al. (2001a) compared the gas and dust absorption properties of a sample of nearby Seyfert galaxies and found that they typically have higher ratios than Galactic. The data from this study are also plotted on Fig. 7. The Seyferts and EDXS quasars tend to occupy similar locations on this plot, suggesting that higher gas-to-dust absorption ratios in AGN are not a strong function of luminosity and/or redshift. One should note that the particular selection criteria used by Maiolino et al. (2001a) for their Seyfert sample almost inevitably led to the sample being dominated by objects with high gas-to-dust absorption ratios and the effect of any such biases should become clearer with a volume-limited Seyfert sample being studied with XMM-Newton (Cappi et al. 2003).
The similarity of the gas-to-dust ratios in AGN and the SMC is not easily explained. In the case of the SMC, the gas-to-dust ratio is about 10 times higher than that of the galaxy because its metallicity is about 10 times lower (Bouchet et al. 1985). In the case of AGN, super-solar metallicities are common in the circumnuclear region (Hamann & Ferland 1999). In any case, metallicity effects are not so important when the gas absorbing column density comes from an X-ray measurement (Maiolino et al. 2001b). This is because the measured X-ray absorption is due to photoelectric absorption by metals, so the derived gas density is proportional to the metallicity. Given the quite different physical conditions in AGN environments and in the SMC, the similarity of these gas-to-dust ratios is likely just a coincidence.
There are three basic ways to interpret the higher gas-to-dust absorption ratios in the AGN environment as compared to the Milky Way: (i) the dust grain composition is different so dust is less effective at absorbing UV radiation; (ii) the majority of the X-ray absorption occurs close to the ionizing radiation source, within the dust sublimation radius; (iii) the ratio of gas to dust is higher than in our galaxy. These possibilities are discussed in more detail in Maiolino et al. (2001a; 2001b) and work still needs to be done to determine which effect is dominant.
We now return to the issue of the effect that obscuration has on the observed optical to X-ray flux ratio. The lower panel of Fig. 2 and the statistics presented in Sec. 2.2 showed that as the X-ray emission from quasars gets more heavily obscured, the ratio of optical to X-ray flux decreases. Can this obscuration be simply explained by an absorber composed of dust and gas? To test this we have simulated the effects of gas and dust on the optical and X-ray flux of quasars at various redshifts. The intrinsic X-ray slope of the quasars are modeled with a power-law. The same procedure as detailed above was used to relate , and the amount of full-band X-ray absorption. The optical absorption in the observed frame -band was calculated by assuming the relevant extinction curve of Pei et al. (1992). Again, we consider both the Milky Way and SMC extinction laws and their gas-to-dust ratios. We now replot the data from Fig. 2 on Fig. 8 adding in curves which show how the optical to X-ray flux ratio and hardness change as one increases the column of absorbing material. We plot Galactic and SMC curves for four different redshifts. Since the optical flux is much more readily depressed than the full band X-ray flux for typical gas-to-dust ratios, the optical to X-ray flux ratio decreases as the absorbing column is increased (except for small columns at for the SMC). The strong redshift dependence of these curves is due to the fact that the k-corrections for obscured AGN in the optical/UV and X-rays have opposite trends.

Fig. 8 shows that if the quasars were to lie mostly in the redshift range then their range of hardness ratio and optical to X-ray ratio could be explained by a small intrinsic scatter coupled with absorption by gas and dust with Galactic properties. However, very few of these quasars lie at such low redshifts and spectroscopy (Sec. 3; Barger et al. 2002) shows that most of them lie within the redshift range . At these redshifts, simple Galactic gas and dust obscuration cannot simultaneously explain the hardness ratios and optical to X-ray ratios. In comparison, the curves for the SMC provide a much better match to the data. This is mostly due to the 10 times higher gas-to-dust ratio and not differences in the dust extinction laws.
In Willott et al. (2003) we speculated that if there are a large fraction of AGN which are Type 1 in the optical (i.e. broad permitted lines) and Type 2 in the X-ray (hard X-ray spectrum due to absorption) then they could be a major contributor to the hard X-ray background. This would lessen the need for optically-obscured sources to dominate the hard X-ray background. We can obtain an estimate of the contribution of such sources to the X-ray background from the number of sources with unresolved optical counterparts and high hardness ratios. From consideration of the hardness ratios and Fig. 7 we specify sources with HR as hard enough to be Type 2 in the X-ray. This corresponds to an absorption column density of at assuming an intrinsic power-law. In the EDXS-N2 region there are four sources (N2_15, N2_25, N2_35 and N2_37) with HR and optically-unresolved. This is out of a parent sample of 61 sources above the flux-limit of erg cm-2 s-1 and with snr , giving 6% of the sample. A similar analysis in the CDF-N also finds that 6% of the sample have HR and are optically-unresolved. Since the sources in these samples are in the flux range which dominates the hard X-ray background (50-64% of the 2-8 keV background is resolved by the EDXS; Manners et al. 2003) we conclude that only about 6% of the sources responsible for the 2-8 keV X-ray background appear as Type 1 in the optical and Type 2 in the X-ray.
6. Effect of obscuration on observed optical to X-ray ratio

Having shown that obscuration plays an important role in the observed properties of Type 1 AGN, we now revisit the effect this may have on the observed optical to X-ray ratio. Given the fact that at the redshifts where most quasars are observed () the optical to X-ray ratio is so strongly dependent upon the obscuration, this may skew the observed distribution of optical to X-ray ratios away from their intrinsic values.
Fig. 9 plots optical magnitude against full-band X-ray flux for quasars from the EDXS-N2 and CDF-N surveys. For eight of the nine EDXS-N2 quasars with observed magnitudes we have determined the optical reddening and X-ray absorption. We use here the reddening values determined with the SMC extinction law, but note that the values are very similar with the Milky Way law. Plotted on Fig. 9 are arrows showing the locations of these quasars once they have been deabsorbed in the optical and X-ray. The effect of absorption is quite dramatic, particularly at optical wavelengths. This illustrates that these quasars which are observed to be optically-faint are mostly not intrinsically optically-faint. The main exception is N2_35 which does not show any optical absorption, but is heavily obscured in the X-rays and hence deabsorbing it actually decreases the optical to X-ray flux ratio

To determine how big an effect this has on the whole population of quasars, in Fig. 10 we show a histogram of the optical to X-ray flux ratio for all the EDXS-N2 quasars with 0.5-8 keV fluxes erg cm-2 s-1. The upper panel shows the observed optical to X-ray flux ratios. The lower panel shows the intrinsic ratios for the sources shown with deabsorbing arrows in Fig. 9. Note that the absorption-corrected histogram could be incomplete for two reasons. Firstly, there may be quasars with and low values of optical-to-X-ray flux ratio that are not identified as such due to the limited depth and resolution of the optical imaging. Secondly, some of the quasars with will be subject to obscuration and correcting for this would likely shift their optical-to-X-ray flux ratios to higher values. Despite these incompletenesses, this plot clearly shows that the typical intrinsic value of the optical to X-ray flux ratio is greater in all but one case (N2_35 – the possible broad absorption line quasar) than one would think from looking at the raw data.
The ratio of optical and X-ray flux is often expressed in terms of the optical to X-ray spectral index, , where
| (1) |
The distribution for bright, low-redshift optically-selected quasars comprises a roughly Gaussian distribution with a peak at and a tail of about 10% of the quasars at (Brandt, Laor & Wills 2000; Vignali et al. 2003). The existence of broad or associated absorption lines in most of these quasars suggests that soft X-ray absorption is the reason for the higher optical to X-ray flux ratios in these quasars. Anderson et al. (2003) have recently confirmed that there is a weak anti-correlation between optical luminosity and and showed that for moderate luminosity X-ray selected quasars a typical value of is .
Two of the quasars in the EDXS-N2 sample (N2_25 and N2_35) are absorbed by columns greater than . For these quasars, the rest-frame 2 keV is below the photo-electric cut-off leading to almost total absorption of the 2 keV flux. The calculated observed for these quasars assuming an X-ray spectrum with absorption columns implied by the hardness ratios are , respectively. Applying corrections for the obscuration in the X-rays and optical (for N2_25 only, since N2_35 is optically-unobscured) leads to intrinsic values of , respectively. The quasar N2_68 which shows little or no reddening or X-ray absorption has .
For the other five EDXS-N2 quasars discussed in this paper the observed optical to X-ray spectral indices lie in the small range . After corrections for optical and X-ray absorption these spectral indices all get steeper and lie in the range which is typical of lower redshift quasars with similar optical luminosities (Anderson et al. 2003). This is interesting because the behaviour for high-redshift, X-ray-selected quasars contrasts with that for low-redshift, optically-selected quasars. In the optically-selected sample the obscuration is strongest at X-ray energies, since strong reddening of the optical continuum would push the optical magnitude above the magnitude limit. In the X-ray-selected sample the obscuration is strongest in the (observed-frame) optical. Note that the faint optical and X-ray flux limits in our survey are such that a much more representative range of absorbed quasars are present than in samples with brighter flux limits.
Risaliti et al. (2001) showed that optical emission line selected quasars tend to have steeper than optical color selected quasars. They interpret this as due to a larger amount of X-ray absorption in the slightly reddened quasars and suggest this shows that a large population of quasars exist which are Type 1 in the optical and Type 2 in the X-rays. This behaviour is seen for N2_25 and N2_35 but not for the rest of our sample. As discussed in Sec. 5 we find that such quasars can only contribute a small fraction of the X-ray background. The differences between our findings and those of Risaliti et al. are likely due to two issues: (i) their definition of the X-ray flux was based on soft X-rays (ROSAT PSPC counts) which are more readily absorbed than the Chandra full-band flux; (ii) their emission line selected quasars have a very bright optical magnitude limit unlike ours which are X-ray selected with faint optical magnitudes.
Under the assumption that most of the optically-bright () EDXS-N2 quasars have little or no reddening, then their intrinsic values are similar to the absorption-corrected values we have found. Thus the intrinsic spread in is much narrower than the observed range. This is very important for constraining the optical and X-ray radiation production mechanisms. Since the EDXS-N2 sample does not yet have complete redshift and reddening information, an examination of the intrinsic spread in is beyond the scope of this current paper, but is clearly an important goal for the future.
7. Conclusions
Deep X-ray surveys are capable of uncovering the AGN responsible for most of the supermassive black hole accretion history of the universe. Combined X-ray and optical/near-infrared observations of lightly reddened quasars from such X-ray surveys are a powerful probe of the physical conditions of the obscuring material. We have used optical and near-infrared photometry and spectroscopy to constrain the amount of reddening in the light from optically-faint quasars. Our main conclusions are:
-
•
Optically-faint () quasars at erg cm-2 s-1 are mostly faint due to obscuration. De-reddening the observed -band fluxes of these quasars gives them optical magnitudes similar to other quasars with these X-ray fluxes ().
-
•
Assuming that most of the spread in X-ray hardness ratios is due to absorption by gas, we find that gas-to-dust ratios in reddened X-ray selected quasars are typically a few times greater than the gas-to-dust ratio in the Milky Way and similar to those in Seyfert galaxies.
-
•
The fraction of quasars responsible for the X-ray background which are Type 1 in the optical (broad permitted lines) and Type 2 in the X-ray (hard X-ray spectrum due to absorption) is only about 6%.
-
•
The observed distribution of optical-to-X-ray flux ratios of quasars at is skewed to low values compared to the intrinsic distribution due to the fact that the observed-frame -band light is emitted in the UV and is more easily obscured than the hard X-rays sampled by Chandra.
References
- (1) Abraham, R. G., et al. 2004, AJ, in press, astro-ph/0402436
- (2) Akiyama, M., et al. 2000, ApJ, 532, 700
- (3) Almaini, O., Boyle, B. J., Griffiths, R. E., Shanks, T., Stewart, G. C., Georgantopoulos, I. 1995, MNRAS, 277L, 31
- (4) Anderson, S. F., et al. 2003, AJ, 126, 2209
- (5) Barger, A. J., et al. 2002, AJ, 124, 1839
- (6) Bohlin, R. C., Savage, B. D., Drake, J. F. 1978, ApJ, 224, 132
- (7) Bouchet, P., Lequeux, J., Maurice, E., Prevot, L., Prevot-Burnichon, M. L., 1985, A&A, 149, 330
- (8) Brandt, W. N., Laor, A., Wills, B. J. 2000, ApJ, 528, 637
- (9) Brandt, W. N., et al. 2001, AJ, 122, 2810
- (10) Brotherton, M. S., Tran, H. D., Becker, R. H., Gregg, M. D., Laurent-Muehleisen, S. A., White, R. L., 2001, ApJ, 546, 775
- (11) Cappi, M., et al. 2003, Carnegie Observatories Astrophysics Series, Vol. 1: Coevolution of Black Holes and Galaxies, ed. L. C. Ho (Pasadena: Carnegie Observatories)
- (12) Charlot, S., Fall, S. M. 1991, ApJ, 378, 471
- (13) Comastri, A., Setti, G., Zamorani, G., Hasinger, G. 1995, A&A, 296, 1
- (14) Crawford, C. S., Gandhi, P., Fabian, A. C., Wilman, R. J., Johnstone, R. M., Barger, A. J., Cowie, L. L. 2002, MNRAS, 333, 809
- (15) Fabian, A. C., Wilman, R. J., Crawford, C. S. 2002, MNRAS, 329L, 18
- (16) Francis, P. J., Drake, C. L., Whiting, M. T., Drinkwater, M. J., Webster, R. L. 2001, PASA, 18, 221
- (17) Gallagher, S. C., Brandt, W. N., Chartas, G., Garmire, G. P. 2002, ApJ, 567, 37
- (18) González-Solares, E. A., et al. 2004, in preparation
- (19) Hamann, F., Ferland, G., 1999, ARA&A, 37, 487
- (20) Hasinger, G., et al. 2001, A&A, 365L, 45
- (21) Hasinger, G., et al. 2003, AIP Conf.Proc., ed. S. Holt and C. Reynolds, 666, 227
- (22) Hornschemeier, A. E., et al. 2001, ApJ, 554, 742
- (23) Ivison, R. J., et al. 2002, MNRAS, 337, 1
- (24) Iwamuro, F., Motohara, K., Maihara, T., Hata, R., Harashima, T. 2001, PASJ, 53, 355
- (25) Macklin, J. T. 1982, MNRAS, 199, 1119
- (26) Maiolino, R., Marconi, A., Salvati, M., Risaliti, G., Severgnini, P., Oliva, E., La Franca, F., Vanzi, L. 2001a, A&A, 365, 28
- (27) Maiolino, R., Marconi, A., Oliva, E. 2001b, A&A, 365, 37
- (28) Mainieri, V., Bergeron, J., Hasinger, G., Lehmann, I., Rosati, P., Schmidt, M., Szokoly, G., Della Ceca, R. 2002, A&A, 393, 425
- (29) Manners, J. C., et al. 2003, MNRAS, 343, 293
- (30) McIntosh, D. H., Rix, H. -W., Rieke, M. J., Foltz, C. B. 1999, ApJ, 517L, 73
- (31) Morrison, R., McCammon, D. 1983, ApJ, 270, 119
- (32) Mushotzky, R. F., Done, C., Pounds, K. A. 1993, ARA&A, 31, 717
- (33) Norman, C., et al. 2002, ApJ, 571, 218
- (34) Oliver, S., et al. 2000, MNRAS, 316, 749
- (35) Pei, Y. C. 1992, ApJ, 395, 130
- (36) Pérez-Fournon I., et al. 2004, in preparation
- (37) Reichard, T. A., et al. 2003, AJ, 126, 2594
- (38) Richards, G. T., et al. 2003, AJ, 126, 1131
- (39) Risaliti, G., Marconi, A., Maiolino, R., Salvati, M., Severgnini, P. 2001, A&A, 371, 37
- (40) Roche, N. D., Almaini, O., Dunlop, J. S., Ivison, R. J., Willott, C. J. 2002, MNRAS, 337, 1282
- (41) Schmidt, M., et al. 1998, A&A, 329, 495
- (42) Simpson C., 1998, ApJ, 509, 653
- (43) Simpson C., Rawlings S., Lacy M., 1999, MNRAS, 306, 828
- (44) Simpson C., Dunlop J. S., Eales S. A., Ivison R. J., Scott S. E., Lilly S. J., Webb T. M. A., 2004, MNRAS, submitted
- (45) Steffen, A. T., Barger, A. J., Cowie, L. L., Mushotzky, R. F., Yang, Y. 2003, ApJL, 596L, 23
- (46) Stern, D., et al. 2002, ApJ, 568, 71
- (47) Szokoly, G. P., et al. 2004, ApJS, submitted, astro-ph/0312324
- (48) Vanden Berk, D. E., et al. 2001, AJ, 122, 549
- (49) Vignali, C., et al. 2003, AJ, 125, 2876
- (50) Watanabe, C., Ohta, K., Akiyama, M., Ueda, Y. 2004, ApJ, in press, astro-ph/0402520
- (51) Willott C.J., Rawlings S., Blundell K.M., Lacy M. 2000, MNRAS, 316, 449
- (52) Willott, C. J., et al. 2003, MNRAS, 339, 397