High Resolution H I Observations of the Galaxy NGC 404: a dwarf S0 with abundant Interstellar Gas
Abstract
As part of a detailed study of the gas content in a sample of Early-Type galaxies, we present 21 cm H I line maps of the S0 galaxy NGC 404, at a spatial resolution of and a velocity resolution of . The H I has been traced out to a radius R or 48 disc scale-lengths, making it one of the largest H I extents reported ( or 12.6 kpc at the assumed distance of 3.3 Mpc). Approximately 75% of the H I resides in a doughnut which is seen close to face–on with inner and outer radii of and . The optical galaxy fits snugly within the hole of the doughnut. The remaining 25% of the neutral gas is found in an annulus concentric with the doughnut and with a somewhat larger ellipticity, extending from a radius of to . A total H I mass of is found, which implies an in solar units. We argue that most if not all of this gas is of external origin, most likely due to the merger of a dwarf irregular galaxy with mag.
The velocity field shows a steeply declining observed rotation curve, compatible with Keplerian decline. However, because the galaxy is close to face–on there is a degeneracy in the determination of the intrinsic rotation curve and inclination. We therefore analysed two extreme cases, producing tilted–ring model fits forcing either a Keplerian or a Flat rotation curve through the observations; both approaches result in equally plausible fits. In both model fits, the position angle of the kinematical major axis of the annulus is distinct from that of the doughnut and ranges from to (for the doughnut these values are to ).
Assuming a distance of 3.3 Mpc, a total mass of is found on the basis of the Keplerian rotation curve. This implies a global ratio of in solar units which is high and likely a reflection of the low blue luminosity of the galaxy ( times lower than the average S0 luminosity). Values for a Flat rotation curve are a factor of 4 higher.
1 Introduction
Traditionally, S0 galaxies were thought to represent a transition between elliptical (E) and spiral (S) galaxies. They share with the latter a central bulge and an exponential disc, and with the former the lack of spiral structure or arms. They are considered inert objects with very little gas, composed almost exclusively of Population II type stars, and virtually a total absence of on–going star formation. This picture has changed considerably over the past 20 years thanks mainly to tremendous progress in observational techniques which are now routinely delivering high sensitivity data over a wide range of wavelengths.
The interstellar medium of early–type galaxies, and especially that of S0s, has attracted a great deal of interest ever since Faber & Gallagher (1976) showed that a considerable amount of mass ejected by evolved stars could pile up over the lifetime of the galaxy. Surprisingly, though, high resolution, sensitive H I observations demonstrated that in general hardly any gas is detected and that most of it seems to have been accreted (van Gorkom et al. 1986; Wiklind & Henkel 1990). The scarcity of material detected in H I, Hα, CO, and at FIR wavelengths and the origin of that material form two puzzles of contemporary astronomy.
Faber & Gallagher (1976) discuss several ways in which gas could have been expelled or eliminated from early–type systems. They reach the conclusion that gas is particularly hard to remove from these systems via star formation. Although star formation has virtually ceased, there are indications that some star formation is taking place in S0s, as based on IRAS observations (Jura 1986; Knapp et al. 1984) and CO observations (Wiklind & Henkel 1989; Sage 1990) which show that some S0s rival spirals in their CO content, but that the molecular gas is concentrated within 1–2 kpc from the centre.
We have started a project, mapping a few early–type galaxies in detail, in order to shed light on the origin of the ISM in these objects. In this paper we present the results obtained for one of the galaxies under study, NGC 404.
NGC 404 is a typical example of an early–type galaxy which shows more activity than expected from such systems. It contains an appreciable amount of atomic (Baars & Wendker, 1976) and molecular gas (Wiklind & Henkel, 1990), a prominent, semicircular dust lane encircling the nucleus (Barbon, Capaccioli & Rampazzo, 1982) and various bright UV point sources (Maoz et al., 1998). It was classified a LINER by Schmidt et al. (1990). Morgan (1958) classified this galaxy as Epec, because of the dust lane. Humason, Mayall & Sandage (1956) and Sandage (1961) classified it as an S03. Based on photographic surface photometry, Barbon et al. (1982) show that the object consists of bulge, lens, and exponential disc components, characteristic of a lenticular galaxy. This easily rules out a classification as (dwarf) elliptical, as several authors have proposed.
For many years the distance to NGC 404 was basically an unknown quantity. Estimates ranged from 1.5 Mpc (Baars & Wendker, 1976) to 10 Mpc (Wiklind & Henkel, 1990). It is only recently that a firm distance to this object has been established. Tonry et al. (2001) used the surface brightness fluctuation method to come up with a distance of 3.3 Mpc. This was confirmed independently by Karachentsev et al. (2002) who used the tip of the red giant branch and determined a distance of Mpc.
Although NGC 404 is listed as a member of the loose group LGG 011 (García, 1993), it is unlikely to be physically associated with the rest of the group as at 3.3 Mpc (Tonry et al., 2001) the nearest member, NGC 598 (M 33), is located at 2.6 Mpc. Rather, NGC 404 is likely the nearest isolated S0 galaxy, especially as there are no other known galaxies within 1.1 Mpc of it (Karachentsev et al., 2002). It is interesting to note that the field is only two degrees away from the centre of the Piscis cluster of galaxies (). A summary of optical data on NGC 404 is given in Table 1.
2 Observations
NGC 404 was observed with the NRAO Very Large Array (VLA)111The National Radio Astronomy Observatory (NRAO) is operated by Associated Universities, Inc., under contract with the National Science Foundation (NSF). on 1996 April 1 (C–array) and 1996 July 16 (D–array) in the 21 cm line of neutral hydrogen (H I). In C–array (with baselines between 100 and 3000 m, or 0.5 to 15 k) the object was observed for 132 minutes; in D–array (with baselines between 20 and 1000 m or 0.1 to 5 k) it was observed for 54 minutes. The absolute flux calibration was determined by observing 3C 48, which was assigned a flux density of 15.99 Jy. This calibrator was also used to derive the complex bandpass correction. A nearby calibrator (0116+319) was used as secondary amplitude and phase calibrator, and its flux was determined to be Jy. Details about the observations can be found in Table 2. The data were edited and calibrated separately for each array with the AIPS package222The Astronomical Image Processing System (AIPS) has been developed by the NRAO using standard reduction techniques.
The systemic velocity of NGC 404 is at a Galactic latitude of , hence some of the channels were confused with Galactic emission (in particular between and ). Since Galactic emission shows its presence on predominantly large scales, we were able to remove the most prominent emission features by blanking the uv data out to in these channels (this affects only D–array).
The uv data were examined and bad data points caused by either interference or cross talk between antennae were removed, after which the data were calibrated. We Fourier–transformed our C– and D–configuration observations separately to assess their quality. Finally, we combined both data cubes to form a single dataset which was used for further analysis. The original bandwidth of the data was 1.56 MHz; for the rest of this paper we use a 0.69 MHz wide bandwidth around the spectral region of interest. The data have a velocity resolution, after on–line Hanning smoothing, of 12.2 kHz ().
Channels with velocities higher than and lower than were determined to be line–free. A total of 20 channels on either side of the main profile containing no line emission were averaged to form a “dirty” continuum image, again avoiding the edge channels of the bandpass. The average continuum level was subtracted from the uv data.
3 H I spectral channel maps
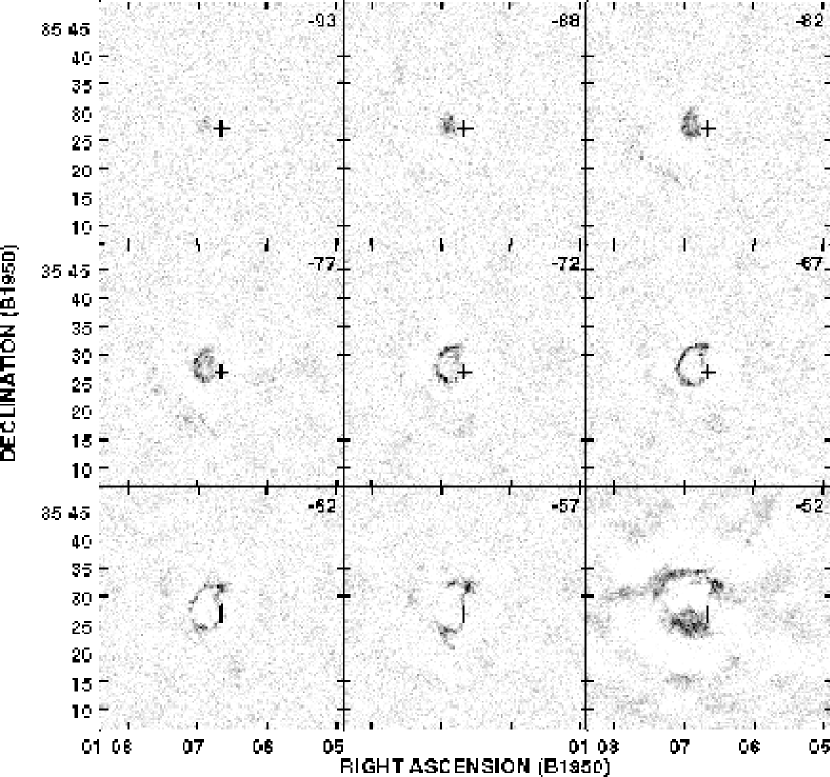
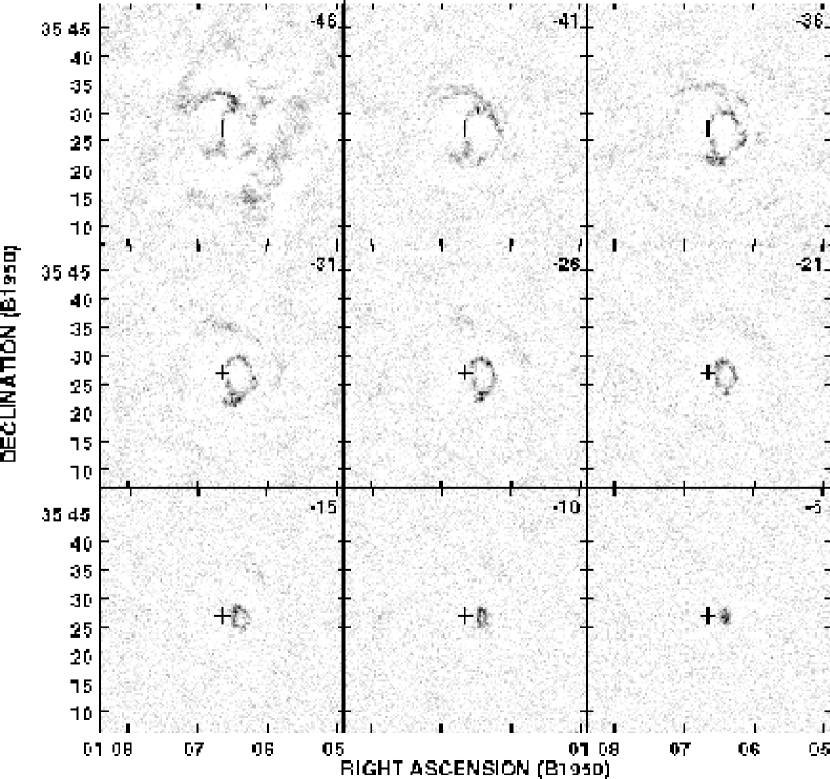
High () resolution cubes were obtained using the task imagr with the parameter robust=–1 (where robust=–5 corresponds to uniform weighting and robust= 5 to natural weighting). With this value we obtain the best compromise between the smallest beam (almost identical to ‘uniform’) and the lowest noise (almost identical to ‘natural’). Cleaning was applied down to a flux level of 2 times the average rms noise in the maps and in an area large enough to include all the prominent emission. Fig. 1 shows the resulting channel maps (before blanking). Notice that most traces of contamination by Galactic emission have been successfully removed. To save space, we display the average of two consecutive channels in each panel over the velocity range where line emission is present. The heliocentric radial velocities (in ) are plotted in the upper right–hand corner of each panel. The beam size () is indicated in the top left–hand panel, left bottom corner (the beam size is so small that it cannot be properly reproduced in our maps). Already at first glance we can see quite strong emission (for an S0 galaxy). The resulting high resolution cubes ( pixels channels at ) were smoothed to a spatial resolution of (HPBW) in order to bring out the faint, extended structures (referred to henceforth as low resolution cubes). Table 3 lists the characteristics of the resulting data cubes.
4 Global H I content
The global H I profile was obtained by integration over the individual high resolution channel maps (note that this can be safely done as all continuum emission was subtracted in the uv plane). Before the summation, the flux at each position was corrected for attenuation by the primary beam of the array. The resulting global profile is shown in Fig. 2. From the global profile we derive a total H I flux of , a systemic velocity of and a global H I velocity profile width at 20% and 50% of the maximum of 85 and 65 (not corrected for inclination, instrumental resolution, turbulent or direction gas motion; the error is of order one channel width or ).
In order to derive the correct H I flux in each of the channel maps, one has to keep in mind that the determination of H I fluxes of extended emission in interferometric maps is not straightforward. As explained by Jörsäter & van Moorsel (1995), fully cleaned maps do not exist, and any cleaned map consists of the sum of two maps: one containing the restored clean components and the other, the residual map. In the former, the unit is Jansky per clean beam area, and in the latter Jansky per dirty beam area. Following Walter & Brinks (1999), we used our cleaned data cube of NGC 404 in order to calculate the real flux of our channels. We calculate this real flux (G) using G=(DC)/(DR), where C is the cleaned flux, and R and D are the “erroneous” residual flux and the “erroneous” dirty flux over the same area of the channel map, respectively. For a full discussion on this topic, the reader is referred to the appendix in Jörsäter & van Moorsel (1995). We followed this procedure for a selected sample of channels, and compared the results with our estimates for the real flux which were obtained by a direct, deep clean. The agreement is to within a few percent, indicating that using our cleaned maps we get values which are very close to the real flux.
Our integrated H I flux is in fair agreement with that estimated by Baars & Wendker (1976) using the Effelsberg 100–m telescope who arrived at a value of . It should be noted, however, that the latter value was reported as being highly uncertain due to contamination of the single dish spectra by foreground emission from the Galaxy and could be off by up to 25%.
Using :
| (1) |
we find a total H I mass of , which is an order of magnitude less than the mean mass found by van Driel & van Woerden (1991, and references therein) for their sample of S0 galaxies. The mean H I mass for 14 S0 galaxies is , using H. The H I mass–to–blue luminosity ratio, , which is independent of distance, on the other hand is high for an S0 galaxy, and much closer to that found for later type spirals (Roberts & Haynes, 1994).
A quick calculation shows that NGC 404 is underluminous for an S0 galaxy, as indicated by the Tully–Fisher (1977) relation for this object. Correcting the global profile measured at the 20% level for instrumental broadening and for turbulent and direction motions by (following Richter & Huchtmeier 1984) and assuming an inclination of (the value that we have found for the inner part of the disc) we estimate a peak to peak velocity for gas in the disc of or a circular velocity of . The required luminosity in order to have NGC 404 fall on the Tully–Fisher curve is more than an order of magnitude higher (2.5 to 3 magnitudes) than the value we assumed here and would imply a distance of order 20 Mpc which is completely ruled out by the distance determination of 3.3 Mpc by Tonry et al. (2001) and Karachentsev et al. (2002).
5 H I distribution and Velocity field
After Fourier transforming the uv–data the resulting data cube was conditionally blanked, accepting as genuine all emission at levels above rms noise in the data cube smoothed to a resolution of , and requiring that the emission is seen in at least 3 consecutive channels. Maps of the H I column density distribution and velocity field were obtained by taking the zeroth and first moment of the spectra at each pixel along the velocity axis. This was done in both the high and low resolution cubes.
5.1 H I distribution
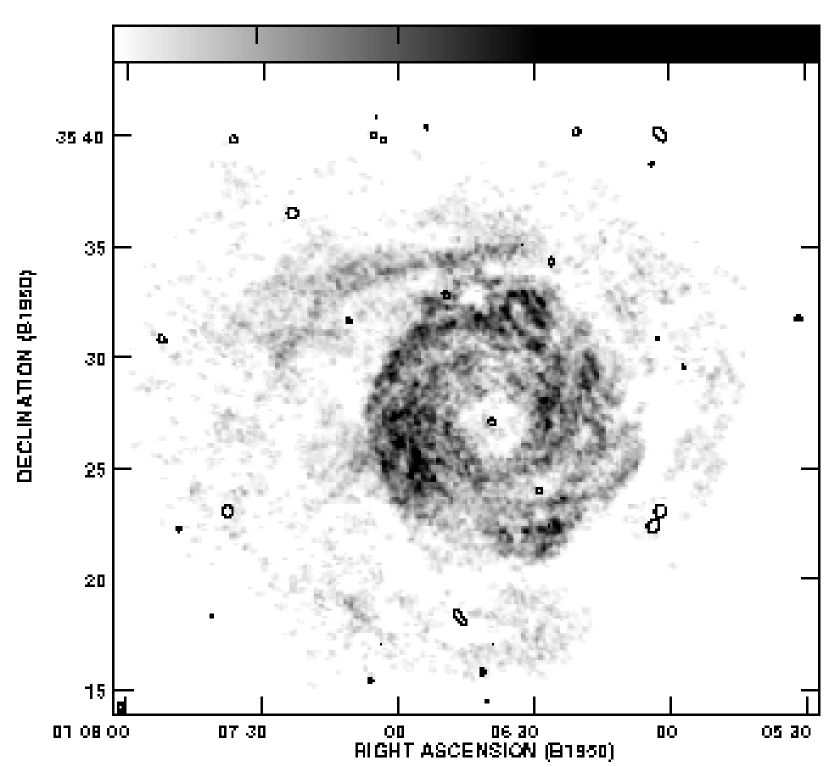
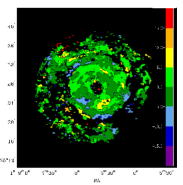
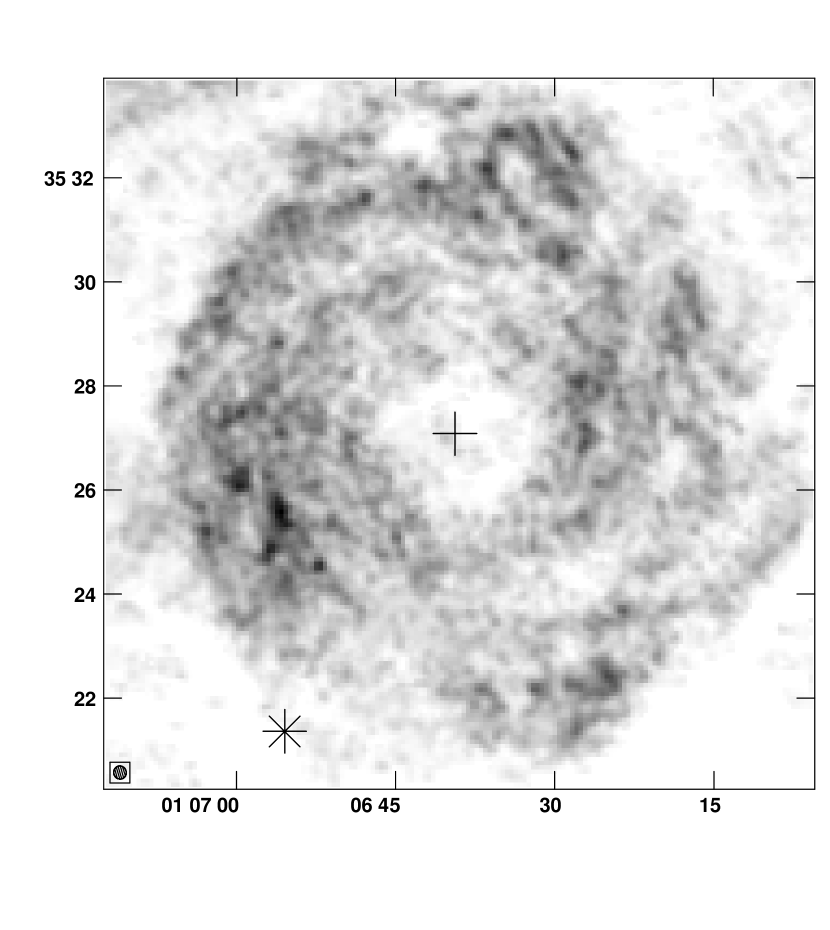
The H I is distributed as a bright doughnut with an inner diameter of and an outer diameter of (see Fig. 3), that is, from R to R. At considerably lower signal–to–noise level an outer ring can be discerned, out to twice that diameter. The ellipticity of that ring is higher than that of the disc, suggesting a different inclination. Our VLA H I data imply a mass of in the “galaxy” (R) and in the “annulus” (R), that is, roughly a distribution of 3/4 of the total mass in the galaxy and 1/4 in the outer ring. There is considerable fine–scale structure visible, but no large scale pattern such as spiral arms. The doughnut is very nearly circular, suggesting an almost face–on orientation. This is corroborated by isophotal fits to the optical image. Barbon et al. (1982) derive values for the inclination and position angle as a function of radius, from R to R. The values they found vary from to in PA and from to in ellipticity. Wiklind & Henkel (1990) use a constant value of and a position angle, PA .
The azimuthally averaged radial distribution of the H I surface density, corrected to face–on, , is shown in Fig. 4 for the full resolution data. The profile was derived from the H I column distribution map by averaging in circular rings in the plane of the galaxy, centered at the position of the nuclear continuum source, with the task iring of GIPSY333The Groningen Image Processing System (GIPSY) is distributed by the Kapteyn Astronomical Institute, Groningen, The Netherlands. The values for PA and are those derived based on the velocity field for a flat and a Keplerian rotation curve (see section 6 for details). There are no significant differences, though, between the two sets of inclination angles in determining the H I surface density.
The surface–brightness vs. radius profile cannot be adjusted to any of the distribution functions that usually characterize these profiles (gaussian or modified Hubble profile). Neither corresponds to a truncated disc either, the decrease beyond R= being much steeper than an exponential.
5.2 Velocity field
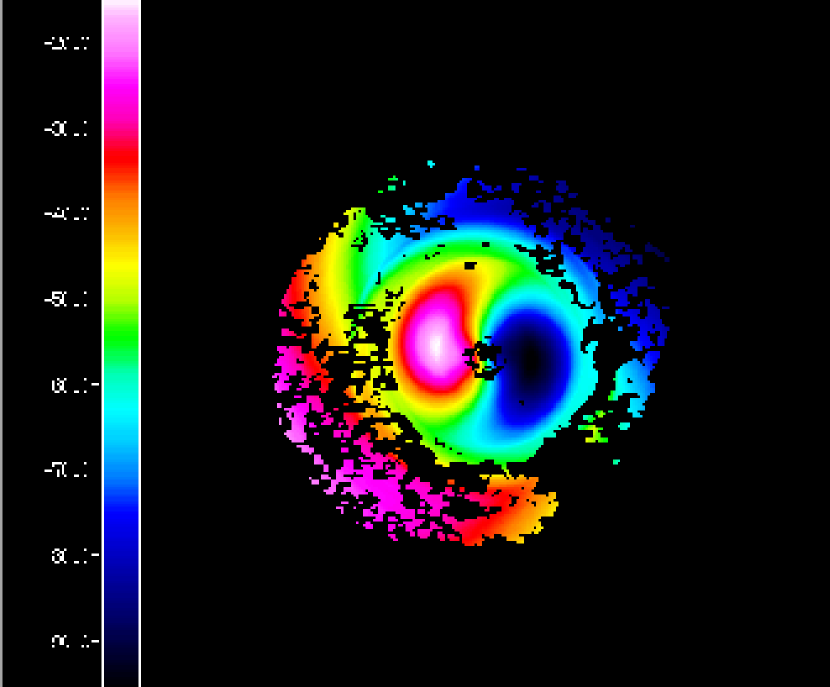
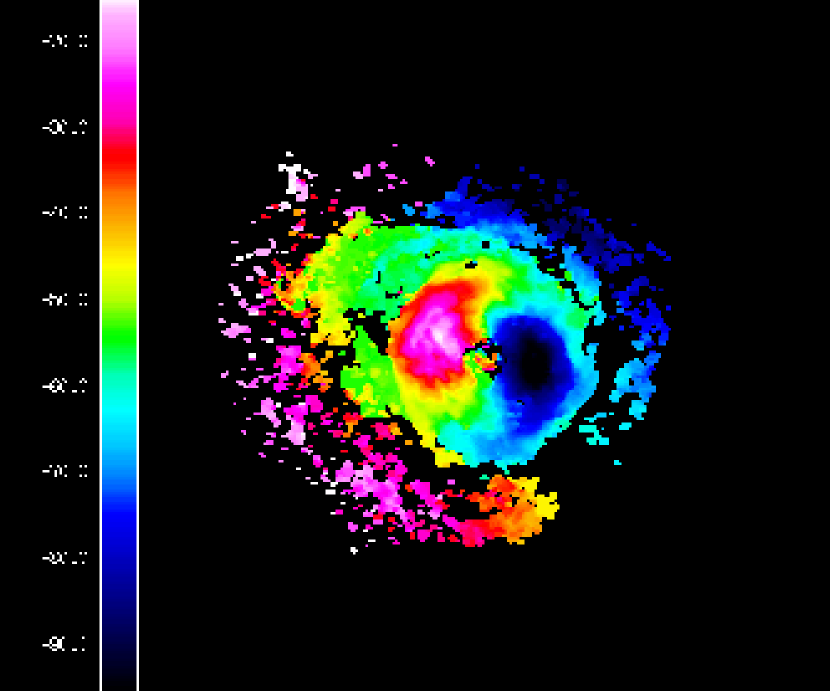
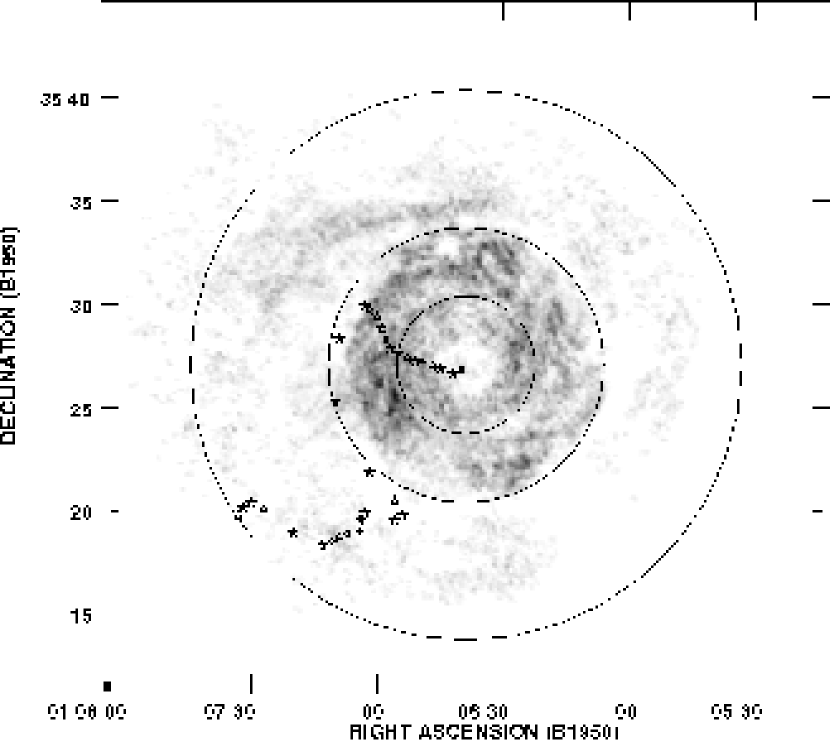
A velocity field, based on the smoothed, channel maps, is presented in Fig. 5. We note that the isovelocity contours are closed, and that the velocities of the external annulus do not form a smooth continuation with those of the main body. Also, the line of nodes varies as a function of radius implying the presence of a warp. The projected radial velocities range from to . The velocities of the outer ring fall within the same range as those of the main body, but the position angle shows a jump (see Fig. 6).
6 Rotation curve
The velocity field in the inner region () is sufficiently regular to permit the determination of a rotation curve for which we used a tilted–ring model as implemented by the task rotcur in the GIPSY package (Rogstad, Lockhart & Wright, 1984; Begeman, 1989).
The model assumes circular symmetry in each of a set of concentric, but not necessarily coplanar rings centered on the nucleus. The projected circular velocity (which is based on the observations) is related to the real velocity , assuming circular orbits of the gas via:
| (2) |
where is the systemic velocity, is the inclination angle, PA is the position angle of the receding major axis (the line of nodes) and is the angle measured with respect to the receding major axis of the object.
To find a set of these parameters that best represent the observed velocity field rotcur performs non–linear least squares fits to the observed radial velocities in a set of concentric elliptical annuli in the plane of the sky, each one beamwidth ( after smoothing, Fig. 5) wide along the major axis. Points on either side of the major axis are included up to (i.e. we excluded a sector around the minor axis). Using best guesses for the systemic velocity () and the kinematical centre of the object, fitted values for , PA and an approximate rotation curve were calculated. Once fits for and PA as a function of radius were found, these values were held fixed and and the central position were fitted. We repeated this procedure a couple of times until consistent values for the central position and were arrived at. The systemic velocity of and the kinematical centre, and , are found to be in good agreement with published values. E.g., based on observations of , Sage (1990) found ; Wiklind & Henkel (1990) derived .
We then proceeded to minimize the dispersion of and PA for each ring. It should be noted that the solution for and are coupled through the factor in Eq. 2, and that this coupling is very strong for low inclinations. In the case of NGC 404 we decided to adopt an inclination of near a radius of , close to the location of the peak of the observed rotation curve. This inclination is based on an intensity weighted average of the ellipticity as a function of radius of the H I doughnut. This inclination, being derived under the assumption that the H I is distributed in a thin disc, is likely a better approximaton of the true value than the inclination quoted by Barbon et al. (1982). With this choice of inclination, the observed peak velocity translates to an intrinsic peak rotational velocity of about at a radius of 444 An inclination of is a lower limit. A more relaxed value would be , as used by Wiklind & Henkel (1989) which results in a peak velocity corrected for inclination a factor of 1.4 lower, at and dynamical masses a factor of 2 lower..
Not being able to independently fit and , we instead considered two extreme solutions. the first one being a Keplerian decline (model K). This model is inspired by the observed radial velocity as a function of radius which follows in its outer parts an r-1/2 curve. Fits to the receding and approaching side of an r-1/2 decline agree to within . We followed Shu, Stachnik & Yost (1971) and constructed a Keplerian rotation curve, based on the sum of an inhomogeneous spheroid and a Toomre disc with , scaled to match the peak velocity of our data.
The second solution we adopted was for the rotation curve to remain flat (model F) after reaching a peak rotational velocity of at a radius of .
With the rotational velocity thus fixed, we reran rotcur and for each model we left only as free parameters to be fitted the PA and . The results of these restricted fits are shown in Fig. 6. In this figure the values for the receding and approaching sides, as well as the average over both sides is plotted. The first thing we note is that for both models the position angles share practically the same values, indicating that this parameter is insensitive to either choice of rotation curve and probably reflects the true run of position angle with radius. The two first points (R) are not significant as they fall within the H I hole (see Fig. 8), where there is scant gas and the fit can take almost any value. From R to R the value for the PA declines monotonically and almost linearly from to . This is depicted in an alternative manner in Fig. 9. There is a discontinuity at R (close to ). It is exactly around this radius that we reach the edge of the main body of the galaxy and that we see the transition to the annulus. Finally, the annulus shows the same tendency, but less pronounced by a factor of 2, the PA decreasing from to .
The behaviour of PA being so similar in both models, the most significant differences then have to be a function of , and mainly for R, where the functional behaviour of both rotation curves starts to diverge. This is indeed what we find. Within the errors, the inclination for the doughnut is constant, differences as small as being sufficient to mask the difference between the K and F models. Beyond R the inclination in the case of the K model has to increase whereas in the case of the F model it remains roughly constant. Fig. 10 is an attempt to visualize the shape and extent of the implied warp, both for a Keplerian decline as well as for a Flat rotation curve.
7 The Mass of NGC 404
We can now proceed to derive the mass within the last measured point for both the K and F model fits to the velocity field. In the case of a Keplerian decline and assuming for simplicity a spherical mass model: , ( in , in and in kpc), we derive a total mass . This is assuming the peak rotational velocity of is reached at after which point the rotation curve falls off. In that case the global ratio is . This is quite a high value and a factor of 1.5 higher than the already substantial values encountered by van Driel & van Woerden (1991).
If we now consider a flat rotation curve, taking as the last measured point a value of , the mass turns out to be four times higher, , and the mass–luminosity ratio would reach a staggering .
Although the values are high, NGC 404 cannot be considered a massive galaxy. If we take the total mass enclosed within ( and ) we find , less than 10% of the mean mass encountered within the same radius in the galaxies making up the sample of van Driel & van Woerden (1991). In that case the mass–to–light ratio is . Although this is still high, it is more in line with that found in Early Type galaxies.
8 Continuum 1.4 GHz
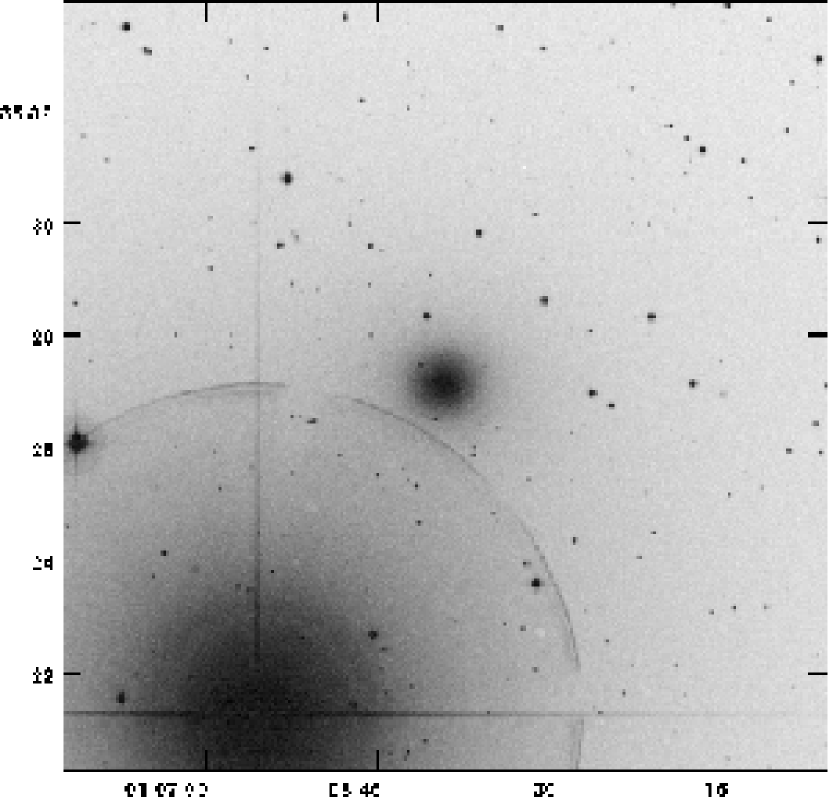
To check for the possible presence of low level continuum emission, we extracted 34 channels at either side of the combined uv–data, free of line emission. The 68 channels were averaged and Fourier–transformed to the image domain and cleaned in a similar manner as the H I maps. Contours of the 1.4 GHz map are shown superposed on the H I map in Fig. 3.
Baars & Wendker (1976) found as upper limit for the continuum emission mJy. We detect radio continuum emission from the nucleus of NGC 404 at the 20 level. The source is unresolved and has a flux density of mJy. We find a position of and . The errors are formal errors to the fit only. The radio and optical positions coincide to within the accuracy of the latter.
The radio power of the nuclear source (at an assumed distance of 3.3 Mpc) is given by . According to Hummel (1980) and Hummel & Kotanyi (1982), about 80% of S0/a to Sab–type galaxies have a central continuum source with a total power similar to, or greater than, . In the study of S0 galaxies by van Driel & van Woerden (1991, and references therein), 90% of the galaxies have a power higher than those indicated by Hummel (1980), even the lowest value found for their weakest object (log P and assuming H) is more than 7 times higher than the value we find for NGC 404. The luminosity of the nuclear source is more than an order of magnitude lower than the Galactic supernova remnant Cas A and comparable to that of the Crab Nebula.
There are 50 point sources with , but only one (besides the nuclear source) has . This source is located at the outer limit of the bright emission of H I, and thus falls beyond the optic limit.
Maoz et al. (1998) found a nuclear UV spectrum characteristic of a very young ( Myr) or at most moderately old ( Myr) burst of star formation. They conclude that the continuum UV source of this LINER is a stellar cluster. Its low luminosity could be explained with 2–6 O stars, although the real number probably is higher after correcting for extinction. With our results we can calculate the massive star formation rate (following Condon 1992) as SFR(, a very low value if compared with the Milky Way () or E+A galaxies (, Miller & Owen 2000) or even when compared with other S0’s, where the massive star formation rate is of the order of (from data given by van Driel & van Woerden 1991).
9 Origin of the H I
The question about the origin of the gas in galaxies of Hubble type S0 hasn’t been fully answered yet. For example, gas lost by evolving stars is likely to be retained by these fairly massive systems, offering a possible explanation for the origin of the gas which is encountered. But in that case, one would expect a far larger proportion of S0s to be detected in H I. In the following we will look at the different scenarios to explain the origin (from internal as well as external sources) of the detected gas in NGC 404.
9.1 Burnt–out disc
This scenario assumes that lenticular galaxies are former spirals, that consumed efficiently their gas content in the process of star formation (Larson et al., 1980). In that case, the gas–rich S0s could be lenticulars which, although they consumed the gas in the inner region, somehow retained some gas in the outskirts. This H I is then the left–over primordial gas from which the galaxy was formed. Due to the low density of the gas in the outer regions, it never formed stars there.
Like many S0s, NGC 404 presents a central hole in its H I distribution giving it the appearance of a doughnut with an inner and outer radius of . This extent is larger than that found in other S0s. The azimuthally averaged neutral atomic gas surface density, , in this ring is , too low by at least a factor of 5 for a efficient star formation to proceed, and of the same order as that encountered in many gas rich S0’s. We used Kennicutt’s criterion (Kennicutt, 1989) to look in a bit more detail in to the this issue. Using the observed one dimensional velocity dispersion of the gas and observed rotation curve, we find that the gas surface density is too low by an order of magnitude for gravitational collapse of the gas to occur.
This implies that this scenario runs into trouble on various fronts. Firstly, the neutral gas surface density is way too low for star formation to take place. In fact, one would expect not only that a close to critical surface density would be found, but also that the peak gas density is reached at the edge of the stellar counterpart. In fact, we find it farther out, near , i.e., far from the optical edge of the galaxy which is where the purported SF zone ends. Also, within this framework other observed features of the gas, such as the change in position and inclination angles, or the presence and morphology of the outer annulus are difficult to account for. Hence, we consider it improbable that the H I gas in NGC 404 is mainly left–over primordial gas.
9.2 Mass loss of evolved stars
It is well established that the ISM is constantly replenished through contributions of evolved stars which inject gas and dust into the ISM. This process is also occurring in S0s and indeed, the amount of gas isn’t negligible: (Faber & Gallagher, 1976). This implies that the majority of S0s should be gas rich and that this is the rule rather than the exception. As we find the contrary, there must exist a mechanism which rids S0s from this gas. Star formation doesn’t seem a viable candidate as little SF activity is recorded in S0s. Similarly, a galactic wind seems to be ruled out, as is interaction with, e.g., an intracluster medium, NGC 404 finding itself isolated. Alternatively, the gas which is lost inherits the velocity dispersion of the stars leading to temperatures which are in the X–ray regime.
For a typical S0 with and a blue luminosity, , of order to we obtain a reasonable estimate for the time needed (a few times yr) to collect the observed amount of gas as a result of mass loss from evolved stars. However, in the case of NGC 404, its luminosity is very low (). This, combined with an H I mass to blue luminosity ratio which is higher than the majority of S0s studied thusfar (), results in an estimated time scale of order a Hubble time. So despite the fact that theoretically the ISM detected in NGC 404 could be accounted for by steady mass loss since it formed, there are serious shortcomings to this potential explanation. Mass loss by evolved stars wouldn’t answer the question why most of the ISM is found beyond either, where star formation is and has been negligible. Moreover, it would be difficult to explain where it got its angular momentum from.
9.3 External Origin
The former scenarios offer unsatisfactory explanations for the origin of H I in NGC 404. They especially fail to explain the fact that the outer ring is tilted. In fact, this is one of the stronger arguments for postulating an external origin of the gas.
The H I content could be the result of the merger of a dwarf irregular galaxy with NGC 404. If we assume as a value representative for normal dwarf galaxies (; Huchtmeier & Ehle 1999) we find that a dwarf with has a large enough gas supply to account for the observed amount of of H I gas.
Assuming (Huchtmeier & Ehle, 1999), the total mass of the dwarf, in a single merger, would have been . The total mass of NGC 404 is, at least, . The mass of the dwarf then would have been only of that of NGC 404, and the merger would have had no major dynamical effect on the latter.
In section 6 we assumed that the gas could be described as moving in concentric annuli within the potential well of the galaxy. If left to their own design, such annuli tend to settle in a preferred plane, the plane of the galaxy. Following Tholine et al. (1982) we have calculated the time scale () for settling to a preferred plane of two annuli in NGC 404, one at R= and one at R=, assuming that the donor galaxy left its gas in a plane inclined by about with respect to NGC 404. For R= yr, whereas for R= yr (which corresponds to rotational periods). As can be appreciated in Figs. 6 (the plots of versus radius) and 10, the gas in the ring at R= has already settled in the plane of the galaxy. Now if we assume that the gas has been accreted during just one interaction, this must have happened at least yr ago. This time lapse agrees fairly well with that necessary for the ring at R= to settle from an original inclination of to its current value of (assuming Keplerian rotation). These arguments restrict considerably the time elapsed since the interaction. If it were much smaller than yr, the gas of the inner ring (the doughnut) wouldn’t have had time to settle into the plane of the galaxy whereas if it were much larger, the outer ring would have settled within the plane of the disc of NGC 404.
If we assume that the gas currently encountered in NGC 404 was transferred in a fly–by encounter, the culprit must have moved outside of a volume with a radius of 1.1 Mpc as there are no objects within 1.1 Mpc (Karachentsev et al., 2002). This would imply a relative velocity for the possible intruder of order , an uncomfortably high value. This rather argues in favor of a catastrophic merger.
In case the rotation curve is flat (model F), the dynamical time scale, , is slightly shorter, yr for R and comes out to be yr for R.
10 Discussion
Numerical simulations of hierarchical galaxy formation within the Cold Dark Matter (CDM) paradigm and carried out with sufficient resolution (in mass) to distinguish dwarf galaxies (Klypin et al. 1999; Moore et al. 1999) predict the existence of numerous low-mass halos. Observations, however, come up with numbers much smaller than predicted. One of the possible explanations which has been invoked is that these halos are too small to produce star formation, or that their luminosity is so low that this makes them difficult to detect. In those systems where star formation has taken place, ratios tend to be high (Tully et al., 2002). These systems are thought to appear in groups. In contrast, NGC 404 is an isolated galaxy. Karachentsev et al. (2002) suggest that this galaxy may represent the final stage of consecutive merging of members of a former group of galaxies. In this case, it could be the dominant member of a group of small galaxies, some of which, rich in neutral gas, have contributed the material which extends up to almost .
The high ratio confirms that this is an extreme case where matter (bright and dark) is highly concentrated. This high mass concentration also fits in with the picture of the orbits of gas captured through a merger event decaying within a few Gyr and aligning with the plane of the galaxy (Casertano & van Gorkom, 1991). This implicitly assumes that there is no extended dark halo to maintain gas orbits in a warp for a long period of time.
Regarding the apparently falling rotation curve, there are several other galaxies (Carignan & Puche 1990 (NGC 7793), Casertano & van Gorkom 1991 (NGC 2683, NGC 3521), Persic & Salucci 1995 (a few galaxies among their 967 spiral galaxy sample), Olling 1996 (NGC 4244), Jore et al. 1996 (NGC 4138), Honma & Sofue 1997 (11 galaxies), Sofue et al. 1999 (the Milky Way, among others), and Chung et al. 2002 (NGC 7631, KUG 2318+078)) in which the rotation curve begins to decline close to . However, in most of these cases the H I measurements don’t go much further than this radius and this might be the reason why no convincingly declining rotation curves have been found to date.
So, Keplerian declines are rare. Honma & Sofue (1997) list 11 galaxies for which with some confidence one can state that the rotation curve falls significantly (by 50–100 km s-1). The most extreme case, and in fact a system quite similar to NGC 404, is the galaxy NGC 4138 which was observed by Jore et al. (1996). H I was detected out to 2.5 optical disc radii (16 scale–lengths). This gas is counterrotating with respect to the main stellar body, suggesting recent capture of a gas rich satellite, like in the case of NGC 404. But unfortunately, also in this case difficulties in fitting the rotation curve prevents the authors from unambiguously confirming a Keplerian decline.
In the case of NGC 404 Nature is playing tricks on us and decided to put this object close to face–on, making it impossible to solve separately for the inclination and rotation speed in the plane of the galaxy. Hence, we decided to analyse two extreme options for the intrinsic rotation curve: a flat rotation curve out to the last measured point (model F) and a curve following a Keplerian decline (model K).
If the rotation curve remains flat, then NGC 404 is one of the “darkest galaxies” known with an M/L of 175 and a fraction of 92% of its mass being due to Dark Matter. It would also be one of very few galaxies for which a rotation curve out to (48 scale-lengths in the –band) has been determined. The only other galaxy for which data up to (15 scale-lengths) are available is DDO 154 (Carignan & Beaulieu, 1989). On the other hand, if this galaxy really follows a Keplerian decline, it would be unique. In that case, the extent of the DM halo would reach out to 3.2 kpc (). One argument which would favour Keplerian decline is that the warp geometry makes more sense and qualitatively fits the picture of accreted material settling within the gravitational potential of the galaxy, the outermost inclined annuli taking longer than the more inward located ones. An additional argument is that for model K the M/L ratio is more reasonable.
Finally, the preference for a Keplerian decline is reinforced by the fact that in the case of a flat rotation curve, the inclination of the outer annulus is the same as that of the inner part of the galaxy. This is at odds with the shape of the outer annulus which clearly gives the impression of having a larger ellipticity which instead would imply a higher inclination. This is exactly what we find when fitting a the Keplerian rotation curve. In this case we find that 68% of the mass in NGC 404 is in the form of Dark Matter.
11 Conclusions
NGC 404 is an exceptionally gas rich early–type galaxy. The H I is distributed in two separate systems, a doughnut which extends from or to (1.6 to 6.4 kpc for a distance of 3.3 Mpc) and an annulus of much lower surface brightness which extends from to roughly .
We derive a total H I mass of of which 75% resides in the doughnut and the rest in the outer annulus. This translates to a distance independent ratio of 0.22 in solar units which is high for an S0 galaxy knowing that the median for S0’s galaxies is whereas for Sb galaxies this is (Roberts & Haynes, 1994).
The velocity field shows a steeply declining rotation curve. Unfortunately, the galaxy is oriented almost face–on and, assuming circular rotation of the gas in annuli, good fits can be obtained when forcing both a flat rotation curve and a rotation curve that falls off like a Keplerian. In both cases the position angle (PA) of the kinematical major axis varies with radius by . In the Keplerian decline model, the gas in the outer annulus is warped, the annulus moving to a less face–on orientation with radius.
A total mass of is found when using the Keplerian rotation curve. This implies a global ratio of in solar units, which is exceptionally high. This is partly due to the fact that the blue luminosity of the galaxy is times lower than average for an S0. For a flat rotation curve, a lower mass limit of or four times higher is derived, leading to a consequently four times higher total mass–luminosity ratio of .
The nuclear source is detected at 20 cm. If nonthermal, its luminosity of is a factor of ten lower than Cas A and more in line with that of the Crab nebula. If dominated by star formation, the SFR is a low SFR(, 2–6 O stars being enough to explain the observed luminosity.
Given the mass and luminosity of NGC 404, we are dealing with a dwarf lenticular galaxy. Assuming Keplerian decline, the DM halo is compact and ends near . Our preferred explanation for the origin of the ISM in this system is that it has been accreted through a catastrophic merger with a gas–rich, dwarf irregular system, less than a tenth of the mass of NGC 404 which has taken place anywhere between yr ago (no other objects having been encountered within a volume of 1.1 Mpc radius). Gas at small radius has already settled within the plane whereas gas in the outer annulus is still gravitating towards the midplane of the disc defined by the S0, resulting in a warp of the gas distribution.
Although none of our conclusions depends strongly on the rotation curve being flat or declining, it is of course extremely frustrating that it hasn’t proven possible to decide between these two extreme models, especially since the observed radial velocities decline so strongly. This leaves NGC 404 as potentially the first galaxy with a rotation curve that shows such a pronounced decline over such a large extent which, if confirmed, would be of extreme importance.
References
- Baars & Wendker (1976) Baars J.W.M. & Wendker H.J. 1976, A&A, 48, 405
- Baggett et al. (1998) Baggett W.E., Baggett S.M.& Anderson K.S.J. 1998, AJ, 116, 1626
- Barbon et al. (1982) Barbon R., Capaccioli M. & Rampazzo R. 1982, A&A, 115, 388
- Begeman (1989) Begeman K.G. 1989, A&A, 223, 47
- Carignan & Beaulieu (1989) Carignan C. & Beaulieu S. 1989, ApJ, 347, 760
- Carignan & Puche (1990) Carignan C. & Puche D. 1990, AJ, 100, 394
- Casertano & van Gorkom (1991) Casertano S. & van Gorkom J.H. 1991, AJ, 101, 1231
- Chung et al. (2002) Chung A., van Gorkom J.H., O’Neil, K. & Bothun G.D. 2002, AJ, 123, 2387
- Condon (1992) Condon J.J. 1992, ARA&A, 30, 575
- RC3 (1991) de Vaucouleurs, G., de Vaucouleurs, A., Corwin JR., H.G., Buta, R. J. Paturel, G., & Fouque, P. 1991, Third Reference Catalogue of Bright Galaxies
- Faber & Gallagher (1976) Faber S.M. & Gallagher J. 1976, ApJ, 204, 365
- García (1993) García A.M. 1993, A&AS, 100, 47
- Honma & Sofue (1997) Honma, M. & Sofue, Y. 1997, PASJ, 49, 539
- Huchtmeier & Ehle (1999) Huchtmeier W.K. & Ehle M. 1999, PASA 16, 24
- Humason et al. (1956) Humason M.L., Mayall N.U. & Sandage A.R. 1956, AJ, 61, 97
- Hummel (1980) Hummel E. 1980, A&AS, 41, 151
- Hummel & Kotanyi (1982) Hummel E. & Kotanyi C.G. 1982, A&A, 106, 183 155,747
- Jore et al. (1996) Jore, K.P., Broeils, A.H. & Haynes, M.P. 1996, AJ, 112, 438
- Jörsäter & van Moorsel (1995) Jörsäter S. & van Moorsel G.A. 1995, AJ, 110, 2037
- Jura (1986) Jura M. 1986, ApJ, 306, 483
- Karachentsev et al. (2002) Karachentsev I.D., Sharina M.E., Makarov D.I., Dolphin A.E., Grebel E.K., Geisler D., Guhathakurta P., Hodge P.W., Karachentseva V.E., Sarajedini A. & Seitzer P. 2002, A&A, 389, 812
- Kennicutt (1989) Kennicutt, R.C., Jr. 1989, ApJ, 344, 685
- Klypin et al. (1999) Klypin A., Kravtsov A. V., Valenzuela O. & Prada F. 1999, ApJ, 522, 82
- Knapp et al. (1984) Knapp G.R., Guhathakurta P., Kim D.W. & Jura M.A. 1989, ApJS, 70, 329
- Larson et al. (1980) Larson R.B., Tinsley B.M. & Caldwell C.N. 1980, ApJ, 237, 692
- Maoz et al. (1998) Maoz D., Koratkar A., Shields J.C., Ho L.C., Filippenko A. V. & Stenberg A. 1998, AJ, 116, 55
- Miller & Owen (2000) Miller N.A. & Owen F.N. 2000 Gas and Galaxy Evolution: A Conference in Honor of the 20th Anniversary of the VLA Socorro, New Mexico, USA
- Moore et al. (1999) Moore B., Ghigna S., Governato F., Lake G., Quinn T., Stadel J. & Tozzi, P. 1999, ApJ, 524, L19
- Morgan (1958) Morgan W.W. 1958, PASP, 70, 364
- Olling (1996) Olling R.P. 1996, AJ, 112, 457
- Persic & Salucci (1995) Persic M. & Salucci P. 1995, ApJS, 99, 501
- Roberts & Haynes (1994) Roberts, M. S. & Haynes, M. 1994, ARA&A, 32, 115
- Richter & Huchtmeier (1984) Richter & Huchtmeier 1984, A&A, 132, 253
- Rogstad et al. (1984) Rogstad D.H., Lockhart I.A. & Wright M.C.H. 1974, ApJ, 193, 309
- Sage (1990) Sage L.J. 1990, A&A, 239, 125
- Sandage (1961) Sandage A. 1961 The Hubble Atlas of Galaxies, Washington, D.C.: Carnegie Institution of Washington
- Schmidt et al. (1990) Schmidt A.A., Bica E. & Alloin D. 1990, MNRAS, 243, 620
- Shu, Stachnik & Yost (1971) Shu F. H., Stachnik R. V. & Yost J. C. 1971, ApJ, 166, 465
- Sofue et al. (1999) Sofue Y., Tutui Y., Honma M., Tomita A., Takamiya T., Koda J. & Takeda Y. 1999, ApJ, 523, 136
- Tholine et al. (1982) Tohline J.E., Simonson G.F& Caldwell N. 1982, ApJ252, 92
- Tonry et al. (2001) Tonry J.L, Dressler A., Blakeslee J.P., Ajhar E.A., Fletcher A.B., Luppino G.A., Metzger M.R. & Moore C.B. 2001, ApJ, 546, 681
- Tully & Fisher (1977) Tully R.B. & Fisher J.R. 1977, A&A, 54, 661
- Tully et al. (2002) Tully R.B., Somerville R.S., Trentham N. & Verheijen M.A.W. 2002, ApJ, 569, 573
- van Driel & van Woerden (1991) van Driel W. & van Woerden H. 1991, A&A, 243, 71
- van Gorkom et al. (1986) van Gorkom J.H., Knapp G. R., Raimond E., Faber S. M. & Gallagher J. 1986, AJ, 91, 791
- Walter & Brinks (1999) Walter F. & Brinks E. 1999, AJ, 118, 273
- Wiklind & Henkel (1989) Wiklind T. & Henkel C. 1989, A&A, 225, 1
- Wiklind & Henkel (1990) Wiklind T. & Henkel C. 1990, A&A, 227, 394
| Morphological type | S0 |
|---|---|
| Isophotal major diameter D25 | aaNED |
| Exponential scale length | bbdel Río (in preparation) |
| Exponential scale length | ccBaggett et al. (1998) |
| Inclination | ddValues for |
| Position Angle P.A. | ddValues for |
| Adopted distance | 3.3 MpceeTonry et al. (2001) |
| Corrected total magnitude | 10.93ffRC3 |
| Apparent blue magnitude | 11.21ffRC3 |
| Total blue luminosity () | |
| VLA configuration | C | D |
|---|---|---|
| Date of observation | 1-Apr-96 | 16-Jul-96 |
| Time on source | 132.5 minutes | 54 minutes |
| Total bandwidth | 1.56 MHz | 1.56 MHz |
| No. of Channels | 128 | 128 |
| Velocity resolution | 2.57 | 2.57 |
| Central velocity |
| High resolution | |
| Half power beam | |
| Noise per channel | 1.1 mJy beam-1 |
| Conversion factor (1mJy beam-1) | 2.7 K |
| Low resolution | |
| Half power beam | |
| Noise per channel | 0.65 mJy beam-1 |
| Conversion factor (1mJy beam-1) | 1.0 K |