UV light from young stars in GEMS quasar host galaxies at
Abstract
We have performed HST imaging of a sample of 23 high-redshift () Active Galactic Nuclei, drawn from the combo-17 survey. The sample contains moderately luminous quasars (). The data are part of the gems imaging survey that provides high resolution optical images obtained with the Advanced Camera for Surveys in two bands (F606W and F850LP), sampling the rest-frame UV flux of the targets. To deblend the AGN images into nuclear and resolved (host galaxy) components we use a PSF subtraction technique that is strictly conservative with respect to the flux of the host galaxy. We resolve the host galaxies in both filter bands in 9 of the 23 AGN, whereas the remaining 14 objects are considered non-detections, with upper limits of less than 5 % of the nuclear flux. However, when we coadd the unresolved AGN images into a single high signal-to-noise composite image we find again an unambiguously resolved host galaxy. The recovered host galaxies have apparent magnitudes of and with rest-frame UV colours in the range . The rest-frame absolute magnitudes at 200 nm are . The photometric properties of the composite host are consistent with the individual resolved host galaxies. We find that the UV colors of all host galaxies are substantially bluer than expected from an old population of stars with formation redshift , independent of the assumed metallicities. These UV colours and luminosities range up to the values found for Lyman-break galaxies (LBGs) at . Our results suggest either a recent starburst, of e.g. a few per cent of the total stellar mass and 100 Myrs before observation, with mass-fraction and age strongly degenerate, or the possibility that the detected UV emission may be due to young stars forming continuously. For the latter case we estimate star formation rates of typically (uncorrected for internal dust attenuation), which again lies in the range of rates implied from the UV flux of LBGs. Our results agree with the recent discovery of enhanced blue stellar light in AGN hosts at lower redshifts.
Subject headings:
galaxies: active – galaxies: high-redshift – galaxies: fundamental parameters – galaxies: starburst – quasars: general1. Introduction
Around redshifts of –3, luminous quasars were orders of magnitude more numerous than today. Although the physics of how active galactic nuclei evolve is still not understood, several links between galaxy and quasar evolution have emerged over recent years. The observational confirmation of supermassive black holes in the nuclei of all galaxies with a substantial bulge component (e.g. Gebhardt et al., 2000) makes every such galaxy a potential AGN host. The strong evolution of the AGN space density could therefore be related to the availability of accretion fuel in the host galaxies, or to the frequency of AGN triggering events.
Gravitational interaction and major or minor merging of galaxies have long been suggested as important factors in driving nuclear activity in galaxies. Confirming any of these as the dominant process has proved difficult, mainly because the morphological characteristics found for relatively nearby AGN host galaxies are so diverse. Furthermore, the properties of the hosts in the ‘heyday’ of quasars () are still elusive, a consequence of the substantial observational difficulties. The contrast between the bright nuclear point sources and the surrounding galaxy increases dramatically beyond as a result from both surface brightness dimming and waveband shifts towards the rest frame UV.
The last years have seen numerous attempts to resolve the host galaxies of high-redshift quasars. Owing to the observational challenges of detecting distant host galaxies the observational effort for each object is large, and the observed samples have consequently been very small, of the order of per target group. While radio-loud quasars appear to be very extended and have been resolved out to (e.g., Lehnert et al., 1992; Carballo et al., 1998; Hutchings et al., 1999; Kukula et al., 2001; Hutchings, 2003; Sánchez & González-Serrano, 2003), this is not the case for the large majority of radio-quiet quasars.
At high redshifts two constraints dominate observational studies of host galaxies: On one side, very good seeing conditions are required to maximize the spatial contrast of the compact nuclear source compared to the extended host galaxy. On the other, large telescope apertures are preferrential to trace faint quasar hosts to as far away from the nucleus as possible. Thus significant progress had to wait for 8m-class telescopes at very good sites with active optics systems – with a very high light collecting power but atmospheric seeing limitations – and for the HST and its high space-based sensitivity, combined with unprecedented spatial resolution, but limited size that might miss light from faint outer structures of the hosts. Some host galaxies of radio-quiet quasars at have now been resolved both in the near infrared (Aretxaga et al., 1998; Kukula et al., 2001; Ridgway et al., 2001; Falomo et al., 2004) and in the optical domains (Hutchings et al., 2002), showing these objects to be moderately luminous, corresponding to present-day or slightly brighter.
However, host galaxy colours have been unavailable, precluding estimates of the mass-to-light ratio (). Thus, without colours the observed luminosities, and their evolution with redshift, cannot be mapped to the mass evolution if young stars contribute a major fraction of AGN host’s light. This is important as several high-luminosity quasars at appear to be located in very UV-luminous host galaxies (Lehnert et al., 1992; Aretxaga et al., 1998; Hutchings et al., 2002). Also, at low redshifts there is a link between nuclear activity and enhanced global star formation in the host galaxies. Kauffmann et al. (2003) reported that SDSS spectra of local Seyfert 2 galaxies show a significant contribution from young stellar populations, and that this trend is strongly correlated with nuclear luminosity. In a multicolour study of low- QSO hosts (Jahnke et al., 2004) as well as at intermediate redshifts (Sánchez et al., 2004, see below) we found that hosts of elliptical morphology can be significantly bluer than the bulk of inactive ellipticals. These results indicate that in the recent past the star formation activity in galaxies hosting an AGN may be different from normal galaxies. The details are far from understood. Clearly more information is required to investigate the relation of starformation and AGN activity, their common cause or causal order and the evolution of these properties with redshift.
The new generation of wide-field imaging mosaics obtained with the Hubble Space Telescope (HST), especially in the conjunction with deep AGN surveys, has opened a new observational avenue towards AGN host galaxy studies. Here we present first results on AGN within the gems project (Rix et al., 2004), the largest HST colour mosaic to date. In the present paper we investigate the presence of rest-frame ultraviolet light in a substantial sample of AGN, all with nuclear luminosities near . In a companion paper (Sánchez et al., 2004) we study rest-frame colours and morphological properties of a sample of intermediate-redshift () AGN.
The paper is organised as follows. We first describe the sample selection and properties together with a summary of the observational data (Sect. 2). We then comment on the decomposition of the nuclear and galaxy contribution, including a brief summary of the extensive simulations that we use to estimate measurement errors (Sect. 3). In Sect. 4 we present the measured host galaxy magnitudes and describe our treatment of non-detections. We move on to discuss the results in Sect. 5, followed by our conclusions in Sect. 6. We use km s-1 Mpc-1, and throughout this paper. All quoted magnitudes are zeropointed to the AB system with ZP and ZP.
2. AGN in the GEMS survey
2.1. Overall survey properties
gems, Galaxy Evolution from Morphologies and SEDs (Rix et al., 2004) is a large imaging survey in two bands (F606W and F850LP) with the Advanced Camera for Surveys (ACS) aboard HST. Centered on the Chandra Deep Field South (CDFS), it covers an area of (78 ACS fields). Each ACS field was integrated for –13 min exposures per filter (one orbit), dithered by between exposures. The individual images were then combined, corrected for the ACS geometric distortion, and at the same time rebinned to a finer pixel grid of , achieving approximate Nyquist-sampling of the PSF. The image combination also removed artefacts such as cosmic ray hits and satellite trails. Resulting point source limiting magnitudes are () and (). In its central 1/5, gems incorporates the epoch 1 data from the goods (Giavalisco et al., 2004) project, that are similarly deep as the other gems fields. Further details of the data reduction procedure will be given in a forthcoming paper (Caldwell et al. 2004, in prep.).
The area covered by gems coincides with one of four fields covered by the combo-17 survey (Wolf et al., 2004), which produced a low-resolution spectrophotometric data base (based on photometry in 17 filters) for about 10 000 galaxies and 60 type 1 AGN brighter than (Vega zeropoint) in the CDFS area (Wolf et al., 2003, 2004). The large number of filters permitted simultaneous assignment of accurate SEDs and redshifts for both galaxies and type 1 AGN. Galaxies and AGN are classified by matching an SED template library to the set of 17 photometric points. The AGN SED is composed of a range of continuum spectra with added broad emission lines (all details are given in Wolf et al., 2004). Type 2 AGN as well as very low luminosity AGN are invariably classified as galaxies. combo-17 photometric redshifts are very reliable, with an rms scatter of for galaxies (at ) and for AGN at all redshifts. In this paper we address specific combo-17 sources just by their running identifiers; the full combo-17 list of classifications in the CDFS will be made available in the future (Wolf et al. 2004, in prep.).
2.2. The AGN sample
The combo-17-selected AGN in the gems field range over redshifts from up to . In this study we investigate the high- part of the AGN distribution. Our sample contains all AGN brighter than in the redshift range that show a meaningful counterpart in the gems images. This excludes three objects with a primary classification as AGN by combo-17 that were apparently low redshift () emission line galaxies.
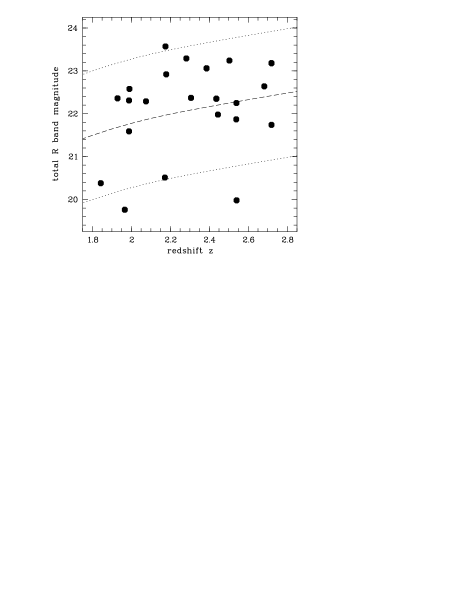
At these redshifts, all light detected in the gems bands will originate in the rest frame ultraviolet. In fact, the lower redshift limit has been imposed to ensure that the long wavelength cutoff of the F850LP filter is still located below the Balmer jump for all objects. The upper redshift boundary, on the other hand, was set to avoid contamination from possible extended Ly emission in the F606W filter. The resulting sample contains 23 AGNs, three of which are positioned in the overlap region of two tiles so two separate images exist for these. One object (combo-17 05696) shows inconsistent photometry between the two tiles due to variability over the 111 days between the two integrations. Another object (combo-17 19965) was classified in combo-17 with a redshift of that had to be revised following spectroscopy observations (G. Worseck, private communication) and now entered this sample with . Table 1 gives an overview over the sample properties, and Figure 1 shows the distribution in and . The average absolute magnitudes for these objects – which we call intermediately luminous quasars – place them close to the canonical division of between Seyfert galaxies (low-luminosity) and QSOs (high-luminosity).
Several X-ray sources in the CDFS have already been studied by HST with the WFPC2 camera (Schreier et al., 2001; Koekemoer et al., 2002; Grogin et al., 2003), most of them faint AGN, but their sample is completely disjoint from the combo-17 AGN selection for this redshift range. One object falls into our redshift range but has , outside our selection limits.
| IDaaID from the combo-17 catalogue | Tilebbgems tile number (1–63 gems, 80–95 goods region) | RA (2000) | DEC (2000) | ccPhotometric redshift from combo-17; for combo-17 19965 a revised redshift from an ongoing objective prism survey was used | (Vega)dd-band magnitude (Vega zeropoint) from combo-17 | F606WeeTotal F606W- and F850LP-band magnitudes (AB zeropoint) as measured with the ACS. Photometric errors range from 0.07–0.10 for both filter. Three objects are imaged on two different tiles. Due to nuclear variability this can result in different F606W and F850LP-band fluxes. | F850LPeeTotal F606W- and F850LP-band magnitudes (AB zeropoint) as measured with the ACS. Photometric errors range from 0.07–0.10 for both filter. Three objects are imaged on two different tiles. Due to nuclear variability this can result in different F606W and F850LP-band fluxes. |
|---|---|---|---|---|---|---|---|
| 12325 | 11 | 03 33 01.7 | –27 58 19 | 1.843 | 20.38 | 20.13 | 19.65 |
| 19965 | 23 | 03 31 45.2 | –27 54 36 | 1.90 | 19.96 | 20.59 | 20.29 |
| 30792 | 82 | 03 32 43.3 | –27 49 14 | 1.929 | 22.36 | 21.60 | 22.06 |
| 02006 | 04 | 03 32 32.0 | –28 03 10 | 1.966 | 19.76 | 19.59 | 18.98 |
| 04809 | 08 | 03 31 36.3 | –28 01 50 | 1.988 | 22.31 | 21.18 | 20.91 |
| 06817 | 09 | 03 31 27.8 | –28 00 51 | 1.988 | 21.59 | 21.61 | 20.86 |
| 18324 | 19 | 03 33 00.9 | –27 55 22 | 1.990 | 22.58 | 22.00 | 21.33 |
| 05498 | 01 | 03 33 16.1 | –28 01 31 | 2.075 | 22.29 | 22.91 | 22.28 |
| 11941 | 10 | 03 33 26.3 | –27 58 30 | 2.172 | 20.51 | 20.80 | 20.40 |
| 62127 | 62 | 03 31 36.7 | –27 34 46 | 2.175 | 23.57 | 24.91 | 24.37 |
| 51835 | 55 | 03 31 40.1 | –27 39 17 | 2.179 | 22.92 | 23.01 | 22.41 |
| 00784 | 05 | 03 32 27.1 | –28 03 36 | 2.282 | 23.29 | 23.28 | 22.80 |
| 36120 | 39 | 03 31 49.4 | –27 46 34 | 2.306 | 22.37 | 22.70 | 22.23 |
| 05696 | 02 | 03 33 21.8 | –28 01 21 | 2.386 | 23.06 | 22.73 | 22.32 |
| 05696 | 03 | ′′ | ′′ | ′′ | ′′ | 23.14 | 22.68 |
| 07671 | 07 | 03 31 51.8 | –28 00 26 | 2.436 | 22.35 | 22.35 | 22.24 |
| 07671 | 15 | ′′ | ′′ | ′′ | ′′ | 22.36 | 22.22 |
| 06735 | 02 | 03 33 06.3 | –28 00 56 | 2.444 | 21.98 | 22.14 | 21.88 |
| 01387 | 08 | 03 31 44.0 | –28 03 20 | 2.503 | 23.24 | 24.05 | 23.17 |
| 33644 | 31 | 03 32 59.9 | –27 47 48 | 2.538 | 21.87 | 21.28 | 21.17 |
| 11922 | 11 | 03 33 09.1 | –27 58 27 | 2.539 | 22.25 | 22.65 | 21.93 |
| 16621 | 19 | 03 33 09.7 | –27 56 14 | 2.540 | 19.98 | 20.41 | 20.06 |
| 15396 | 21 | 03 32 16.2 | –27 56 44 | 2.682 | 22.64 | 22.69 | 22.41 |
| 33630 | 33 | 03 31 40.1 | –27 47 46 | 2.719 | 21.74 | 22.21 | 21.98 |
| 42882 | 45 | 03 32 01.6 | –27 43 28 | 2.719 | 23.18 | 23.89 | 23.48 |
| 42882 | 95 | ′′ | ′′ | ′′ | ′′ | 24.04 | 23.54 |
3. Data analysis
3.1. Background and variances
Even though space based, ACS shows a non-negligible background from stray light. In the reduction process already a global, outlier clipped median background was subtracted (Caldwell et al. 2004, in prep.). As the deblending of nuclear and host galaxy component with two-dimensional modelling is sensitive to background sources, we applied an extra procedure to remove net residuals in the local background. This included an iterative masking of all objects in the field and the determination of the local background from the object-free regions. For each square of pixels an average from the unmasked pixels was computed, with a subsequent bilinear interpolation between these values to yield a background estimate for the whole field. After background adjustment, small subimages of pixels were extracted around all AGNs, corresponding to a field of view of . This field size contains % of the ACS PSF flux. Since the AGN are not strongly resolved this fraction also applies to the AGN flux.
The data reduction procedure kept record of the individual pixel weights throughout the process of reduction and combination. This information was then used in combination with the shot noise derived from pixel count rates to construct variance images which were later used in the error budget calculations.
3.2. PSF estimation
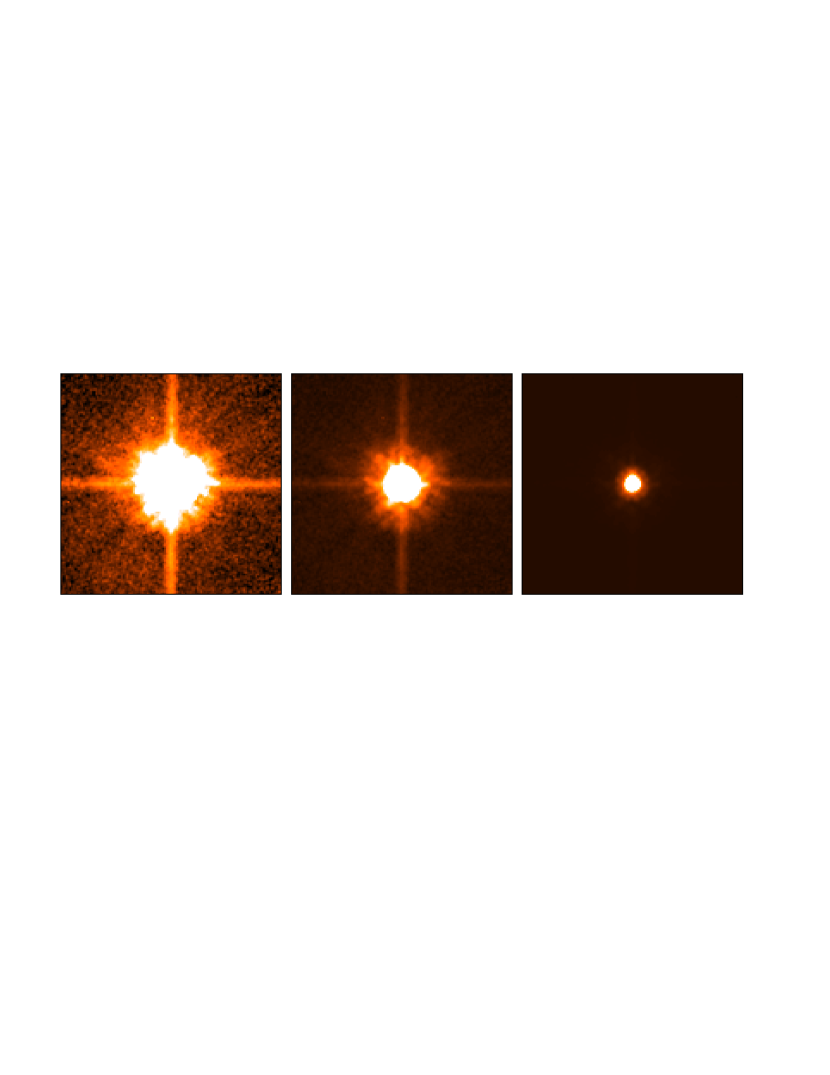
Compared to ground based telescopes, the point spread function (PSF) of ACS is very stable in time. However, coma, astigmatism and defocus from surface height variations of the two CCDs lead to variations over the field of view that need to be taken into account. The variations are much weaker than for the WFPC2 camera but remain non-negligible. Also the ‘breathing’ of HST changes the focal length which leads also to a small time variability in the PSF. In Figure 2 we show the mean ACS PSF compiled from 500 stars in the extensive gems area and the variation of the PSF over the FOV.
The variations were also investigated by Krist & Hook (2003) from the crowded field of 47 Tucanae. Such an analysis was not possible for individual gems fields due to the small number of stars (10) per field. Thus a simultaneous characterisation of the spatial and temporal variations was not possible. However, since the spatial variations dominate (further details of our investigations of the ACS PSF variations will be given in a dedicated technical paper, Jahnke et al. 2004, in prep.) we used the large number of unsaturated stars in the gems area to construct an empirical PSF individually for each object. At a given position we combined the nearest 35 undisturbed stars to create a position-specific PSF estimate. In this way we average over time, but only stars from a radius were used, and PSF shape errors due to spatial variation were minimized, while a very high S/N was achieved for each of these PSF estimates. Finally, the subimage of each AGN and its connected PSF were registered to a common centroid.
From our PSF analysis we found that while coherent large-scale variations were essentially absent within each stack of 35 PSF stars, there was still considerable mismatch between the individual stars, in particular in the central pixel regions. As such mismatched pixels could be spuriously assigned to a host galaxy, we took the variations within each PSF stack to derive rms frames describing an inherent PSF uncertainty; these were then also included in the variance images, artificially reducing the weight in the inner pixel regions. PSF rms errors per pixel range from up to 30% in individual pixels inside 1 FWHM to 5–15 % inside , and to generally below 5% outside.
3.3. Peak scaled PSF subtraction
For luminous AGN at high redshifts, separating the galaxy image from the nuclear point source is a daunting task. Even with a very good knowledge of the PSF, the problem is still that the relative scalings of galaxy and AGN are not known a priori. In fact, one cannot even be certain that the host galaxy is detectable at all and not swamped by the central point source. We therefore started out with the well-established technique of simple PSF subtraction.
In each case, the PSF was scaled to the central flux of the AGN, integrated inside a circular aperture of 4 pixel (012) diameter centered on the nucleus. This radius encircles approximately 34% of the total energy of a point source. A smaller radius (e.g. 1 pixel) would become too sensitive to shot noise and PSF mismatch, while larger radii contain a significantly higher fraction of the total flux (50%/60%/70% at 3/4/5 pixel radius) and thus would make a detection of any host galaxy component successively harder.
This procedure somewhat oversubtracts the nuclear component by an amount corresponding to the underlying host galaxy contribution inside the encircled region. However, this method yields strictly conservative estimates the host galaxy flux, i.e. always unserestimating it. We used extensive simulations to determine correction factors for this oversubtraction (see Section 3.6). The peak-scaled PSF subtraction method has the advantage of being independent of any assumption about the host galaxy morphology.
3.4. Two-dimensional deblending
As a second method we employed the modelling package galfit in Version 1.7a (Peng et al., 2002) that allows the simultaneous fitting of several two-dimensional components to an image, convolved with a given PSF. We describe our application of galfit to quasar images in Sánchez et al. (2004) in detail.
In total we ran galfit in three configurations, always fitting two components, which were the point-source nucleus and either an exponential disk (Freeman, 1970), a de Vaucouleurs spheroid (de Vaucouleurs, 1948), or a Sérsic (1968) model with the Sérsic index as a free parameter. However, simulations (Sect. 3.6) showed that with the present data, the galfit version used111The galfit version 1.7a was recentering the PSF to given coordinates using a convolution with a narrow gaussian, not by shifting the PSF by means of rebinning to a new position. The latter is better for the application to AGN decomposition and is now incorporated in later versions of galfit. was operating near its limit, due to the very high contrast between nuclei and host galaxies. In the context of this paper we thus used galfit only as a cross-check on the peak subtraction method.
3.5. Detection sensitivity
To determine the limits for detecting host galaxies we constructed a sample of 200 randomly selected unsaturated stars, 100 in each observed band, to mimic unresolved quasars. This way we could investigate how our nucleus-removal techniques responded to a undetectable host galaxy, and we could set limits on the size and shape of expected residuals, thus lower flux limits for detectable host galaxies. For these stars the PSFs were created in exactly the same way as for the AGNs. The object itself was always excluded in the PSF production thus each test star and its PSF were fully independent.
This set of simulated ‘naked quasars’ showed that in 88% (97%) of all cases, any residuals – which could be taken as spurious (g)host galaxy detections – had fluxes of less than 5% (10%) of the total object flux. From this we adopted the condition that a real detection should show a residual flux after peak subtraction of at least 5% of the total flux, corresponding to a maximum nucleus-to-host ratio of 20. Because of the systematic oversubtraction inherent in the procedure corrections for the flux have to be applied (see next section).
The final decision if a host galaxy is resolved is based on this criterion. In addition we visually inspected whether the detected flux indeed came from a host galaxy or whether other, unmasked structures were present, using the peak subtracted images and radial profile. If this could be ruled out we classified a host galaxy as detected.
3.6. Systematic offsets and errors
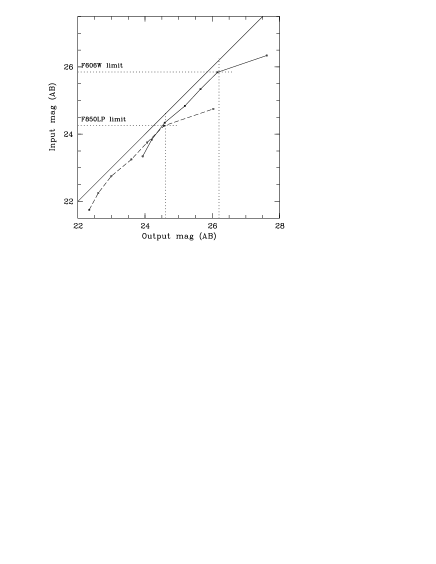
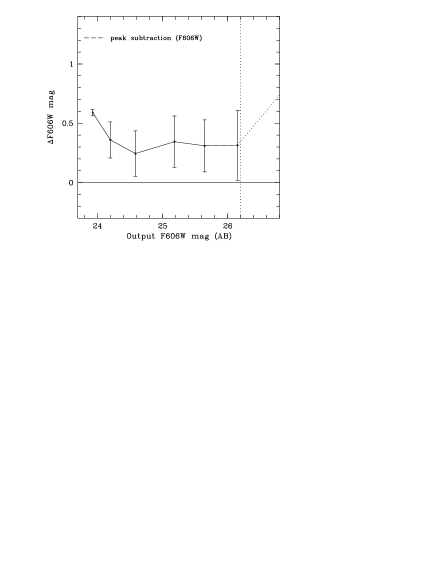
While the mere detection of an AGN host galaxy can be achieved with comparably little effort, the determination of flux error bars and systematic offsets is much more complicated. We performed extensive simulations of artificial quasar images, composed from empirical PSFs and host galaxy models plus artificial noise matching the actual flux and noise distribution in real images. These simulations are described in detail by Sánchez et al. (2004). We applied the peak subtraction nucleus removal as well as galfit to a set of 2000 quasar images created in this way. Comparing input and output parameter values yielded mean magnitude offsets as well as statistical errors for the individual host galaxy magnitudes (Fig. 3).
The simulations give reliability regions and error bars. The left panel in Figure 3 shows which magnitudes are recovered for a given synthetic host galaxy. Since the input set covers a large range of different morphological configurations, scale lengths, nucleus-to-host ratios, etc., the recovered values will scatter. Close to the detection limit, the scatter and the corrections grow rapidly as a function of magnitude; additionally, the ability to differentiate between different morphological types will generally be lost. The combination of these effects is reflected in the spread of the output of the simulations. This measured spread is a direct estimate for the uncertainties of the total flux (right panel in Figure 3).
From these simulations we adopt approximate regions in brightness where host galaxy magnitudes can be reliably determined, with correction of 0.25 to a maximum of 0.6 mag. These regions go down to , for the peak subtraction method and the present data. Outside the corrections and errors increase. In three cases, marked in Table 2 with ‘?’ in column , the observed magnitudes extend to outside these regions; here we continue using the derived corrections for these three objects, but the so derived host galaxies are more uncertain and their magnitudes should be taken with care. Notice that the F850LP band data are substantially shallower than the F606W band, mainly a consequence of the ACS detector sensitivity.


4. Results
4.1. Detected host galaxies
Using the above criteria for detecting a residual host galaxy, we find nine of the 23 host galaxies to be resolved in both bands, although some lie close to the sensitivity limit. One object formally fell above the 5% level in one band but not the other; combo-17 33630 at might be marginally resolved in F850LP and shows a structure at 1″distance that might be a tidal arm or a foreground object. With this object lying at the highest redshift of the sample we do not consider this a clear detection. As mentioned, for three further cases in the F850LP band the host galaxies are very faint (marked with a ‘?’ in the column in Tab. 2). While their flux is above 5% of the total, their raw magnitudes fell 0.8–1.0 mag outside the reliability region where corrections and associated errors are still small. This low S/N is also reflected in the radial profiles (see Appendix A).
As described above, tests with field stars show that 12% of all objects (3 objects) might show spurious ‘host galaxies’ at the 5% flux level, and 3% (0 or 1 objects) at the 10% flux level. In F606W five of our objects fall with their host fluxes between these two values. In the F850LP-band these are four which include the three uncertain ones from above. According to statistics 1–3 of these might be spurious detections. However, including or excluding these more uncertain data points in the following analysis does not have an influence on the conclusions drawn.
For each object the host galaxy flux was determined by simple aperture photometry after subtraction of the scaled PSF, excluding resolved companion objects. The radius of the aperture was matched the used image size.
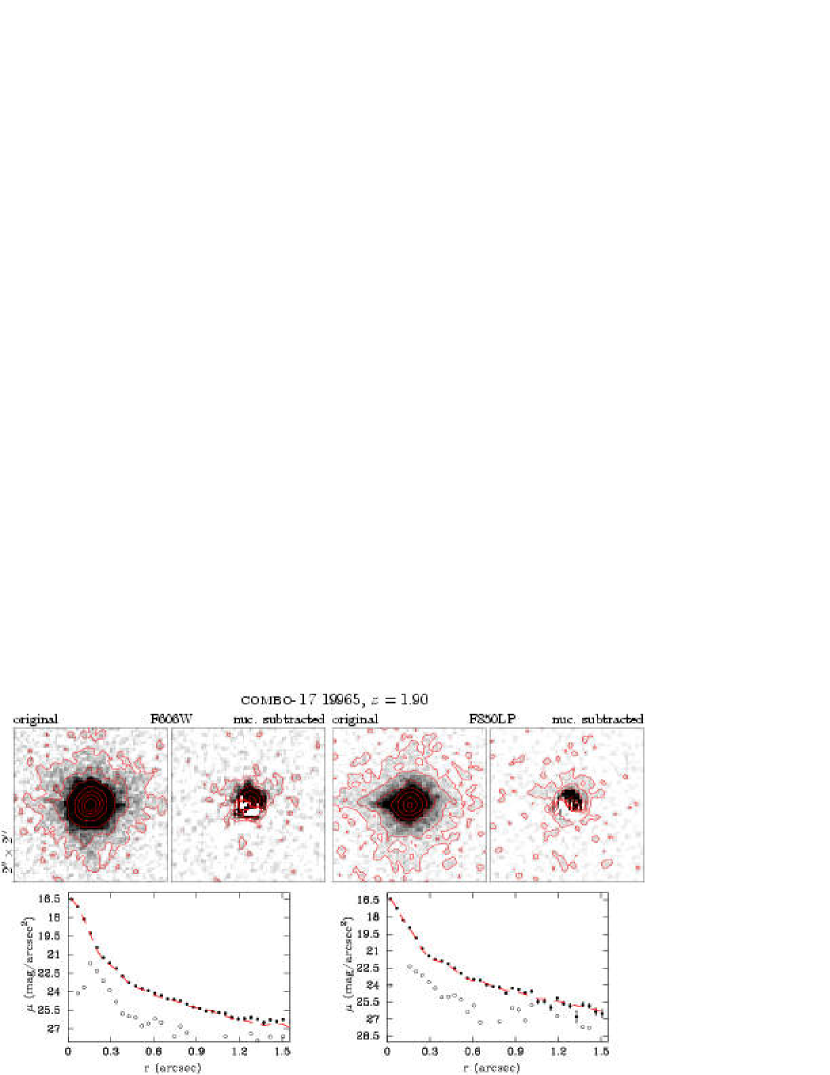
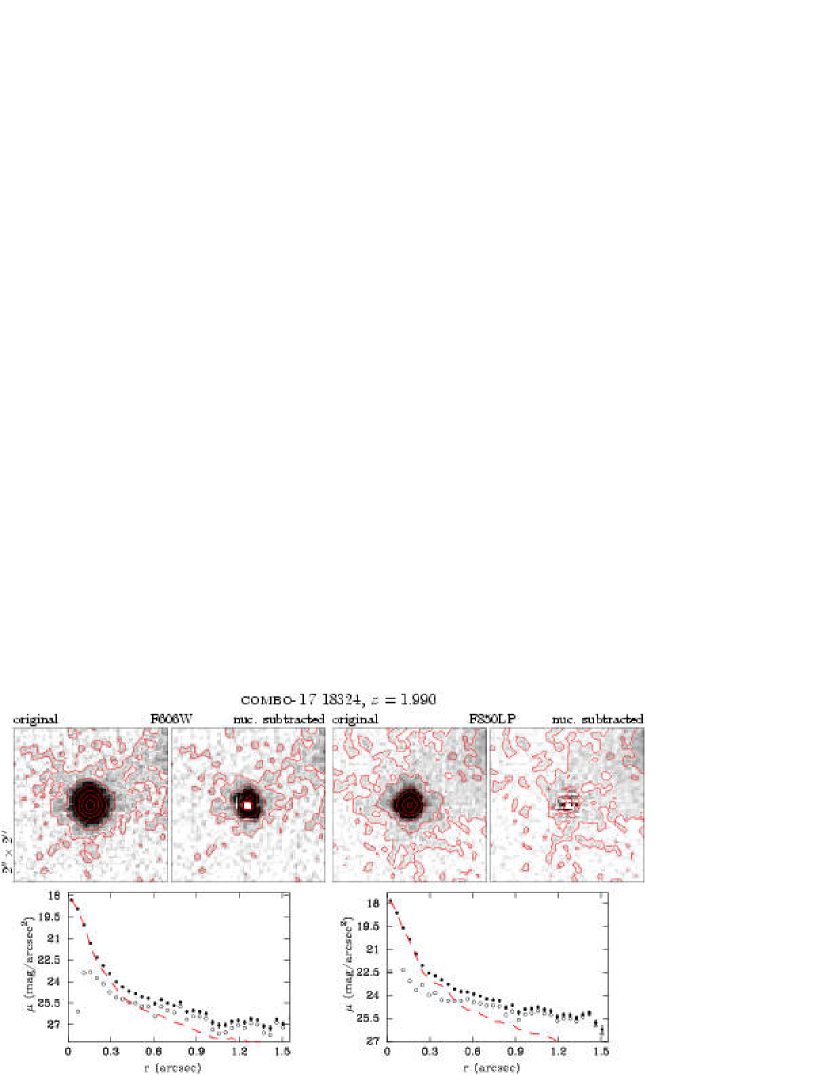
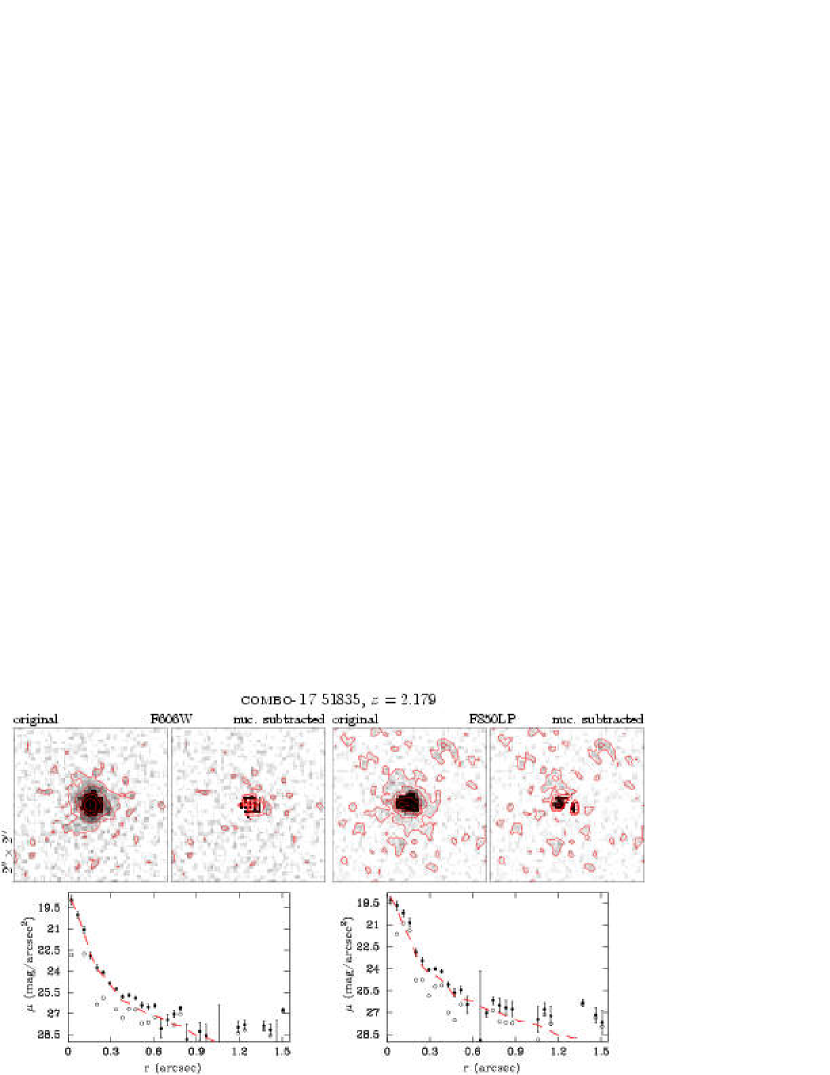
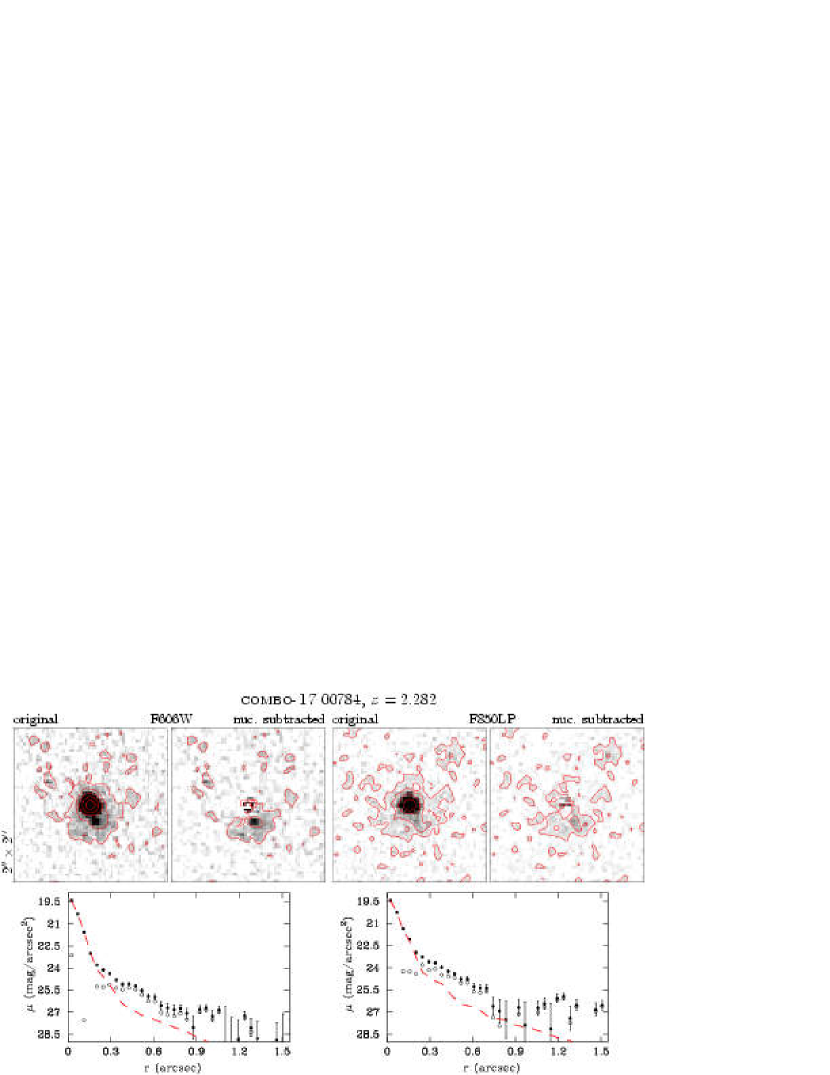
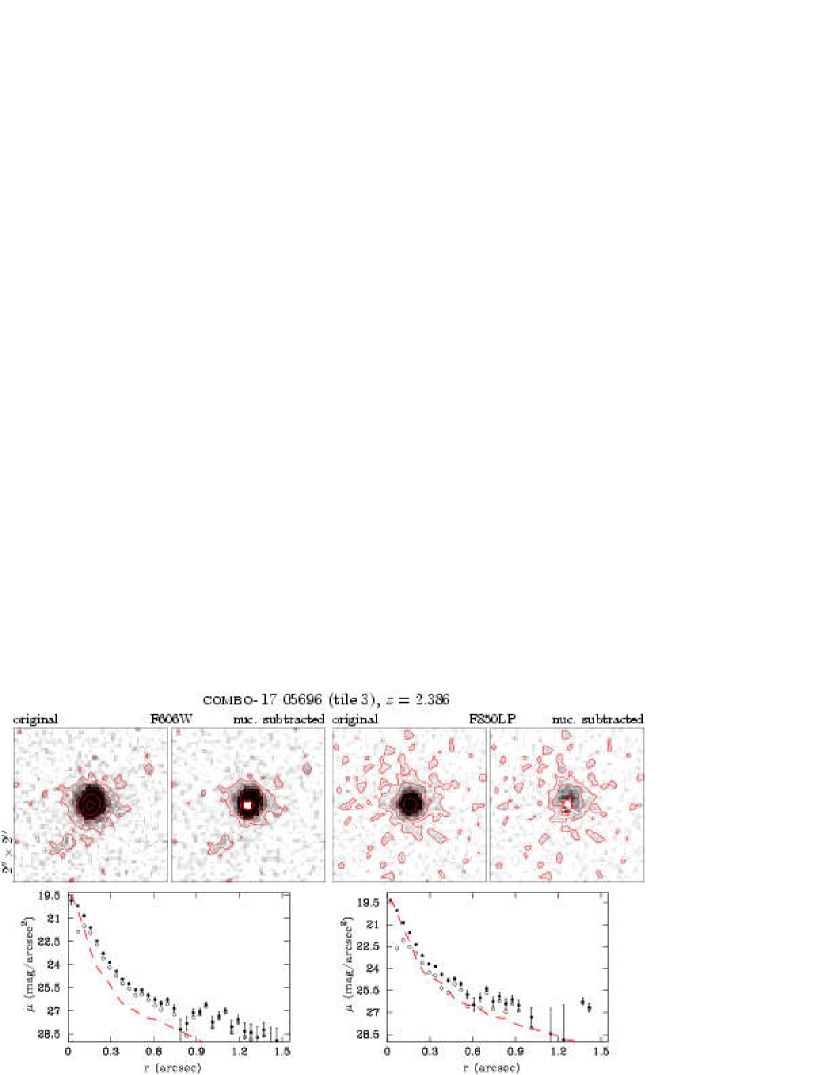
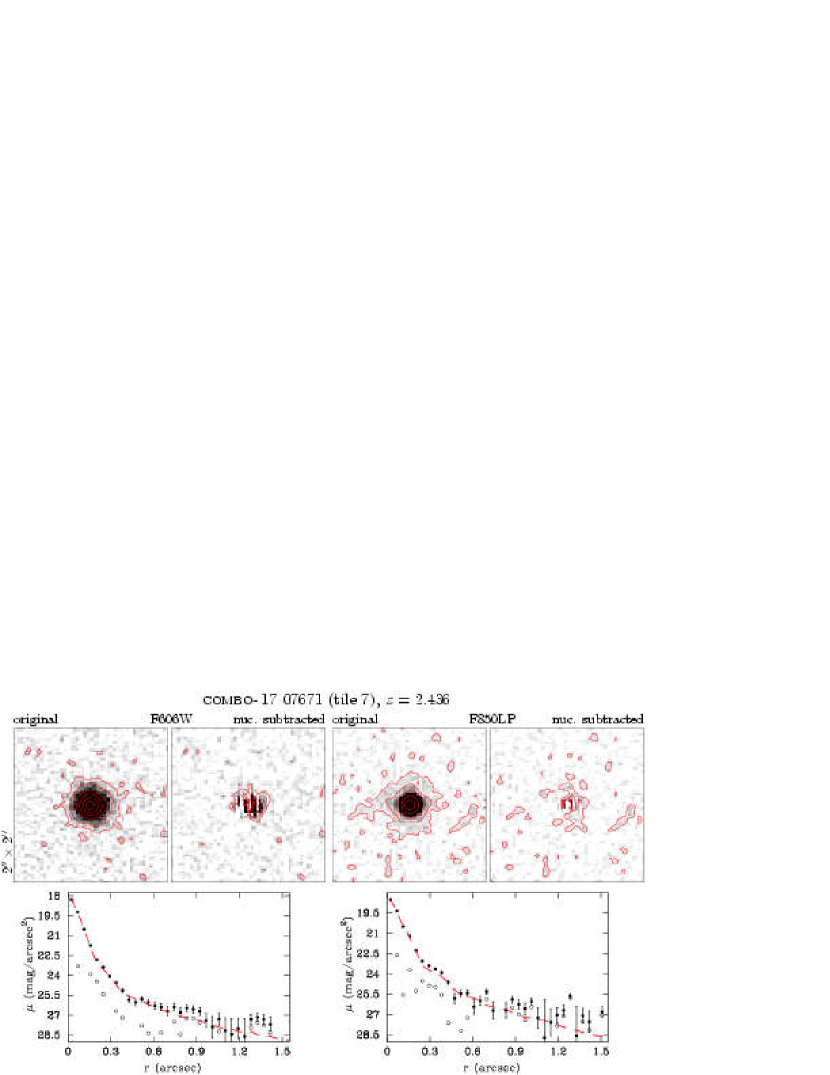
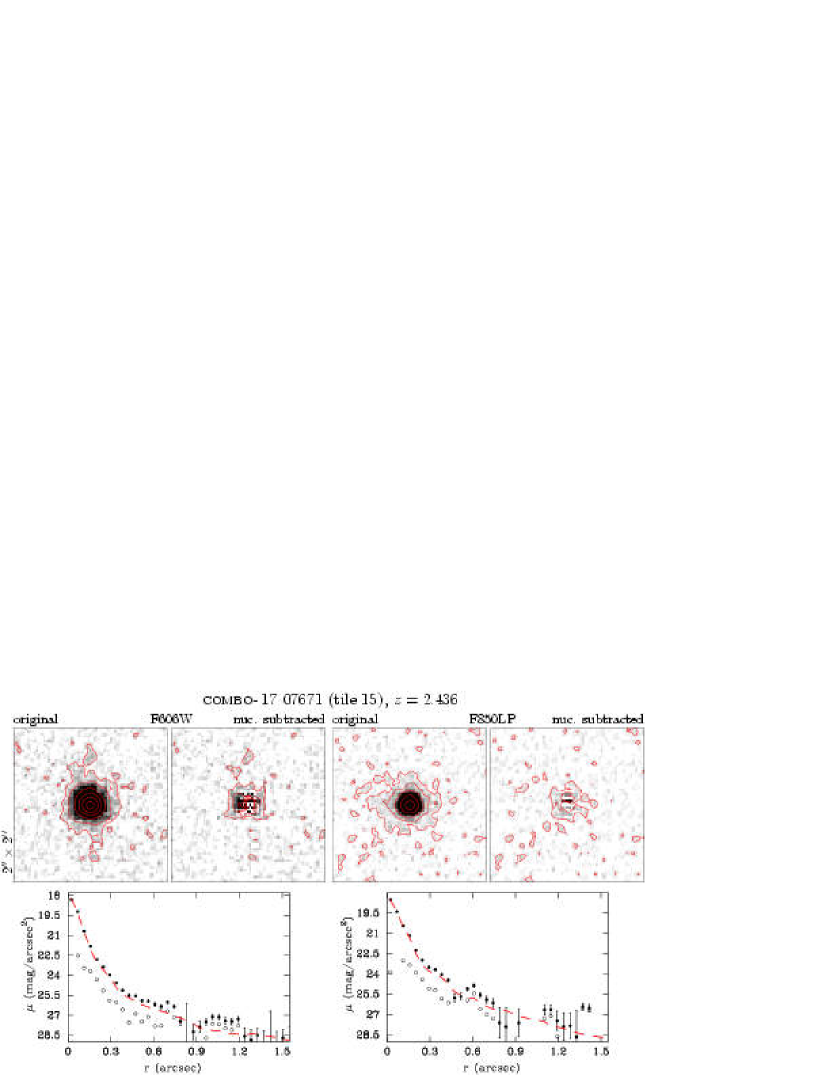
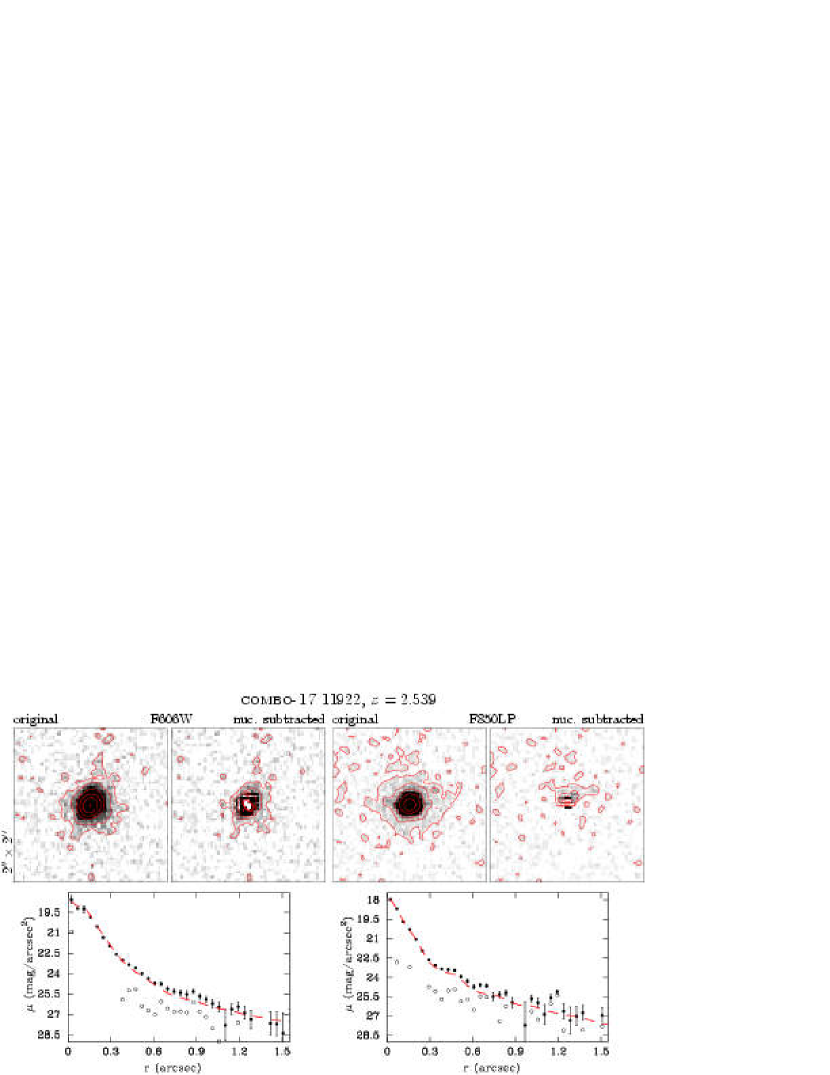
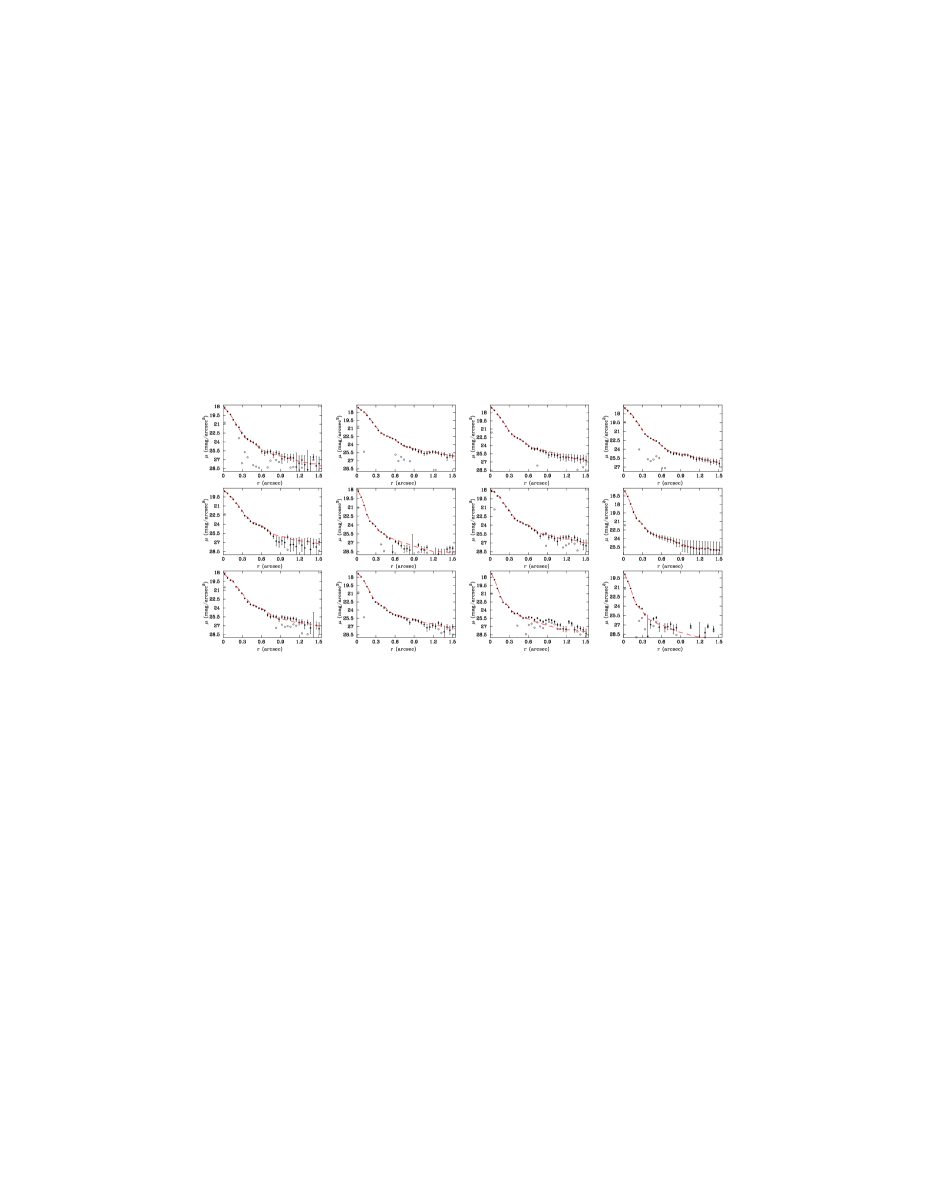
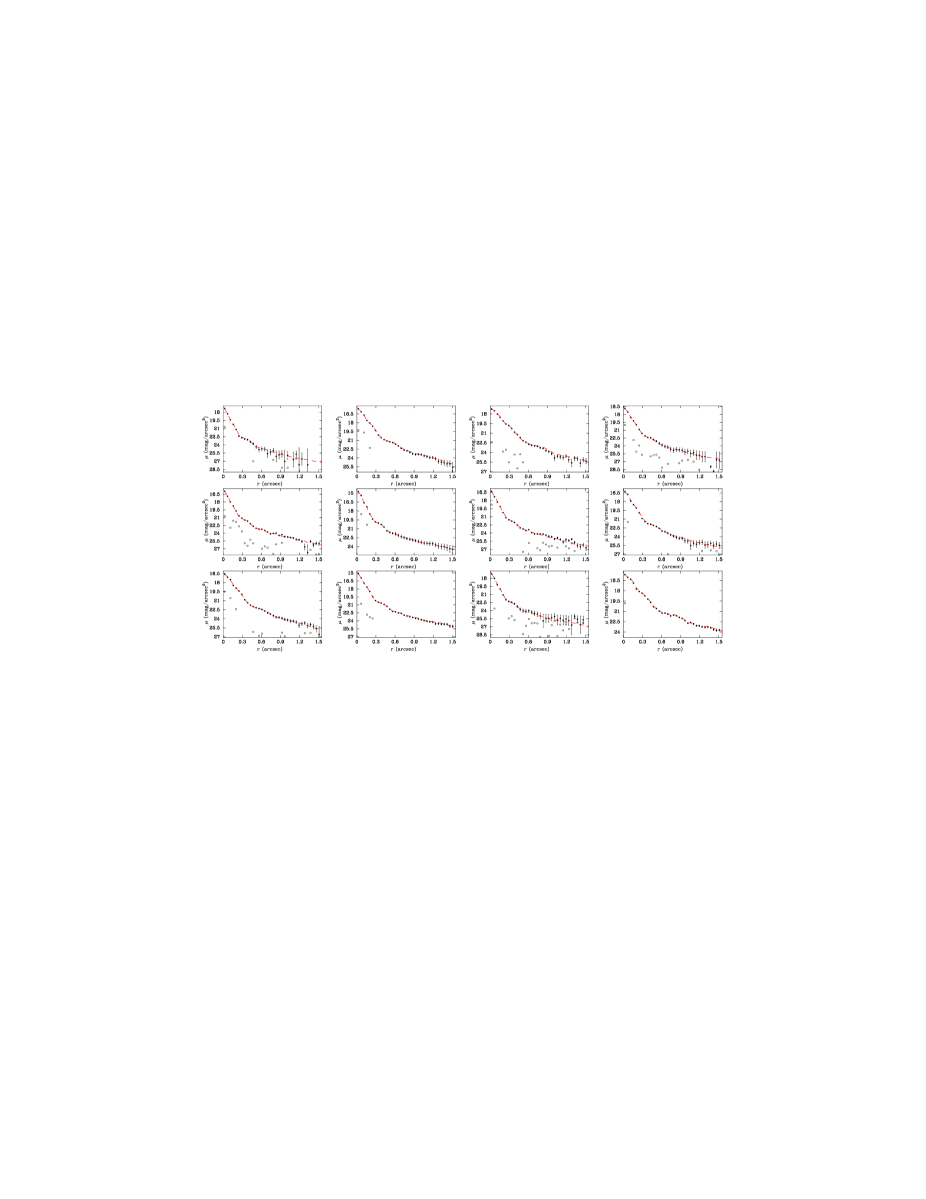
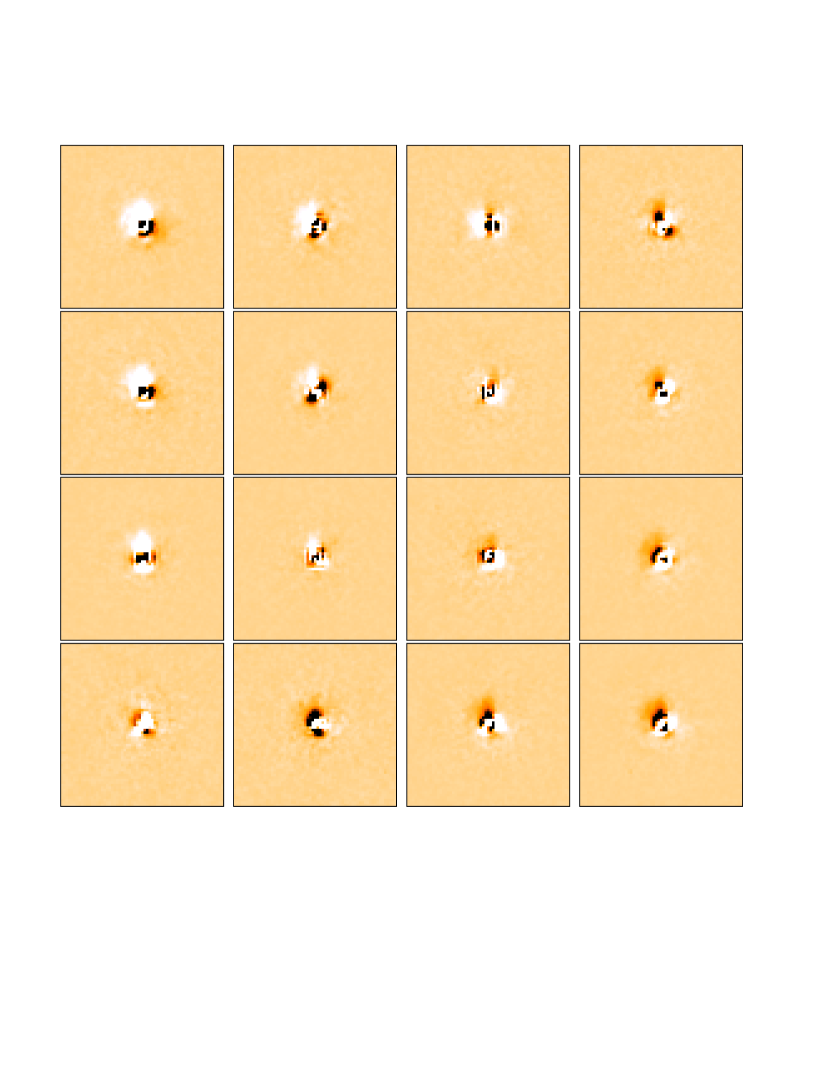
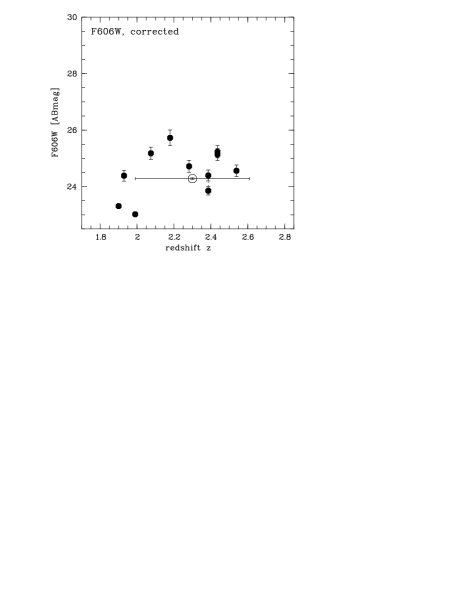
All extracted magnitudes are collected in Table 2, and shown together with the upper limit for the unresolved objects in the top panels of Figure 4. The extracted host galaxy images and radial surface brightness profiles are shown in Fig. 11 in the appendix. To illustrate the behaviour of true point sources, we included a selection of 24 field stars, 12 each in the F606W- and F850LP-band (Figures 12 and 13), that were subjected to the same PSF determination and peak subtraction as described in Section 3.5. We plot the same profiles as for the AGN. This selection is random apart from the fact that the 24 stars were observed on 24 different tiles. For most of the stars there is no systematic positive residual flux visible, as expected. The few that do show positive fluxes form the spurious detection statistic described above.
While with deeper images or at lower redshift (Sánchez et al., 2004) the morphological appearance of the host galaxies can be determined, this was generally not possible for the present data. Apart from the extentions in combo-17 00784, apparent residual structure visible in the colour images shown in the Appendix is dominated by the PSF subtraction procedure. This includes elongations and apparent off-centering that is due to limited centering precision of the order of 0.05–0.1 pixel (see e.g. combo-17 05696 from tile 2). Thus we adopted the host galaxy morphological class in all cases as ‘undecided’, and then applied the systematic corrections for oversubtraction provided by the simulations (Fig. 3). The corrections were typically of the order of mag, as documented by the columns with ‘cor’ subscripts in Table 2. Here we also list the estimated uncertainties resulting from our extensive simulations. The distribution of corrected magnitudes is displayed in the lower panels of Figure 4.
4.2. Detecting the undetected hosts
For 14 AGNs we find that the individual PSF-subtracted residuals are consistent with non-detections, i.e. the magnitudes of individual host galaxies lie below the 5% limit. These objects are marked by arrow symbols in Figures 4 and 8. It is interesting to note that these flux limits on the hosts are by no means all outstandingly faint. For many, the reason why they were not detected is the high contrast with the AGN which for these objects has above average brightness. Only three objects show non-detections that indicate exceptionally faint host galaxies. We will further discuss the implications of the detection limits in Section 5.1.
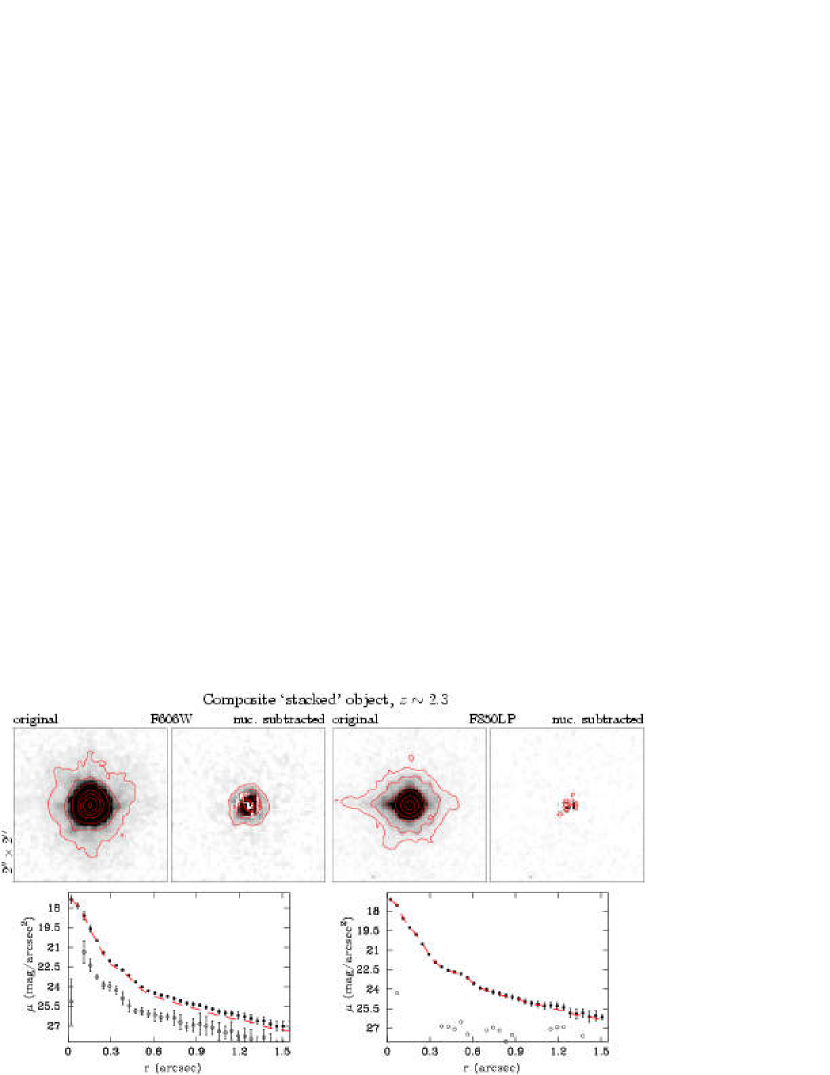
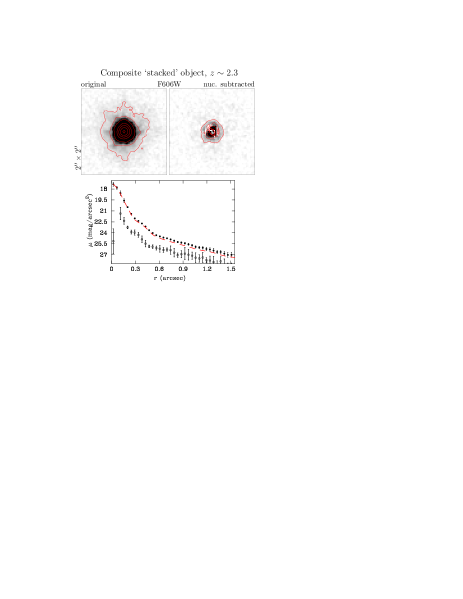
In an attempt to assess at least the mean host galaxy properties of the unresolved AGN, we simply coadded the images of all 14 objects, one of which was observed in two frames. This yielded a very deep image with effectively 15 orbits of integration time. We also combined their PSFs, weighted by the relative flux of the AGNs, and created combined variance and PSF rms frames. The higher S/N in combination with the lower PSF noise (PSF and AGN position are sampled at 14 different subpixel points) yields a nominal increase in surface brightness sensitivity of 1.5 mag. The resulting ‘object’ has a mean redshift of (weighted by AGN flux), and total magnitudes of and , respectively. This image is shown in Figure 5. With the higher sensitivity we now indeed find a host galaxy component in the F606W-band image after PSF subtraction of 4.4% of the total flux. The radial surface brightness profile also shows a small excess over an unresolved point source. In both cases this flux is highly significant as we confirmed using a bootstrap simulation for the composition of the coadded frame from the 15 frames. In the bootstrap simulation we constructed 100 new sets of 15 frames each, drawn with repetition from the original 15 frames, coadded the images in each set and did the flux analysis as above. The uncertainty in the total flux estimated from these 100 realisations is % of the total flux, or 25% in host galaxy flux. All realisations yielded substantial positive fluxes. The error is resulting from a combination of PSF uncertainty and the noise inside the scaling aperture of 4 pixel diameter. We show the uncertainties in the radial surface brightness determined from bootstrapping as error bars for the derived host galaxy in Figure 5. The so extracted magnitudes for host galaxy and nucleus in the F606W-band are listed in the last row of Table 2 (the ‘stack’ object). The F850LP-band stack, however, with its lower sensitivity showed a much weaker signal than the F606W-band, too faint to reliably be classified as resolved.
| ID | Tile | aaTotal magnitude of the object. | bbRaw measured host galaxy magnitude. | ccHost galaxy magnitude corrected for oversubtraction. | ddCorrected nuclear magnitude. | N/HV,coreeNuclear to host galaxy flux ratio. | aaTotal magnitude of the object. | b,b,footnotemark: ffObjects marked ‘?’ lie outside the adopted reliability region (see text). | ccHost galaxy magnitude corrected for oversubtraction. | ddCorrected nuclear magnitude. | N/HZ,coreeNuclear to host galaxy flux ratio. |
|---|---|---|---|---|---|---|---|---|---|---|---|
| 19965 | 23 | 20.59 | 23.9 | 23.3 | 20.7 | 11.3 | 20.29 | 23.8 | 23.5 | 20.4 | 17.5 |
| 30792 | 82 | 21.60 | 24.6 | 24.4 | 21.7 | 12.0 | 22.06 | 24.2 | 23.9 | 22.3 | 4.2 |
| 18324 | 19 | 22.00 | 23.6 | 23.0 | 22.5 | 1.6 | 21.33 | 22.7 | 22.4 | 21.9 | 1.6 |
| 05498 | 01 | 22.91 | 25.5 | 25.2 | 23.1 | 7.1 | 22.28 | 25.0? | 24.4 | 22.5 | 6.0 |
| 51835 | 55 | 23.01 | 26.0 | 25.7 | 23.1 | 11.2 | 22.41 | 23.8 | 23.4 | 23.0 | 1.6 |
| 00784 | 05 | 23.28 | 25.0 | 24.7 | 23.6 | 2.8 | 22.80 | 24.0 | 23.7 | 23.4 | 1.2 |
| 05696 | 02 | 22.73 | 24.7 | 24.4 | 23.0 | 3.6 | 22.32 | 23.8 | 23.5 | 22.8 | 1.9 |
| 05696 | 03 | 23.14 | 24.2 | 23.9 | 23.9 | 0.9 | 22.68 | 24.0 | 23.7 | 23.2 | 1.6 |
| 07671 | 07 | 22.35 | 25.6 | 25.2 | 22.4 | 13.2 | 22.24 | 25.0? | 24.4 | 22.4 | 6.3 |
| 07671 | 15 | 22.36 | 25.5 | 25.1 | 22.5 | 11.9 | 22.22 | 24.6 | 24.3 | 22.4 | 5.5 |
| 11922 | 11 | 22.65 | 24.9 | 24.6 | 22.9 | 4.8 | 21.93 | 25.2? | 24.5 | 22.0 | 9.3 |
| stack | 21.47 | 24.9 | 24.3 | 21.6 | 12.3 | 21.60 | unresolved | ||||
| ID | Tile | aaGalactic extinction corrected. | SFR F606W | |
|---|---|---|---|---|
| []bbStar formation rates inferred from the UV flux in the observed F606W-band. | ||||
| 19965 | 23 | 1.90 | –0.2 | 11 |
| 30792 | 82 | 1.929 | 0.5 | 4 |
| 18324 | 19 | 1.990 | 0.6 | 15 |
| 05498 | 01 | 2.075 | 0.8 | 2 |
| 51835 | 55 | 2.179 | 2.3 | 1.5 |
| 00784 | 05 | 2.282 | 1.0 | 4 |
| 05696 | 02 | 2.386 | 0.9 | 6 |
| 05696 | 03 | 2.386 | 0.1 | 9 |
| 07671 | 07 | 2.436 | 0.8 | 3 |
| 07671 | 15 | 2.436 | 0.9 | 3 |
| 11922 | 11 | 2.539 | 0.1 | 5 |
| stack | 2.3 | 6 |
5. Discussion
5.1. UV colours
From the corrected magnitudes we have derived colours for the detected host galaxies. These are listed in Table 3, now including also correction for Galactic dust extinction. However, with (Schlegel et al., 1998) these values of and negligibly affect the colours.
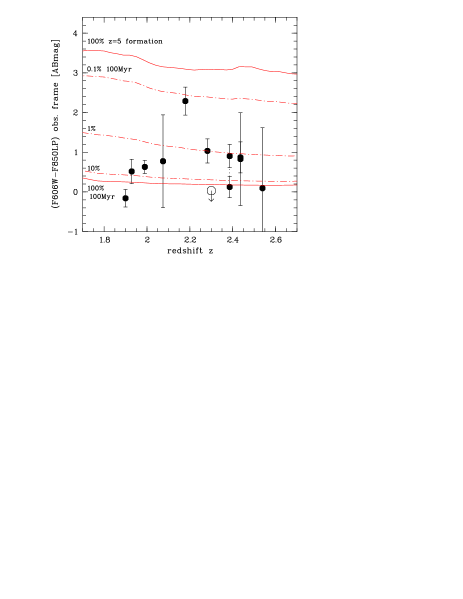
At these redshifts, the observed photometric bands correspond to the rest frame ultraviolet, ranging from 2160 Å at to 1616 Å at in F606W and 3150 Å to 2350 Å in F850LP, respectively, so for this redshift range pure rest-frame UV colours are observed. Figure 6 shows the measured values plotted against . There is no discernible colour trend with redshift. All points fall within a relatively narrow range of colours; apart from combo-17 51835, the objects occupy a band of . The open symbol represents our stacked ‘average’ AGN constructed from the 14 unresolved objects. Although it was not resolved in the F850LP band, the upper limit on its colour is actually consistent with the values derived for several of the detected objects.
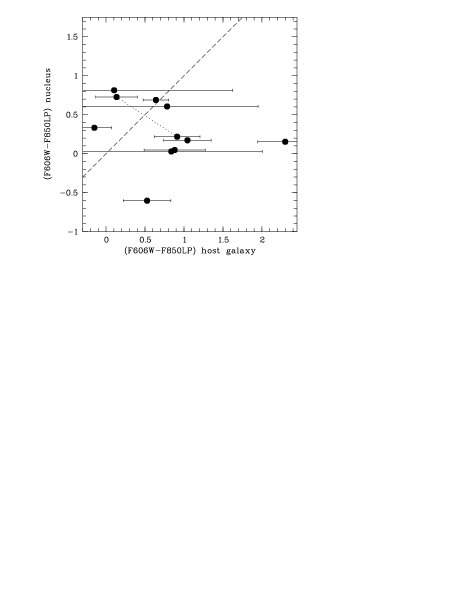
One critical issue in measuring UV luminosities of barely resolved AGN hosts is the lingering possibility that flux may have spilled over from the nuclei. This could have happened as a purely observational artefact due to imperfect PSF removal, or physically by scattering of UV photons off dust in the the host galaxy. The latter phenomenon is known to be relevant in high redshift radio galaxies (Vernet et al., 2001). Independently of the underlying mechanism, any such cross-contamination should be visible in a correlation of host galaxy with nuclear colours. Figure 7 shows these colours plotted against each other. No correlation is visible and we conclude that a substantial contamination of the host galaxy light from the AGN is very unlikely. Notice also that when considering physical scattering in the hosts, powerful radio galaxies are huge massive entities of generally vastly different appearance compared to the relatively modest AGN hosts featuring in our sample.
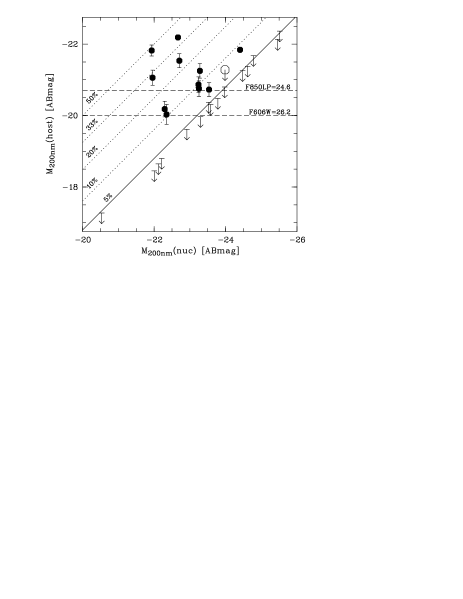
UV colours can be converted to UV spectral slope independent of redshift, when assuming that the SED can be described in the form . With known, the absolute magnitude at 200 nm, , can be computed directly from the F606W- or F850LP-band apparent magnitudes. We do this for both the host and the nucleus and these values are shown for the full sample including upper limits in Figure 8, which illustrates the two main constraints for resolving a host galaxy, apart from compactness (see Sect. 4.2). The reliability of host galaxy photometry is constrained by S/N, thus dependent on the filter which have different depths. This is marked by the horizontal dashed lines which show the magnitude of host galaxies at the mag and mag edges of the adopted regions of reliability (see Section 3.6), at mean redshift and mean .
As the second effect the maximum nucleus–host contrast appears as the scatter of the unresolved objects around a line shifted by 3.2 mag from unity, corresponding to 5% of the total flux. Here the scatter is only induced by the assumption that all unresolved host galaxies have a the value the upper limit determined for the stacked image. The diagonal dotted lines mark lines of 10%, 20%, 33% and 50% of the total flux associated with the host galaxy. Thus in total the region right of the solid diagonal line is inaccessible to host galaxy detection with the current data and method of analysis. We would like to emphasise that the similarity of nuclear properties for resolved and unresolved host galaxies suggests that also the host galaxy properties are similar – thus supporting that the data point for the coadded stacked object is not far off the individually resolved objects in all plots.
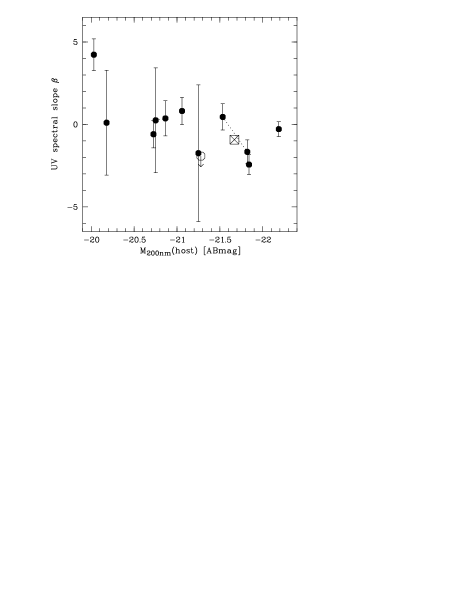
In Figure 9 spectral slope is plotted against for the host galaxies, compared to the mean value for a sample of 794 Lyman break galaxies at redshift (Shapley et al., 2003), all values uncorrected for the influence of dust in the galaxies.
The slight anticorrelation that seems to be visible between and UV luminosity suggest that the more luminous host galaxies are having the steeper spectral slopes or bluer colours. This would mean that more luminous host galaxies had bluer colours and thus more UV light from young stars. To test this we computed the Spearman rank-order coefficient for this data set. The test gave a probability for the zero hypothesis – uncorrelated data – of 9%. Thus the zero hypothesis can not even be rejected on a 2 level and thus the anticorrelation is not significant.
A few of the most UV-luminous host galaxies fall into the same magnitude–colour regime as the LBGs, while a number of objects are substantially redder. Thus we do not find a positive correlation of the amount of host UV light and luminosity.
5.2. Origin of the host galaxy UV flux
The top solid line in Figure 6 shows the theoretical colour of a galaxy that formed all its stars at and evolved passively afterwards. This colour was computed from single stellar population (SSP) models taken from Bruzual & Charlot (2003). The assignment of solar metallicity in this context is arbitrary and subject to discussion (see below). However, qualitatively there is no strong dependence on metallicity, the exact formation redshift or the particular choice of IMF for a given model family (Salpeter 1955 or Chabrier 2003) in this wavelength range.
This comparison shows that the measured UV colours of our detected AGN hosts as well as of the stacked ‘mean’ host galaxy are markedly bluer than expected for an ‘old’ population at that epoch, i.e. . Any correction for dust in the host galaxies will strengthen this result. Thus the blue light detected in these galaxies must come from relatively young stars. These stars could be forming continuously, in which case the UV luminosities can be interpreted as indicators of the star formation rate in these galaxies. We follow up on this option in the next subsection. Alternatively, the UV flux could be the afterglow of a past starburst. This is the option we consider first.
5.2.1 Recent starburst
Given the unknown dust absorption and metallicities in the host galaxies, a single UV colour is insufficient for performing a detailed age dating of starburst or a decomposition of stellar populations. However, we want to compare to the available theoretical colour range spanned by galaxy formation at and a very recent (100 Myr) starburst to illustrate how mixing of an old underlying population with most of the mass and a recent starburst influences the colour. In Figure 6 the solid lines mark these extremes. In between these the dot-dashed lines show how contribution of a 100 Myr component would influence the colour of an otherwise old population. From top to bottom 0.1%, 1% and 10% in mass are added to the old population. There is a strong degeneracy between the choice of burst age and the mixing ratio. For 10 Myr less than one tenth in mass is required to produce the same UV colour compared to 100 Myr. If we choose 100 Myr as a timescale similar to the dynamical timescale in galaxies, the masses involved in that starburst would be of the order of a few percent of the total stellar mass.
For the assumption of only one single-aged population we can rule out a very high formation redshift – corresponds to ages of 3.5–2.5 Gyr at – in the chosen cosmology. For the adopted set of models, the resulting age estimates would range mostly between 0.1 and 0.7 Gyr.
We note that the colour tracks in Figure 6 are largely flat over the redshift range of interest, and that the two pure population and the different mixing ratios correspond to different colours almost independently of . Since our measured colours are all quite similar, we conclude that the luminosity weighted ages of the the UV-dominating stellar population must be rather similar, unless younger ages and more reddening in some objects conspire.
Clearly, a single UV colour is insufficient to perform a reliable age dating, with all broad band colours being affected by various degeneracies with respect to dust and metallicities. However, we have reason to believe that at least the central lines of sight towards the AGN are reasonably free of dust extinction (because the AGN sample is selected by optical/UV flux), and we therefore do not expect dust to play a major role. At any rate, significant dust extinction would make the host galaxies intrinsically bluer than what we observe. On the other hand, assuming a metallicity lower than solar would shift all curves in Figure 6 downward, resulting in older age estimates. Reducing the metallicity to (1/5 solar) gives an single burst age increase by a factor of two (for Bruzual & Charlot models). We conclude that if the UV light in our host galaxies is emitted by a passively evolving population of young stars, this population is typically much younger than a Gyr.
The diagram in Figure 8 shows that no correlation exists between the amount of stellar UV light from the host galaxies and the amounts of UV radiation produced by the nuclei. If the latter is taken as a measure of the amount of matter accreted by the nuclei then in the context of a recent starburst the size of the starburst and the amount of accreted matter must be governed by different mechanisms. If the accretion rate is primarily defined by the nuclear mass, and a correlation between galaxy and black hole mass is assumed, then the size of the starburst is independent of the bulk stellar mass of the host galaxy. Other factors must be dominating the amount of (gas) mass involved in the starburst. This can be either the total amount of gas available in the galaxy, the size of the region involved in the starburst, the strength of an interaction responsible for the starburst, etc. In any case the amounts of gas involved are variable for a given nuclear luminosity. Including the upper limits in Figure 8 the host luminosities span e.g. 4 mag at , i.e. the amount of gas involved can vary by a factor of or more.

5.2.2 Estimating a host star formation rate
We now interpret the detected UV emission in the alternative framework of being due to young stars forming continuously in the AGN host galaxies. Under this assumption it is possible to estimate the star formation rate (SFR) of the host galaxies from the measured rest frame UV luminosities. Following Kennicutt (1998) and using the conversion of AB magnitudes into monochromatic fluxes we obtain
where is the luminosity distance to the AGN in cm, and is the observed UV magnitude at an arbitrary wavelength between 1500–2800 Å. With this formula we can now convert our F606W band luminosities (which are much deeper than the F850LP band data) into star formation rates. As long as intrinsic dust attenuation is neglected, these values are of course mere lower limits.
The resulting SFR values are listed in Table 3 and generally amount to a few solar masses per year, with remarkably little variation. The maximum value found is 15 , and the mean is 6 , including the results from the stacked image of individually unresolved host galaxies. This value is thus representative for the full sample of 23 AGN. We show the distribution of star formation rates vs. redshifts in Figure 10. No trend emerges, consistent with the previously established observations that neither colours nor luminosities show any significant trend with .
This is again compared to the star formation rates for LBGs at from Erb et al. (2003), as determined from the UV flux and uncorrected for dust. There are a few host galaxies with higher UV flux while for the majority it is smaller by a factor of 2–3.
However, there is a principal caveat in our guiding assumption of this subsection: The UV light from galaxies with strong ongoing star formation is expected to be totally dominated by the youngest stars. Kennicutt (1998) pointed out that the spectral shape of galaxies with a constant SFR over at least Myr is basically flat (in ) between 1500–2800 Å, assuming a Salpeter (1955) IMF. This would lead to an expected UV colour for our objects of or spectral index , more or less independently of redshift (within the range of our sample), inconsistent with our observations for most objects (see previous subsection, Figure 6 and Table 3). In other words, most detected host galaxies of our sample have UV colours that are too ‘red’ for a simple continuous star formation scenario, while the stacked host galaxy is roughly consistent. If for the resolved hosts the F850LP band fluxes were used instead of the F606W band, SFR values would be higher by roughly a factor of 2.
This apparent inconsistency could be resolved in several ways. The initial assumption could be wrong, and the UV flux originates not from freshly formed stars, but from a passively evolved starburst as outlined in Sect. 5.2.1. The star formation rate might not have been constant over the past, so that varying amounts of stars of different masses and ages would have been formed; such a configuration is always possible, and our only argument against it would invoke Occam’s razor. Finally, as discussed in the previous section, there could be an underlying older stellar population contributing more to F850LP and less to F606W (but note that by sample design, also F850LP is completely below the Balmer jump at all relevant redshifts). This is the scenario that is favoured by our intermediate redshift data from gems (Sánchez et al., 2004).
Clearly, in this study our current data set of just two UV bands is insufficient to settle this ambiguity. However, in all three cases there would be no continuous star formation as inferred for LBGs. The blue light would be a result not of a continuous process but of one or more events in the past of the host galaxy that triggered star formation. Whether galaxy interaction or merger incidents were responsible or the formation of bars or spiral arms is involved can not be investigated with the present set of data.
5.3. Comparison with other AGN host galaxy studies
Even at low redshifts, colour data of AGN host galaxies are relatively scant, except for rather low-luminosity AGN where the host galaxy can be separated with relative ease. In those cases, colours were generally found to be consistent with morphological types, in particular for the prevailing disk-type host galaxies (Kotilainen & Ward, 1994; Schade et al., 2000). However, when higher nuclear luminosities are observed (which generally correlate with a larger bulge component), then a tendency towards abnormally blue colours and younger stellar populations emerges (Kauffmann et al., 2003; Jahnke et al., 2004). This tendency appears to hold also at intermediate redshifts, as demonstrated in our companion HST paper (Sánchez et al., 2004), where we find more than half of the investigated host galaxies to have bluer colours than what would be expected from their morphological types. However, we can not confirm increasing amounts of blue light from young stars with increasing host luminosity as found by (Kauffmann et al., 2003). Our data are consistent with constant UV flux for all hosts.
At high redshifts (), colour information is available only for a handful of objects. In a ground-based study of six bright radio-loud quasars, Lehnert et al. (1992) found indications that the hosts were very blue, actively star-forming galaxies. For three high luminosity quasars, one radio-loud and two radio-quiet, Aretxaga et al. (1998) claimed very luminous envelopes and star formation rates of several hundreds solar masses per year. More recently, Hutchings et al. (2002) presented optical HST observations of three radio-loud and two radio-quiet quasars and found less extreme, but qualitatively similar results.
Because of their high radio power and optical luminosities, many of the quasars observed in previous studies are probably quite different from the moderate-luminosity hosts of moderate-luminosity radio-quiet AGN that we focus on. It is nevertheless interesting to see that the presence of a significantly enhanced UV continuum and young stars seems to be at least qualitatively similar between QSOs of intermediate and high luminosities.
6. Conclusions
We performed the hitherto largest study of host galaxies properties of a complete sample of high-redshift AGN. We detected the hosts and extract colour information in 9 of the 23 AGN, and we also achieved a statistical detection of the host in the remaining 14 from a stack analysis. The UV luminosities can be interpreted in three ways: either as contribution from a passively evolving population of relatively young stars, forming typically 0.5 Gyrs ago, as a mix between a population of old (e.g. ) stars and a small contribution of a recently formed young population (e.g. 0.1%–10% in mass at an age of 100 Myrs or 1/10th of this for age 10 Myrs), or as an indicator of ongoing star formation at a level of 2–15 (uncorrected for internal dust attenuation). While the first possibility is very simplistic and appears unphysical, the UV colours actually favour the two burst interpretations; but the possibility of on-going star formation cannot be completely ruled out from our data.
In the framework of combined old and young populations, it is remarkable how similar the host galaxy colours are within the sample, and, unless different mass–age combinations conspire, hence the estimated stellar mass fractions and ages. The derived young population mass fractions and ages are also very similar to the values estimated in our companion gems study of AGN at (Sánchez et al., 2004), where we find abnormally blue rest-frame colours for a substantial fraction of host galaxies, particularly the most luminous AGN in the sample. Even more, these colours and ages are in turn very close to the mean values obtained from our ground-based low- multicolour sample (Jahnke et al., 2004). While the stellar population diagnostics of Kauffmann et al. (2003) are not immediately convertible into our simple colour indicators, their impressive and highly significant results point in exactly the same direction.
While the results from all these redshift regimes are similar and point to a connection of nuclear activity and the presence of young stars, and that mass fractions of young stars are similar, we always find that a larger range of absolute masses is involved, showing as a range in UV luminosity. Here we find a variation of a factor of 40 for a given nuclear luminosity.
Our host galaxy colours span a range that reaches the colours of Lyman Break Galaxies for a few very luminous hosts, while, as mentioned, the colours of the majority are somewhat redder than these. A comparison of optical/UV properties to the general population of high redshift galaxies would be very illuminating, but large statistical samples only become available in the near future, e.g. from the goods project.
This persistent trend to find AGN to be associated with blue stellar colours is intriguing and suggests a close connection between enhanced star formation and nuclear activity. Additional support for such a connection comes from the detection of submm CO emission in a number of extremely luminous high-redshift QSOs and radio galaxies (Omont et al., 2003), although the current sensitivity of submm telescopes is insufficient to perform this test for less luminous AGN at high .
While the fact that there is a relation can hardly be denied, its physical origin remains obscure. Is the enhancement of star formation a prerequisite for nuclear activity? Is it a simultaneously occurring phenomenon, caused by the same trigger? Or is it a consequence of the AGN? Galaxy merging and interaction are clearly two possible candidates to connect these two phenomena, but neither the only ones nor are the involved physics understood. Much additional data will be required, in particular those helping reliably to reconstruct the star formation history in high-redshift galaxies, before any firm conclusions can be drawn.
References
- Aretxaga et al. (1998) Aretxaga, I., Terlevich, R. J., & Boyle, B. J. 1998, MNRAS, 296, 643
- Bruzual & Charlot (2003) Bruzual, G., & Charlot, S. 2003, MNRAS, 344, 1000
- Carballo et al. (1998) Carballo, R., Sánchez, S. F., González-Serrano, J. I., Benn, C. R., & Vigotti, M. 1998, AJ, 115, 1234
- Chabrier (2003) Chabrier, G. 2003, PASP, 115, 763
- de Vaucouleurs (1948) de Vaucouleurs, G. 1948, Ann. Astrophys., 11, 247
- Erb et al. (2003) Erb, D. K., Shapley, A. E., Steidel, C. C., Pettini, M., Adelberger, K. L., Hunt, M. P., Moorwood, A. F. M., & Cuby, J. 2003, ApJ, 591, 101
- Falomo et al. (2004) Falomo, R., Kotilainen, J. K., Pagani, C., Scarpa, R., & Treves, A. 2004, ApJ, 604, 495
- Freeman (1970) Freeman, K. C. 1970, ApJ, 160, 812
- Gebhardt et al. (2000) Gebhardt, K., Bender, R., Bower, G., Dressler, A., Faber, S. M., Filippenko, A. V., Green, R., Grillmair, C., Ho, L. C., Kormendy, J., Lauer, T. R., Magorrian, J., Pinkney, J., Richstone, D., & Tremaine, S. 2000, ApJ, 539, L13
- Giavalisco et al. (2004) Giavalisco, M., et al. 2004, ApJ, 600, L93
- Grogin et al. (2003) Grogin, N. A., Koekemoer, A. M., Schreier, E. J., Bergeron, J., Giacconi, R., Hasinger, G., Kewley, L., Norman, C., Rosati, P., Tozzi, P., & Zirm, A. 2003, ApJ, 595, 685
- Hutchings (2003) Hutchings, J. B. 2003, AJ, 125, 1053
- Hutchings et al. (1999) Hutchings, J. B., Crampton, D., Morris, S. L., Durand, D., & Steinbring, E. 1999, AJ, 117, 1109
- Hutchings et al. (2002) Hutchings, J. B., Frenette, D., Hanisch, R., Mo, J., Dumont, P. J., Redding, D. C., & Neff, S. G. 2002, AJ, 123, 2936
- Jahnke et al. (2004) Jahnke, K., Kuhlbrodt, B., & Wisotzki, L. 2004, MNRAS (in press), astro-ph/0311123
- Kauffmann et al. (2003) Kauffmann, G., Heckman, T. M., Tremonti, C., Brinchmann, J., Charlot, S., White, S. D. M., Ridgway, S., Brinkmann, J., Fukugita, M., Hall, P., Ivezic, Z., Richards, G., & Schneider, D. 2003, MNRAS, 346, 1055
- Kennicutt (1998) Kennicutt, C. K. 1998, ARAA, 36, 189
- Koekemoer et al. (2002) Koekemoer, A. M., Grogin, N. A., Schreier, E. J., Giacconi, R., Gilli, R., Kewley, L., Norman, C., Zirm, A., Bergeron, J., Rosati, P., Hasinger, G., Tozzi, P., & Marconi, A. 2002, ApJ, 567, 657
- Kotilainen & Ward (1994) Kotilainen, J. K., & Ward, M. J. 1994, MNRAS, 266, 953
- Krist & Hook (2003) Krist, J., & Hook, R. 2003, STSCI Intrument Science Report ACS 2003-06
- Kukula et al. (2001) Kukula, M. J., Dunlop, J. S., McLure, R. J., Miller, L., Percival, W., Baum, S. A., & O’Dea, C. P. 2001, MNRAS, 326, 1533
- Lehnert et al. (1992) Lehnert, M. D., Heckman, T. M., Chambers, K. C., & Miley, G. K. 1992, ApJ, 393, 68
- Omont et al. (2003) Omont, A., Beelen, A., Bertoldi, F., Cox, P., Carilli, C. L., Priddey, R. S., McMahon, R. G., & Isaak, K. G. 2003, A&A, 398, 857
- Peng et al. (2002) Peng, C. Y., Ho, L. C., Impey, C. D., & Rix, H.-W. 2002, AJ, 124, 266
- Ridgway et al. (2001) Ridgway, S. E., Heckman, T. M., Calzetti, D., & Lehnert, M. 2001, ApJ, 550, 122
- Rix et al. (2004) Rix, H.-W., Barden, M., Beckwith, S. V. W., Bell, E. F., Borch, A., Caldwell, J. A. R., Häußler, B., Jahnke, K., Jogee, S., McIntosh, D. H., Meisenheimer, K., Peng, C. Y., Sánchez, S. F., Somerville, R. S., Wisotzki, L., & Wolf, C. 2004, ApJS, 152, 163
- Salpeter (1955) Salpeter, E. E. 1955, ApJ, 121, 161
- Sánchez & González-Serrano (2003) Sánchez, S. F., & González-Serrano, J. I. 2003, A&A, 406, 435
- Sánchez et al. (2004) Sánchez, S. F., Jahnke, K., Wisotzki, L., Barden, M., Beckwith, S. V. W., Bell, E. F., Borch, A., Caldwell, J. A. R., Häußler, B., Jogee, S., McIntosh, D. H., Meisenheimer, K., Peng, C. Y., Rix, H.-W., Somerville, R. S., & Wolf, C. 2004, submitted to ApJ, astro-ph/0403645
- Schade et al. (2000) Schade, D., Boyle, B. J., & Letawsky, M. 2000, MNRAS, 315, 498
- Schlegel et al. (1998) Schlegel, D. J., Finkbeiner, D. P., & Davis, M. 1998, ApJ, 500, 525
- Schreier et al. (2001) Schreier, E. J., Koekemoer, A. M., Grogin, N. A., Giacconi, R., Gilli, R., Kewley, L., Norman, C., Hasinger, G., Rosati, P., Marconi, A., Salvati, M., & Tozzi, P. 2001, ApJ, 560, 127
- Sérsic (1968) Sérsic, J. 1968, Atlas de Galaxes Australes, Observatorio Astronomico de Cordoba
- Shapley et al. (2003) Shapley, A. E., Steidel, C. C., Pettini, M., & Adelberger, K. L. 2003, ApJ, 588, 65
- Vernet et al. (2001) Vernet, J., Fosbury, R. A. E., Villar-Martín, M., Cohen, M. H., Cimatti, A., di Serego Alighieri, S., & Goodrich, R. W. 2001, A&A, 366, 7
- Wolf et al. (2004) Wolf, C., Meisenheimer, K., Kleinheinrich, M., Borch, A., Dye, S., Gray, M., Wisotzki, L., Bell, E. F., Rix, H.-W., Cimatti, A., Hasinger, G., & Szokoly, G. 2004, submitted to A&A, astro-ph/0403666
- Wolf et al. (2003) Wolf, C., Meisenheimer, K., Rix, H.-W., Borch, A., Dye, S., & Kleinheinrich, M. 2003, A&A, 401, 73
- Wolf et al. (2003) Wolf, C., Wisotzki, L., Borch, A., Dye, S., Kleinheinrich, M., & Meisenheimer, K. 2003, A&A, 408, 499
Appendix A AGN images and surface brightness plots of AGN and stars
Figure 11 shows plots for each of the nine resolved object plus the composite ‘stacked’ object. Two objects appear twice as they appear in overlapping areas of gems tiles. Figures 12 and 13 show a random selection of isolated stars used to show the zero case of a point sources without any host galaxy contribution, for comparison purposes.