The Damping Wing of the Gunn-Peterson Absorption and Lyman-Alpha Emitters in the Pre-Reionization Era
Abstract
We use a numerical simulation of cosmological reionization to estimate the likelihood of detecting Lyman- emitting galaxies during the pre-reionization era. We show that it is possible to find galaxies even at that are barely affected by the dumping wing of the Gunn-Peterson absorption from the neutral IGM outside of their H II regions. The damping wing becomes rapidly more significant at , but even at is it not inconceivable (although quite hard) to see a Lyman- emission line from a star-forming galaxy.
1 Introduction
A recent landslide in the number of detections of high redshift Lyman- emitters (Dey et al. 1998; Hu, Cowie, & McMahon 1998; Weymann et al. 1998; Hu, McMahon, & Cowie 1999; Stern & Spinrad, 1999; Ellis et al. 2001; Ajiki et al. 2002; Hu et al. 2002; Kodaira et al. 2003; Taniguchi et al. 2003; Rhoads et al. 2003; Maier et al. 2003; Cuby et al. 2003; Bunker et al. 2003; Hu et al. 2004; Pello et al. 2004; Kneib et al. 2004) offers a unique probe of the ionization history of the universe during cosmological reionization. As observations of Lyman- absorption in the spectra of high redshift quasars (Djorgovski et al. 2001; Becker et al. 2001; Fan et a. 2002, 2003; White et al. 2003; Songaila 2004) unambiguously indicate that the universe was reionized shortly before (Gnedin 2002), the observations of Lyman- at directly probe the pre-reionization era.
Specifically, since the damping wing of the Gunn-Peterson absorption (Gunn & Peterson 1965) of the neutral IGM will affect the Lyman- emission line if the H II region around the emitting galaxy is not large enough (Miralda-Escudé 1998; Haiman 2002), the observations of high redshift Lyman- emitters tell us something about the distribution and sizes of cosmological H II regions - although, to understand what specific constraints the observations place is a horrendously difficult task111Since most Lyman- emitters are discovered because they are highly lensed by foreground clusters of galaxies, determining the observational selection function is extremely difficult..
However, the very fact of discovering a high-redshift Lyman- emitter may potentially be used to constraint the ionization history of the universe. For example, Pello et al. (2004) report a tentative discovery of a galaxy. Is it possible to see a Lyman- emitting galaxy at such a high redshift? Loeb et al. (2004) used this fact to put some preliminary constraints on the ionization state of the IGM around that galaxy. While a real situation is likely to be more complicated because of the variety of reasons (H II regions are typically highly asymmetric because I-fronts propagate much faster across underdense voids then across dense filaments; bright galaxies are biased, so it is likely that more than one galaxy is located inside a single H II region; Lyman- emitters can also be located inside H II regions of luminous quasars, which are often many times larger than H II regions of galaxies, etc), it is interesting to investigate how likely it is to find a high redshift galaxy unaffected by the damping wing of the Gunn-Peterson absorption from the surrounding IGM.
2 Star Formation Modeling
In order to construct a model for the Gunn-Peterson absorption in the pre-reionization era, we use a numerical simulation of cosmological reionization similar to the one described in Gnedin (2000). The new simulation, however, incorporates a significantly more accurate method for following the time-dependent and spatially-inhomogeneous radiative transfer using the Optically Thin Variable Eddington Tensor (OTVET) approximation of Gnedin & Abel (2001).
The simulation assumes a flat cosmology with the values of cosmological parameters as measured by the WMAP satellite (Spergel et al. 2003)222Specifically, we assume , , , , and .. The size of the simulation volume is in comoving units, and the comoving spatial resolution of the simulation is . The simulation included dark matter particles (with mass of ), an equal number of baryonic cells on a quasi-Lagrangian moving mesh, and about 3 million stellar particles that formed continuously during the simulation. Only PopII stars are included in the simulation as sources of ionizing radiation.
The simulation was adjusted to reproduce the observed evolution of the mean transmitted flux in the Lyman- line between and (White et al. 2003; Songaila 2004). We, therefore, can be confident that the evolution of the IGM is treated correctly in the simulation at least at .
Given a simulation, we identify all star-forming galaxies using the DENMAX halo finding algorithm of Bertschinger & Gelb (1991). For each galaxy, we generate 100 lines of sight that originate at the galaxy location and go along randomly chosen directions. We then generate an absorption spectrum along each line of sight following the standard procedure. For the computational efficiency, we use Liu et al. (2001) approximation for the Voigt profile.
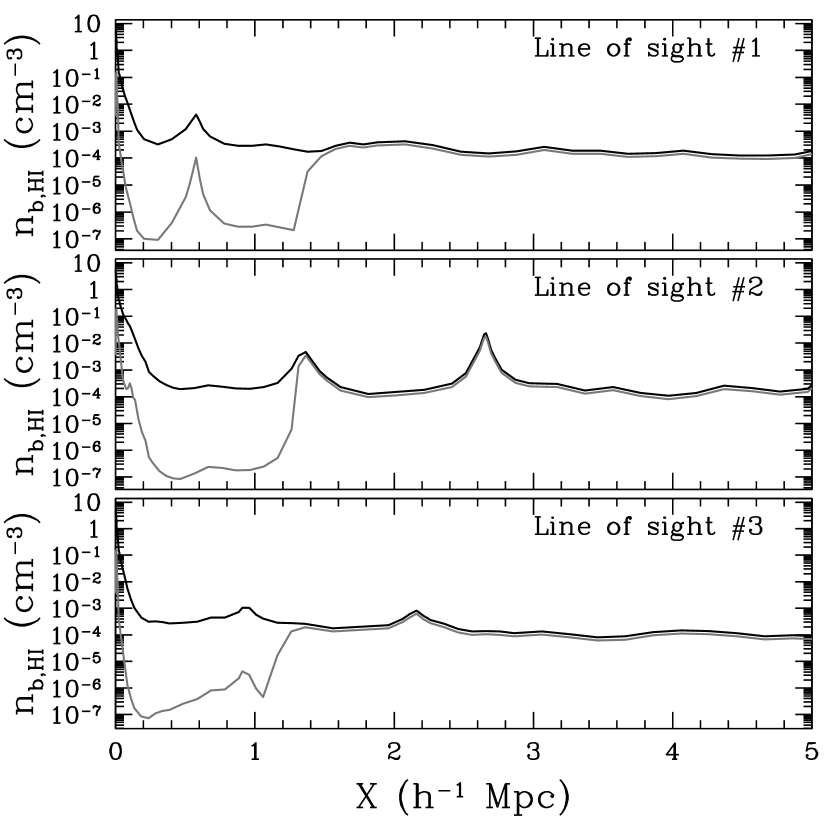
Figure 1 illustrates the distribution of the baryon number density and neutral hydrogen number density along 3 random lines of sight originating at the location of the most luminous galaxy at . The H II region around the central galaxies is easily visible. Because the brightest galaxies are highly clustered, smaller galaxies and other dense structures are often located within the H II regions of brighter ones. For example, in the top panel, an overdensity of the order of 10 is located within the H II region of the central galaxy. This overdensity is the outer part of a smaller galaxy, and is, therefore, significantly more neutral than the rest of the H II region (in fact, more neutral than simple ionization equilibrium would predict, due to shadowing and time-dependent ionization). This neutral spike is sufficient to produce large damping wing absorption at the location of the galaxy and make the Lyman- of the central galaxy unobservable. Two bottom panels, however, show different, “clean” lines of sight that are not obscured by neighbors and produce lower absorption by the damping wing of the neutral IGM outside the H II region. This illustrates that the effect of the damping wing of the Gunn-Peterson absorption strongly depends on the direction of the line of sight: the same Lyman- emitting galaxy may be observable or non-observable depending on the direction of viewing.
A significant complication, however, for the evaluation of the strength of the Lyman- emission line from the central galaxy is the galaxy itself. Synthetic Lyman- spectra from simulation are often treated as absorption spectra, when, in reality, they are scattering spectra. For gas along a line of sight well outside the source of emission this is an appropriate approximation, since scattering off the direction of viewing removes the photons that could be observed, and, thus, appears as effective absorption. This is not true for the source of emission, since photons that were originally emitted in directions different from the line of sight are scattered into the direction of viewing. Thus, without the proper line radiative transfer treatment (which is not included in our simulation), it is not possible to accurately predict shapes of the Lyman- emission lines from simulated galaxies. Leaving such treatment for future work, in this paper we are concerned only with an-order-of-magnitude estimate of the effect that damping wings of the neutral gas outside H II regions have on Lyman- emission lines.
In order to obtain such an estimate, we adopt a following simple procedure. We assume that the Lyman- emission line from a typical galaxy has a width of the order of . Thus, we exclude all Lyman- absorption within a specified velocity distance from the systemic velocity of a simulated galaxy (because within this distance we should treat the Lyman- as scattering and not as absorption). Also, since the significant suppression of Lyman- emission at the systemic velocity may still make the red wing of the emission line visible, we choose the Lyman- optical depth at as a quantity that roughly characterizes the damping wing absorption of the Lyman- emission line. Typical Lyman- emission lines have gaussian widths of the order of , so roughly corresponds to to the red of the line systemic velocity. In this paper we use a range of values for to estimate the sensitivity of our results to that somewhat arbitrary parameter.
With this approach, we can calculate the Lyman- optical depth at for each of 100 lines of sight for each of the simulated galaxy. Thus, there are 100 values of the damping wing absorption optical depth , or, equivalently, the flux decrement , for each galaxy. These 100 values are not all the same, of course, so we can use them to approximately characterize the probability that a given galaxy (labeled by its star formation rate) has a given value of the Lyman- flux decrement.
3 Results
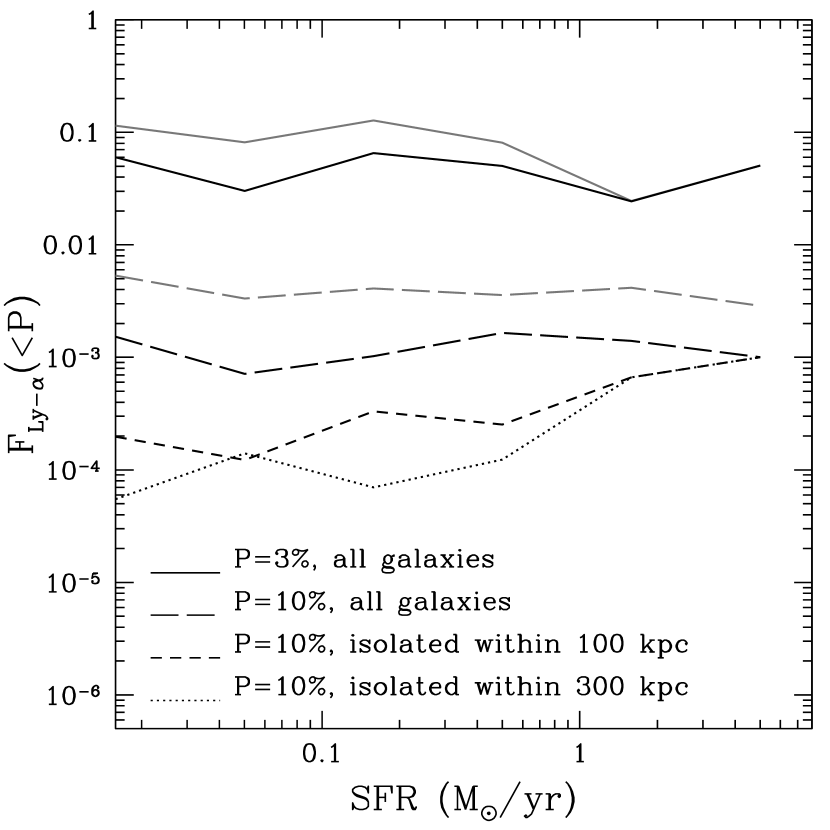
As a test of our approach, we show in Figure 2 the values for the Lyman- flux decrement above which 3% and 10% of all galaxies lie - for example, solid lines indicate that for 3% of all galaxies the decrease in flux at is not more than a factor of 10. The two values for the parameter are used - the difference between black and gray lines roughly indicates the uncertainty of our estimate.
An interesting feature of Fig. 2 is the lack of dependence of the flux decrement on the star formation rate. Naively, one would expect that galaxies with lower star formation rates create smaller H II regions around them, and, therefore, should exhibit higher suppression of their Lyman- emission lines - clearly at odds with our result. However, this naive argument misses an important fact that high redshift galaxies are highly clustered, so it is likely for a faint galaxy to be located close to a bright galaxy, within the bright galaxy H II region. In order to test that this effect is responsible for the lack of dependence of the flux decrement on the star formation rate, we compute the flux decrement versus the star formation rate for the sub-sample of isolated galaxies. We define a galaxy to be isolated if it does not contain a galaxy with a higher star formation rate within a sphere of predefined radius . Short-dashed and dotted lines in in Fig. 2 show the flux decrement for the top 10% of all galaxies (an analog of the long-dashed line) for sub-samples of isolated galaxies with and (in physical units) respectively. As one can see, isolated galaxies exhibit a strong dependence on the star formation rate for rates above about . At even lower star formation rates a different effect takes over: since the star formation in dwarf galaxies is highly episodic (c.f. Ricotti, Gnedin, & Shull 2003), the instantaneous value of the star formation rate and the size of an H II region cease to correlate.
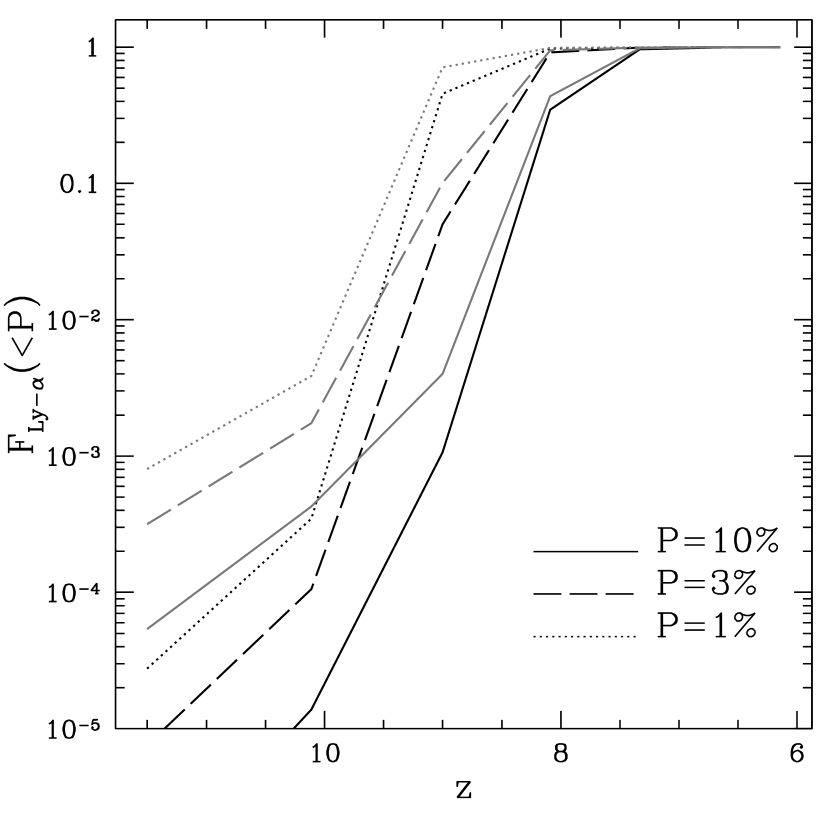
The redshift dependence of the Lyman- flux decrement is shown in Figure 3. As once can see, our estimates become highly uncertain at - at these redshifts full radiative transfer in Lyman- line is required to make an accurate prediction for the effect of the damping wing on the profile of the Lyman- emission line. At lower redshifts, however, our estimates are more precise.
4 Discussion
Somewhat unexpectedly, even at as high a redshift as , one percent of all Lyman- emitters should have their emission lines barely affected by the damping wing. At higher redshifts the damping wing quickly becomes more significant, but finding Lyman- emitters at should still be possible, although they must be quite rare.
The reason for this rapid transition is quite simple: as the universe expands, H II regions increase in size, so at each moment there exists a characteristic scale for the size distribution of H II regions (say, a typical size of an H II region around an galaxy). At the same time, the damping wing of the Gunn-Peterson absorption introduces another spatial scale (about or proper distance of at ; Miralda-Escidé 1998). Thus, when typical H II regions around bright galaxies exceed this scale, a substantial fraction of all Lyman- emitters becomes observable.
It is important to emphasize here that our estimate is likely only a lower limit: because of the finite size of the computational box, we miss the brightest galaxies which create the largest H II regions (although the size of the simulation box was selected so as to make this effect not significant at ). In addition, our simulation does not include quasars, which can create H II regions several times that of galaxies. High redshift quasars are rare (there should be only about 2 SLOAN quasars in the whole observable universe between redshifts 9 and 10, Fan et al. 2001), so that effect is most likely not large too, but without a detailed simulation we cannot estimate it, so we treat our results as a lower limit.
References
- (1)
- (2) Ajiki, M., et al. 2002, ApJ, 576, L25
- (3)
- (4) Becker, R. H., et al. 2001, AJ, 122, 2850
- (5)
- (6) Bertschinger, E., & Gelb, J. 1991, J. Comput. Phys., 5, 164
- (7)
- (8) Bunker, A. J., Stanway, E. R., Ellis, R. S., McMahon, R. G., & McCarthy, P. J. 2003, MNRAS, 342, L47
- (9)
- (10) Cuby, J. G., LeFe‘vre, O., McCracken, H., Cuillandre, J.-C., Magnier, E., & Meneux, B. 2003, A&A, 405, L19
- (11)
- (12) Dey, A., Spinrad, H., Stern, D., Graham, J. R., & ChaAee, F. H. 1998, ApJ, 498, L93
- (13)
- (14) Djorgovski, S. G., Castro, S. M., Stern, D., & Mahabal, A. 2001, ApJL, 560, 5
- (15)
- (16) Ellis, R., Santos, M. R., Kneib, J.-P., & Kuijken, K. 2001, ApJ, 560, L119
- (17)
- (18) Fan, X., et al. 2001, AJ, 122, 2833
- (19)
- (20) Fan, X., Narayanan, V. K., Strauss, M. A., White, R. L., Becker, R. H., Pentericci, L., & Rix, H.-W. 2002, AJ, 123, 1247
- (21)
- (22) Fan, X., et al. 2003, AJ, 125, 1649
- (23)
- (24) Gnedin, N. Y. 2000, ApJ, 535, 530
- (25)
- (26) Gnedin, N. Y. 2002, in Texas in Tuscany, eds. R. Bandiear, R. Maiolino, F. Mannucci, (World Scientific: Singapore), 61
- (27)
- (28) Gnedin, N. Y., & Abel, T. 2001, NewA, 6, 437
- (29)
- (30) Gunn, J. E., & Peterson, B. A. 1965, ApJ, 142, 1633
- (31)
- (32) Haiman, Z. 2002, 576, L1
- (33)
- (34) Hu, E. M., Cowie, L. L., & McMahon, R. G. 1998, ApJ, 502, L99
- (35)
- (36) Hu, E. M., McMahon, R. G., & Cowie, L. L. 1999, ApJ, 522, L9
- (37)
- (38) Hu, E. M., Cowie, L. L., McMahon, R. G., Capak, P., Iwamuro, F., Kneib, J.-P., Maihara, T., & Motohara, K. 2002, ApJ, 568, L75
- (39)
- (40) Hu, E. M., Cowie, L. L., Capak, P., McMahon, R. G., Hayashino, T., & Komiyama, Y. 2004, AJ, 127, 563
- (41)
- (42) Kodaira, K., et al. 2003, PASJ, 55, L17
- (43)
- (44) Kneib, J.-P., Ellis, R. S., Santos, M. R., & Richard, J. 2004, ApJ, in press (astro-ph/0402319)
- (45)
- (46) Liu, Y., Lin, J., Huang, G., Guo, Y., & Duan, C. 2001, J. Opt. Soc. Am. B, 18, 666
- (47)
- (48) Loeb, A., Barkana, R., & Hernquist, L. 2004, ApJ, submitted (astro-ph/0403193)
- (49)
- (50) Maier, C., et al. 2003, A&A, 402, 79
- (51)
- (52) Miralda-Escudé, J. 1998, ApJ, 501, 15
- (53)
- (54) Pello, R., Schaerer,D., Richard, J., Le Borgne, J.-F., & Kneib, J.,-P 2004, A&A, 416, L35
- (55)
- (56) Rhoads, J. E., et al. 2003, AJ, 125, 1006
- (57)
- (58) Ricotti, M., Gnedin, N. Y., & Shull, J. M. 2003, ApJ, 575, 49
- (59)
- (60) Songaila, A. 2004, astro-ph/0402347
- (61)
- (62) Spergel, D. N., et al. 2003, ApJ, in press (astro-ph/0302209)
- (63)
- (64) Stanway, E. R., Glazebrook, K., Bunker, A. J., Abraham, R. G., Hook, I., Rhoads, J., McCarthy, P. J., Boyle, B., Colless, M., Crampton, D., Couch, W., Jorgensen, I., Malhotra, S., Murowinski, R., Roth, K., Savaglio, S., & Tsvetanov, Z. 2004, ApJ, 604, L13
- (65)
- (66) Stern, D., & Spinrad, H. 1999, PASP, 111, 1475
- (67)
- (68) Taniguchi, Y., et al. 2003, ApJ, 585, L97
- (69)
- (70) Weymann, R. J., Stern, D., Bunker, A., Spinrad, H., Chaffee, F. H., Thompson, R. I., & Storrie-Lombardi, L. J. 1998, ApJ, 505, L95
- (71)
- (72) White, R. L., Becker, R. H., Fan, X., & Strauss, M. A. 2003, AJ, 126, 1
- (73)