The X-ray luminosity function of galaxies in the Coma cluster
The XMM-Newton survey of the Coma cluster of galaxies covers an area of 1.86 square degrees with a mosaic of 16 pointings and has a total useful integration time of 400 ksec. Detected X-ray sources with extent less than were correlated with cataloged galaxies in the Coma cluster region. The redshift information, which is abundant in this region of the sky, allowed us to separate cluster members from background and foreground galaxies. For the background sources, we recover a typical in the flux range ergs s-1 cm-2 in the 0.5–2.0 keV band. The X-ray emission from the cluster galaxies exhibits X-ray colors typical of thermal emission. The luminosities of Coma galaxies lie in the ergs/s interval in the 0.5-2.0 keV band. The luminosity function of Coma galaxies reveals that their X-ray activity is suppressed with respect to the field by a factor of 5.6, indicating a lower level of X-ray emission for a given stellar mass.
Key Words.:
clusters: individual: Coma — X-rays: galaxies — Galaxies: ISM — Galaxies: luminosity function — Galaxies: fundamental parameters1 Introduction
Studies of X-ray emission from normal galaxies can be used to reveal signs of recent star-formation activity (Grimm et al. 2003), the presence of the hot gas, filling the potential well of the galaxy and its immediate surroundings (Forman, Jones, Tucker 1985), and the population of discrete X-ray galactic sources (e.g. Pietsch et al. 1994, Irwin et al. 2003). With the advent of high-spatial resolution observations, such studies become feasible also for nearby clusters of galaxies, with the advantage that many galaxies are observed simultaneously, all at essentially the same distance from the observer. Such observations probe the effect of the cluster environment on properties of galaxies, in particular ram-pressure stripping and compression.
In this paper we present the properties of point sources in the XMM-Newton mosaic of the Coma cluster of galaxies, which covers most of the cluster virial radius. The advantages of studying the Coma cluster are the availability of deep optical catalogs, plus the results of many studies at various wavelengths, providing a unique opportunity for the identification and in-depth study of the X-ray characteristics of cluster galaxies. We use the catalog of Godwin, Metcalfe, Peach (1983, hereafter GMP) to associate X-ray sources with galaxies and employ the GOLDmine111http://goldmine.mib.infn.it/ (Gavazzi et al, 2003) database to provide a wealth of additional information about the galaxies.
The paper is organized as follows, in §2 we describe our analysis of XMM-Newton data. The X-ray emission of Coma galaxies is analyzed in §3. In §4 we derive the X-ray luminosity function of the Coma cluster galaxies. We adopt km s-1 Mpc-1 and , with a resulting Mpc. One degree corresponds to 1.67 Mpc.

2 X-ray observations and data reduction
The goal of this section is to describe our method of identifying an X-ray source with a galaxy in the cluster. Here we provide illustrations that gave helpful suggestions how such an identification should be defined. We attempt to define our criteria rather loosely, but later sharpen them using the experience with robust identifications. The selection criteria hopefully will become transparent as we tabulate the results for intermediate steps. In a brief, we remove X-ray sources from our catalog that are identified with background AGN or central intracluster medium (ICM) structures while retaining identifications with large separations between the X-ray source and a cluster galaxy ascribing the separation to the effect of ram-pressure stripping. For a subset of detected spiral galaxies, we show that the position of the X-ray source corresponds to the position of the stripped HI, thus reaffirming this later strategy.
In this paper we use the performance verification observations of the Coma cluster obtained with the EPIC-pn instrument on board XMM-Newton (Jansen et al. 2001). Preliminary reports of these observations were given by Briel et al. (2001), Arnaud et al. (2001) and Neumann et al. (2001). In addition to data reported in Briel et al. (2001), this work includes four more observations: Coma-12 and Coma-13 fields, as well as another pointing on the Coma center, performed to check the consistency of full frame and extended full frame modes, and a re-observation of the Coma-2 field that was contaminated by a high particle background in the original observation.
All observations have been reprocessed using the latest version of the XMM reduction pipeline (XMMSAS 5.4), which yields astrometry to better than 1 arcsecond. A vignetting correction, crucial for obtaining reliable source characteristics over a wide region, is performed using the latest calibration (Lumb et al. 2003).
The images were extracted separately for each pointing, along with the corresponding exposure maps. We select pn events with and , which in addition to FLAG=0 events includes events in the rows close to gaps and bad pixels, however it excludes the columns with offset energy. This event selection results in a better spatial coverage of the cluster, but at a somewhat compromised energy resolution, which is sufficient for the broad-band imaging. When an X-ray photon produces an electron cloud centered on a problematic region, such as a gap or a bad pixel, most of the energy of the photon will be lost. Instead of an event occupying two pixels (a double), we will detect an event occupying one pixel (a single), but of much lower energy. We found experimentally that the above process was important in the 0.2–0.4 keV band, producing bright columns near gaps. Given our choice to include these columns in the image, we had to avoid energies below 0.4 keV.
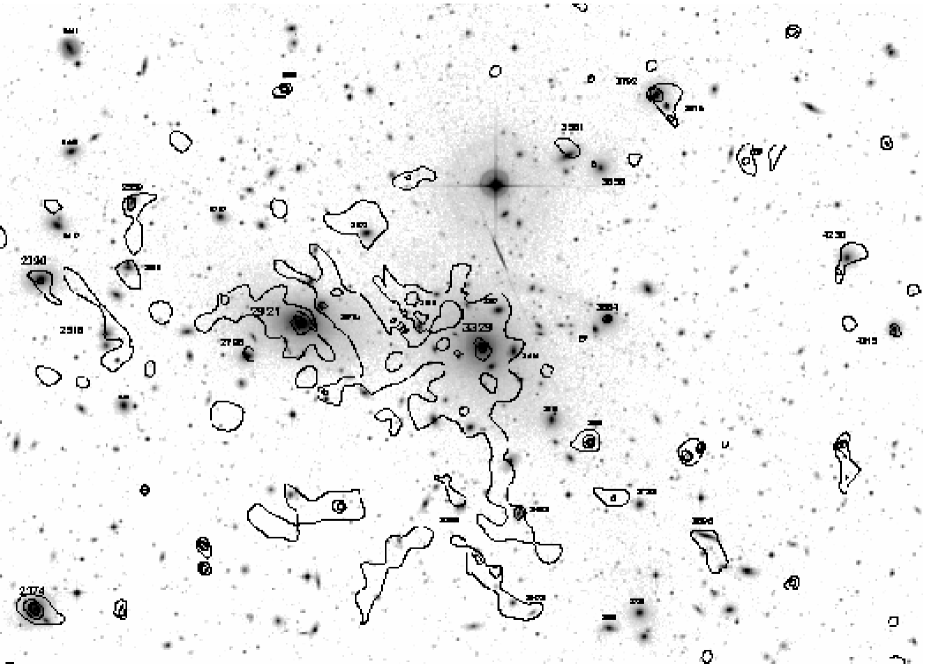
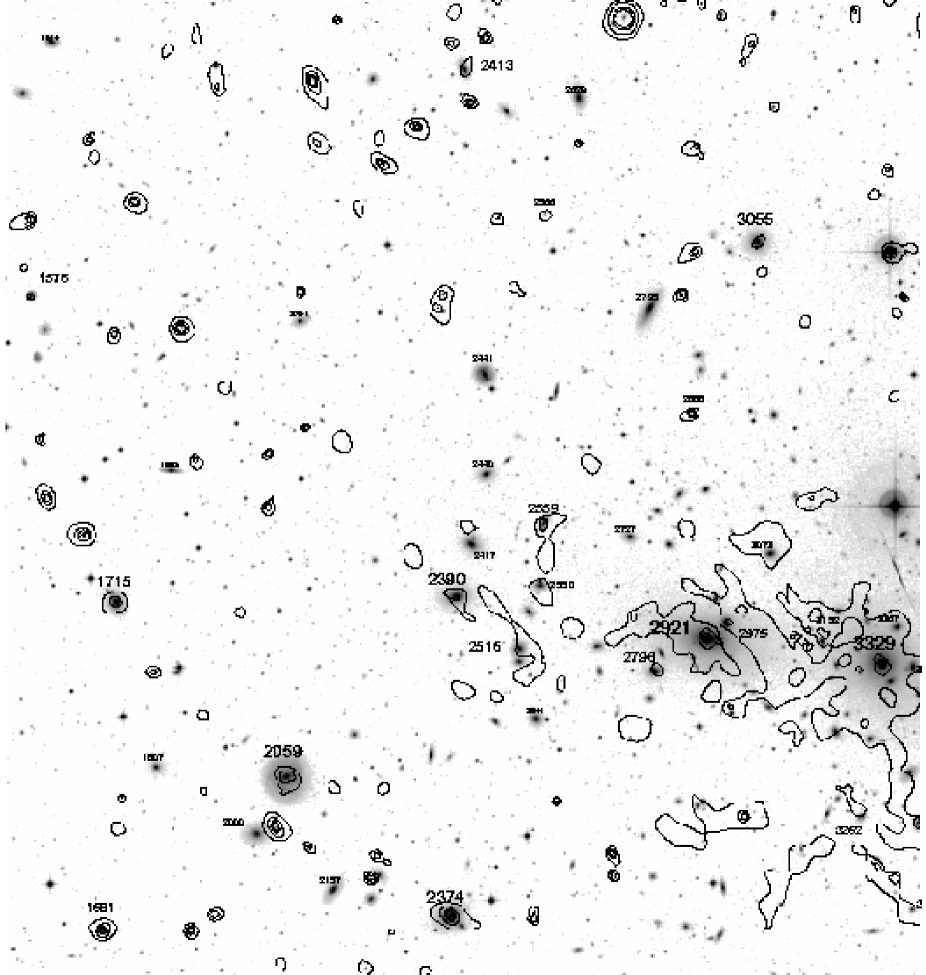
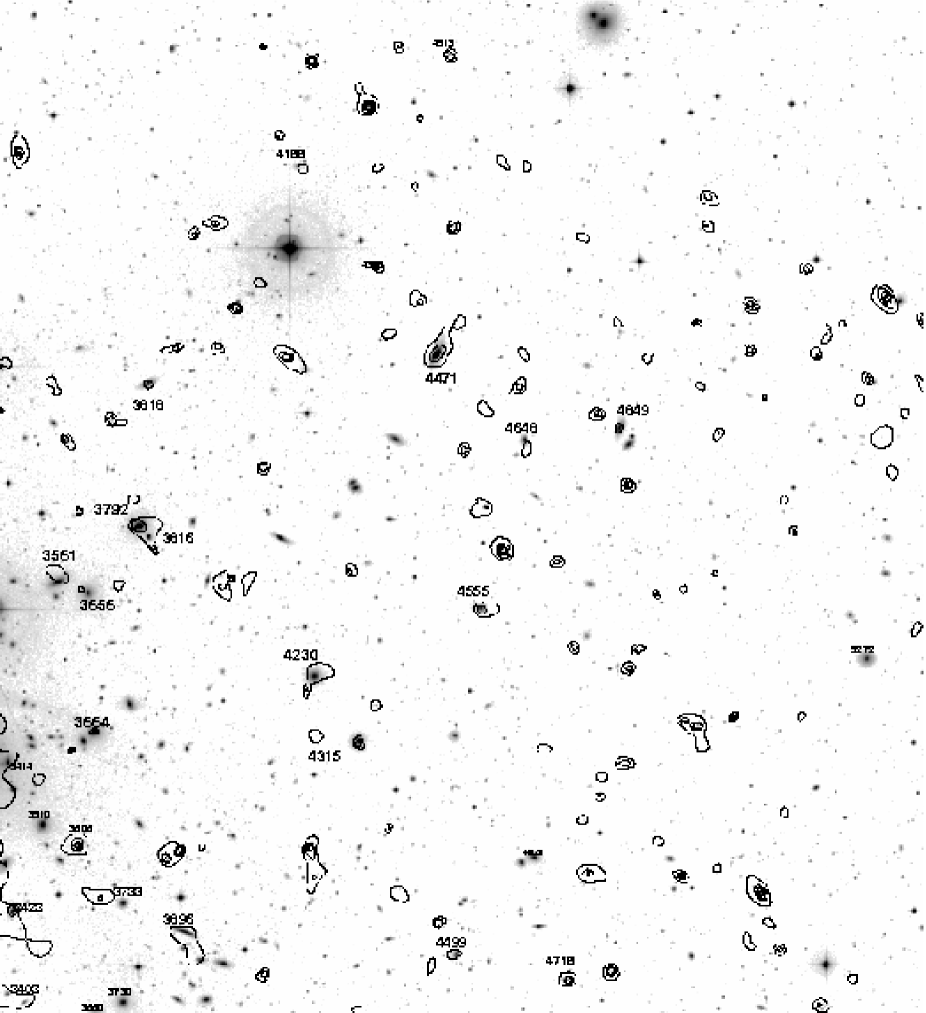
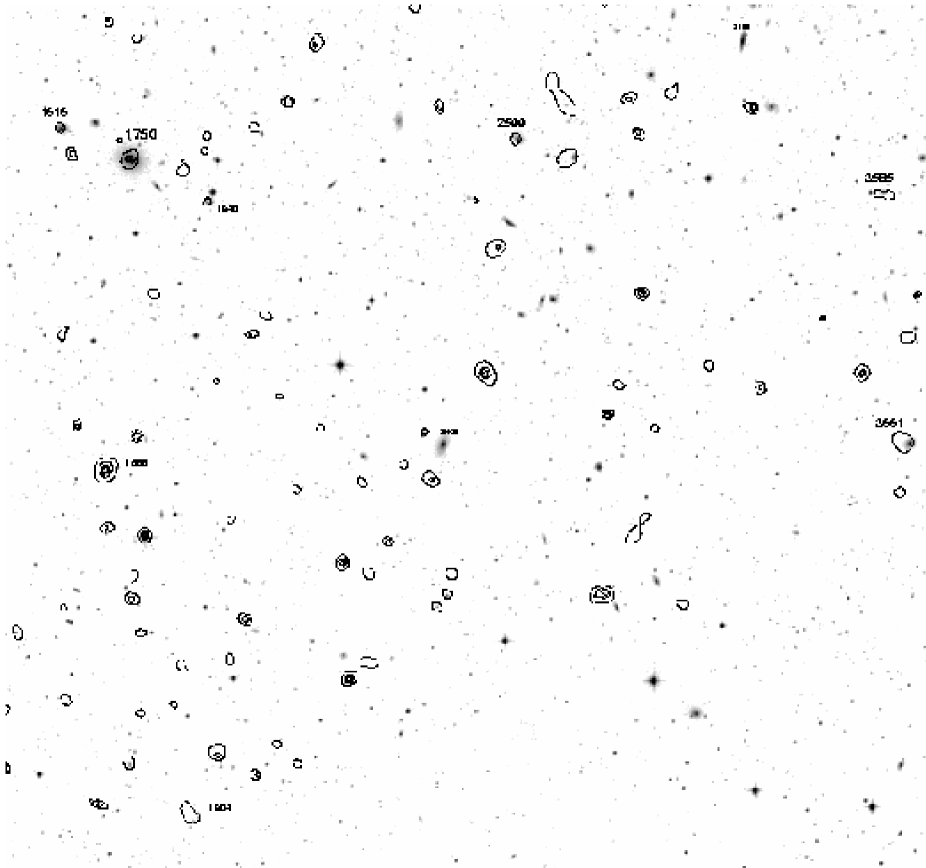
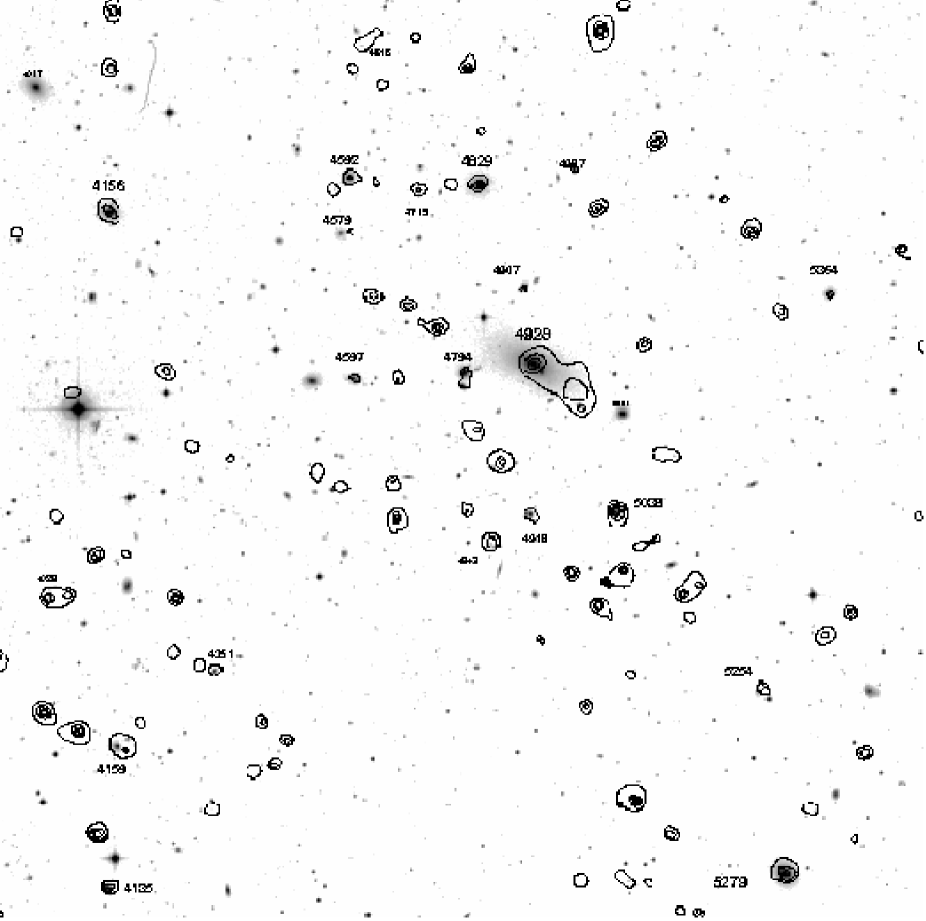
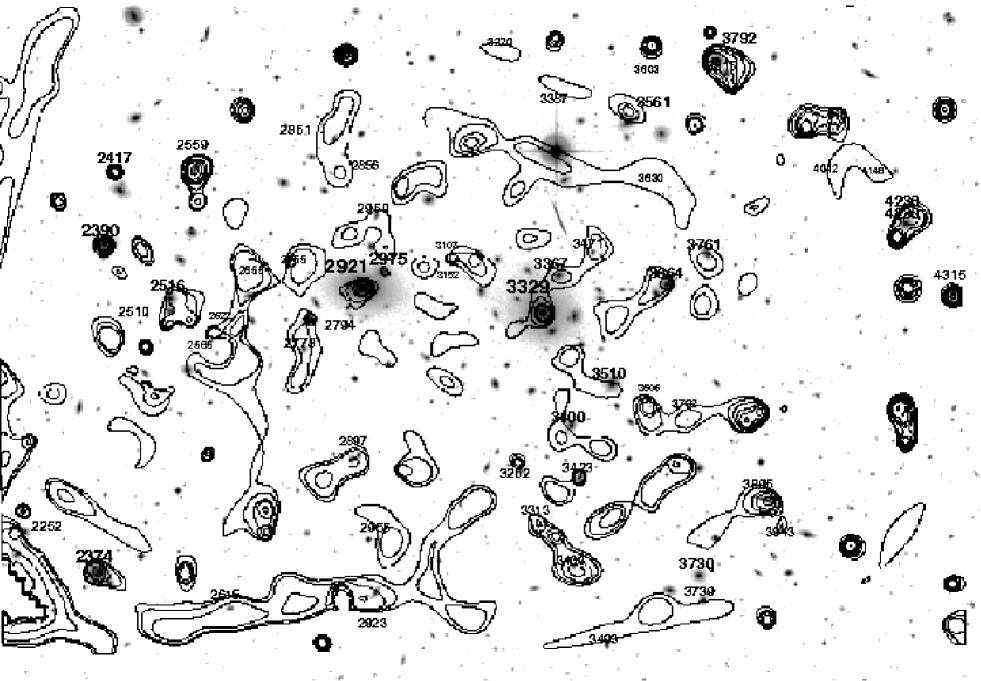
We employed the wavelet image reconstruction technique (Vikhlinin et al. 1998) in order to begin separating the small-scale X-ray structure, possibly associated with individual galaxies, from the large-scale structure originating from the hot cluster gas. We set the wavelet peak detection threshold to , accepted flux down to and performed ten iterations at wavelet scales of 4 and 8 arcseconds. The DSS2 B-band image of Coma is overlaid in Figs.1-5 with contours of the X-ray emission detected on small scales using the 0.5–2.0 keV energy band. Except for the Coma center, the identification of X-ray sources with galaxies is unambiguous. The nominal uncertainty in the astrometry of XMM-Newton is . Our source detection method is subject to an additional positional uncertainty of (1/2 of the pn pixel). These small errors make the identification of the point-like and nearly point-like sources obvious.
Contrary to point sources, the identification of extended features is non-trivial. In particular near the cluster center, the X-ray map exhibits numerous extended fluctuations, which might be associated with individual galaxies or be local enhancements of the ICM. A strictly positional criterion would cause us to reject the identification of those X-ray sources that are slightly displaced from the optical galaxy position by the action of ram-pressure stripping. Thermodynamics helps us: since stripping implies a gaseous origin for the offset emission, we expect it to have a typical entropy of galactic gas, which is much lower than the entropy of the cluster ICM.
The two giant galaxies at the center of Coma provide a good illustration of the problem. Vikhlinin et al. (1994) using ROSAT data, found an emission enhancement on scales of 1 arcminute. Using Chandra observations Vikhlinin et a. (2001) showed that the gas associated with this scale has a temperature of 10 keV, while there is a much more compact emission at keV temperature centered on both the galaxies. Based on the temperature, Vikhlinin et al. (2001) concluded that the ROSAT detection is due to the Coma ICM filling the potential wells of ellipticals. The hot gas is bound to the potentials of these galaxies by the external pressure imposed by the Coma ICM. The difference between the Coma ICM and galaxy interstellar medium (ISM) is revealed by their entropy. Although the origin of X-ray temperatures in both ICM and ISM are shocks, the difference in the entropy is due to a combination of different initial states and the strengths of the shock, which increases with the potential of the system (). In the Coma cluster this difference is particularly large, so a separation based on the entropy is fruitful.
We construct the entropy map using the wavelet-smoothed surface-brightness map in the 0.8–2.0 keV energy range as an indicator of the electron density squared and the hardness ratio map as the temperature distribution, and defining the entropy as . More details are given in Briel et al. (2003). Valleys of low entropy, such as those presented in Fig.6, should enable us to locate X-ray sources associated with the galaxy ISM. Enhancements of the emission due to ICM trapped in the potentials of the galaxies due to the cluster overpressure should show up in the gas pressure map, but not in the entropy map, as gas compression occurs adiabatically. Also, the fluctuations that are associated with shocks in the ICM, will (if at all) be seen as positive fluctuations in the entropy map. The issue of ISM/ICM separation in not unique to identifying Coma galaxies since Briel et al. (2001), among others, report a quite inhomogeneous hardness ratio map of the Coma center, which is not understood.
There additional uncertainties associated the low entropy ISM of galaxies in a cluster. First it is subject to a number of instabilities, such as cooling and a combination of stripping and Kelvin-Helmholtz instability and should be understood as result of dynamical equilibrium between the processes of gas removal and gas replenishment (e.g. Gaetz et al. 1987; Matsushita 2001). However in Coma, an additional complication arises from the presence of the large-scale low entropy gas associated with the infalling group associated with the NGC 4911 galaxy, first detected by White, Briel and Henry (1993) and further studied by Vikhlinin et al. (1997) and Neumann et al. (2003). The group occupies the south-eastern part of Fig.6. A number of weaker large-scale features are also evident in Fig.6.
To summarize, we decided to use the following identification criterion: if a negative valley in the entropy map or a positive peak in the emission map lies within the size of the galaxy, it is considered to be associated with the galaxy. The resulting detections of galaxies are presented in Tab.1 and Tab.2 for the emission and entropy methods, respectively. The entropy method is only reported for the center of the Coma cluster where the level of the overall emission is high.
As discussed below, most of the point sources detected in the present survey are identified with background AGNs. In order to compare with other AGN studies, we selected the 0.5–2.0 and 2.0–4.5 keV bands. The flux is extracted using a circle of radius, centered on the detected peak. The correction for flux outside these apertures is 1/0.74 in the keV band and 1/0.73 in the keV band, using the results of the in-flight calibrations of Ghizzardi (2001). Changes in the PSF at large off-axis angles lead to variation of the aperture correction within 1% for both the soft and the hard band. The countrate-to-flux conversion for keV band was done assuming a power law spectrum with a photon index of 1.4, which for the medium filter used in this survey, gives an effective area of the telescope of 1057 cm2 and a mean energy of 1.03 keV.
For the sources identified with galaxies we convert the counts in the keV band to the flux assuming a 1 keV thermal plasma of 0.3 solar metallicity, yielding the effective area of the telescope of 1054 cm2 and a mean energy of the photon of 0.94 keV.
In estimating the net flux from the detected source, we also subtract the background due to the diffuse emission of the Coma cluster. For this we use a larger ( in radius) circle, centered on the source, excluding the central , containing most of the source flux (see above for details) and we scale the flux according to the relative area–exposure–solid angle product (cm2 s arcmin2). This implicitly assumes a flat distribution of the diffuse cluster X-ray emission on the scale, which is appropriate even for substructure in the Coma diffuse emission. An underestimate of the source flux due to subtraction of the scattered flux is less than 2% in this procedure. However, when halos of galaxies are filled with hotter medium, like in the case of NGC4889 (GMP 2921), the use of the aperture underestimates the ’background’.
We also tested the background subtraction in aperture. Significant differences were found for galaxies GMP 2921, 3152, 3816. For these galaxies a smaller aperture was adopted ( in radius) to estimate the Coma diffuse background with resulting aperture correction of 0.68 due to the larger PSF scattered flux.
There is occasionally a difference in the reported flux for the same galaxy between Tab.1 and Tab.2, which is partly due to a different center ascribed to the source. Also as removal of point sources is complete only in the X-ray method, there is a possibility of an over-subtraction of the background in the entropy method (Tab.2). For most of the sources, however, the difference is not very significant. Exceptions are GMP 2390, 3329, 3403.
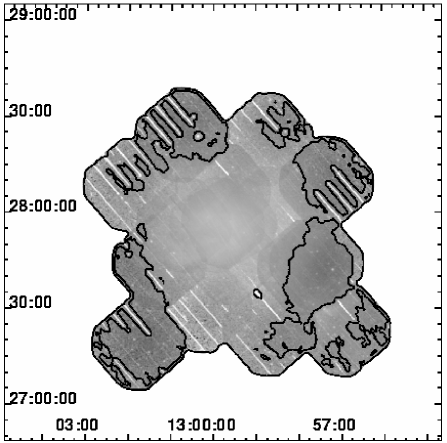
The survey area is illustrated in Fig.7, where we indicate the location of zones where we reach higher sensitivity. Assuming a uniform distribution of the surveyed sources, valid for background AGNs, in the right panel of Fig.7 we show the one-dimensional effective area. While a source brighter than ergs s-1 cm-2 could be detected anywhere in the totally surveyed 1.86 square degree area, only within ten percent of the surveyed area it is possible to detect a source of flux (here always in the 0.5–2.0 keV band) of ergs s-1 cm-2, while 90 percent of the total surveyed area are already available for sources with the flux of ergs s-1 cm-2. The sensitivity of source detection is also a function of the source extent and our calculation is only valid for sources with extent less than .
2.1 Identification of X-ray sources with Coma galaxies
In order to produce a reliable estimate of the X-ray properties of galaxies in the Coma cluster we first must assess the identification of the detected X-ray enhancements with galaxies, then we must reject associations with galaxies that are not members of the cluster.
As outlined above, we use an entropy map to check the most difficult region, the Coma center. First, we list all the possible sources in Tab.1–2 and we select the ones identified with galaxies in the GMP catalog (marked in Figs.1–6 with their GMP catalog numbers). Second, we cross-correlate the sources found in the surface brightness and entropy maps. A number of sources are detected in both maps. Sources not seen in the entropy maps cannot be produced by the thermal emission and were attributed to AGN. When such a source had a large () X-ray to optical source separation, this must be a chance coincidence with the background AGN and was therefore rejected from the final list. Sources absent in the surface brightness, but present in the entropy maps were considered to be possible associations with galaxy emission (we mark them as S-sources in the final lists, with X-sources being the sources identified only in the surface brightness map).
Robust X-ray source — galaxy associations are those where the source is within the effective radius of a galaxy brighter than in the B-band. For fainter galaxies we restrict the sample to identifications within , because we do not expect to detect diffuse emission from such galaxies and the fraction of chance identifications is high because of the large surface density of dwarf galaxies.
The resulting list has been cross correlated with existing redshift catalogs to assess cluster membership, defined as . Cluster membership for the few remaining galaxies with and no redshift available was based on the color criterion: (Poggianti et al. 2001).
2.2 Comments on X-ray–galaxy associations not considered to be cluster members
All sources that survive these cuts are considered to be Coma cluster galaxies and we give some of their properties in Tables 3 and 4. Below we comment on some of the excluded sources.
Sources absent in the entropy maps that are most likely background AGNs are: GMP 3262, 3606, 3656. GMP 3269 is perhaps a chance identification with the ICM structure in the Coma core.
GMP 2794 and 2798: these galaxies are CGCG 160248a and b, which form an interacting system. We formally list 2794 as the X-ray counterpart.
GMP 3220: very likely a chance identification, as the extent of the X-ray source is much larger than the galaxy.
GMP 3606: UV detected by FOCA (Donas et al. 1995), thus probably a star forming background object at 114990 km/s, also listed as a QSO in NED.
GMP 3702: background object ( km/s)
GMP 2897, MRK 60, CGCG160-243: star forming pair with highly discrepant redshifts. The brightest one (CGCG160-243a) is detected in the UV by FOCA, however due to the poor spatial resolution of FOCA an association with the other member cannot be excluded. In addition, there is a third fainter galaxy towards the South of CGCG160-243a, NGP9 F323-0986277 with a magnitude (from NED) of 19.5.
As previously mentioned, all the confirmed sources have an X-ray counterpart within one . Thus, we classify the X-ray sources associated with GMP 1688, 1904, 1940, 2566, 2888, 3262, 3269, 3585, 4028, 4358, 4513, 4579, 4615 as chance identifications.
Only three galaxies in the final list have no redshift information. Based on color criterion outlined above, we tentatively assign GMP 2550 and 4718 as members and 4845 as background.
2.3 Comparison with HI observations
We look for X-ray – HI associations to further assess the reliability of our method of identifying an X-ray source with a cluster galaxy even when the positions do not agree at the level. As the underlying reason for allowing such associations was stripping, similar shifts should be observed in HI. Thus an alignment between the X-ray and HI source could yield additional support for our method. We have used the Bravo-Alfaro et al. (2001) catalog of spiral galaxies for the comparison.
First we describe non-detections and associations that do not appear to be physically related. Some of spiral galaxies are outside our field of view, so of course we do not detect them. We also do not detect the following spiral galaxies at any wavelet scale: IC3913, Mrk 058, FOCA 0195, KUG1258+287, all of which except for Mrk 058 (unless projection plays a role here) are located at the periphery of the cluster.
There is a very extended ( radius) faint structure away from the NGC 4907, which is a part of a chain of three similar sources. We do not consider this association to be a cluster identification due to the very different size of the X-ray source. We tentatively assign such sources to debris of groups of galaxies, which should not be counted as emission associated with individual galaxies. In addition to a number of filaments reported in Neumann et al. (2003), which fall into this category, there is another new group of galaxies in both optical and X-ray, with approximate position 194.71510 27.81647 (J2000).
Now we describe a number of apparent physical associations of X-ray sources and spirals. KUG1255+275 (GMP 4351) is a weak X-ray source, centered on the galaxy, so at the current sensitivity, there is no stripping observed at X-ray, while it is observed in the HI data. Mrk 057 (GMP 4135) has X-ray emission that is offset to the North, in the same direction and magnitude as one of two HI extensions. In addition to the emission centered on NGC 4848 (GMP 4471, we observe a spectacular tail of X-ray emission to the north-west, corresponding exactly to the HI. Intriguingly, HI is not observed at the galaxy center at all. In CGCG 160-086 (GMP 2599) the X-ray source is offset to the east, as is the asymmetric part of the HI. X-rays are offset to the south-east of IC4040 (GMP 2559), exactly like the HI. In NGC 4911 (GMP 2374) the X-rays are produced by a strong point source centered on the galaxy. However there is no detected X-ray emission corresponding to the tail of diffuse HI emission to the south-west coincident with a location of a smaller galaxy. For NGC4921 (GMP 2059) the X-ray peak is at the position of the southern of the two HI blobs. The X-rays are offset to the east of NGC4926-A (GMP 1616), similar to the HI, but slightly displaced north of the HI peak still within the HI contours.
In general, we see a good deal of coincidence between the X-ray and HI and at the same time some subtle differences that would be worth investigating in detail. This comparison lends support to our idea that slight offsets between X-rays and optical images are due to stripping.
2.4 Background sources
The first step in background source removal was by considering the redshift of every galaxy identified with an X-ray source. Next we turn to a statistical background removal, as is often done in estimates of the galaxy luminosity function in the optical. For the current survey we need to have two probability functions: one the chance for a galaxy of a certain magnitude to be a background object and two the chance for an object of a given magnitude to emit X-rays at the flux level detectable in our survey. The first estimate, based on the available redshift information for an optically selected catalog of galaxies in the Coma cluster, complete to magnitude, yields the following cumulative fractions of background objects in bins of magnitude: 0 (), 12% (at ), 26% (at ), 65% (at ), 76% (at ), 85% (at ).
We estimate the probability for an object (excluding stars) of a given r-band magnitude to be a bright X-ray source using the optical follow-up of the Chandra Deep Field South (Giacconi et al. 2002). For , typical of Coma galaxies, this probability is %. However, all these objects are identified with QSOs or AGNs. In fact in the Chandra Deep Field South there are only 7 galaxies with and all of them have X-ray fluxes an order of magnitude fainter than the limit of our survey. Within the large uncertainty of this estimate, there is no contradiction between it and our final list of background galaxies detected in X-rays at high fluxes.
The above agrees also with the more direct calculation of Georgakakis et al. (2003), who have presented the contribution to the from ’normal’ galaxy counts. Convolving their results with the sensitivity curve of our survey, we expect 2.2 background galaxies to be detected in our survey.
![[Uncaptioned image]](/html/astro-ph/0403216/assets/x9.png)
Fig.2.4 clearly shows that after removal of the sources identified with member galaxies (as well as some obvious stars), our logN-logS relation in the Coma field is consistent with previous estimates from ROSAT, XMM and Chandra at a similar flux level.
2.5 Comparison to other X-ray studies
The first survey of X-ray emission of Coma galaxies was carried out by Dow & White (1995) using ROSAT PSPC data and a radius aperture to extract the flux. Detection of a few galaxies was reported. For NGC 4889, 4874 and 4839 (GMP 2921, 3329, 4928) the galaxy flux is dominated by the cluster component filling the potentials of these giant ellipticals, as has already been shown by the analysis of XMM temperature structure and therefore having much higher fluxes compared to our and Chandra (Vikhlinin et al. 2001) results. In our analysis we do not consider ICM filling the potentials of galaxies as a part of the X-ray emission from cluster galaxies.
![[Uncaptioned image]](/html/astro-ph/0403216/assets/x10.png)
In Fig.2.5 we show a comparison of the luminosities derived here with those reported in Dow & White (1995). Apart from the two central galaxies, the luminosities for the other seven sources are within a factor of two of each other. The next most significant deviations are NGC 4839, another central galaxy mentioned above, and NGC 4911 (GMP 2374), the only source were the XMM flux is significantly higher. As mentioned previously, the origin of the X-ray emission from NGC 4011 is likely to be AGN activity, for which variability by a factor of two is not surprising.
For some other galaxies, namely: NGC 4860, 4840, CGCG1256.1+2817, IC4040 (GMP 3792, 4829, 4230, 2559) the fluxes agree within the reported ROSAT PSPC error bars. For NGC4898 (GMP 2794/2798), we find a factor of two fainter source. This source is close to the center of Coma, so the different spatial resolution between ROSAT and XMM may cause the discrepancy.
We do not confirm the reported detections for NGC 4854 or IC 3959 (GMP 4017 or 3730). Our () upper limit on X-ray emission from NGC 4854 is a factor of 3 lower than the detection of Dow & White (1995). As for IC 3959 we detect a point source identified with a faint optical point-like object within the PSPC aperture. This object, being more than one effective radius away from the galaxy ( compared to ), was dropped from the list. We identify this X-ray source with a background quasar. For the two central giant galaxies NGC 4889 and 4874 our flux estimate is consistent with Chandra (Vikhlinin et al. 2001) if we take into account the somewhat larger aperture of XMM used for our flux extraction.
3 The nature of the X-ray emission from Coma cluster galaxies
Although a number of X-ray detected galaxies exhibit star-formation activity, as indicated by the UV (FOCA) observations of Donas et al. (1995), no optical morphology peculiarities are seen on the DSS2 plates (except possibly for dwarfs).
We note that a typical X-ray luminosity of galaxies in Coma does not exceed ergs s-1, implying that exotic sources associated for example with extreme star-burst galaxies, such as the Antennae (Zezas et al. 2002) are not present in our sample. Luminosities up to ergs s-1 are not unexpected even for the two dwarf galaxies we detect (GMP 2550, 4718), because these two reveal signatures of an ongoing merger.
![[Uncaptioned image]](/html/astro-ph/0403216/assets/x11.png)
![[Uncaptioned image]](/html/astro-ph/0403216/assets/x12.png)
To address the question of the origin of the X-ray emission from Coma galaxies, we study their X-ray colors in Fig. 3. The two grids given in the figure allow us to disentangle the role of the diffuse emission from the AGN activity in determining the X-ray luminosity. Optically luminous gas-poor galaxies, whose emission is dominated by integrated flux from point sources (LMXB) are expected to be found within the power-law grid, as this emission is characterized by a power law of photon index 1.4 and galactic nH (e.g. Finoguenov & Jones 2001). From Fig.3 it is clear that most of the sources have quite soft spectra, indicating a thermal origin from diffuse gas. Some of the sources show spectral hardening, possibly due to non-negligible contribution from an unresolved population of LMXB.
3.1 LLB relation
The LLB diagram is a fundamental diagnostic tool for assessing the nature of the X-ray emission from Coma galaxies compared to galaxies detected in other surveys of the local universe with better spatial and spectral resolution. Fig.3 presents such a diagram. Approximately 14 objects are consistent with all the emission coming from discrete point sources, when corrected for aperture effects. This correction takes into account that only a small fraction of the galaxy is observed in the present survey. Inclusion of a larger fraction would lead to an overestimate of the flux due to the high level of X-ray emission from the Coma ICM, which determines the effective background of our X-ray data. For the remaining two-thirds of the sample, the contribution from discrete point sources is negligible. To isolate possible star-bursting objects, which are known to have their X-ray luminosity significantly enhanced, we separate the sample according the UV-B color. There is one detected dwarf star-forming galaxy with an to ratio similar to the local galaxy Holmberg II (see Zezas et al. 1999).

4 The X-ray luminosity function of Coma galaxies
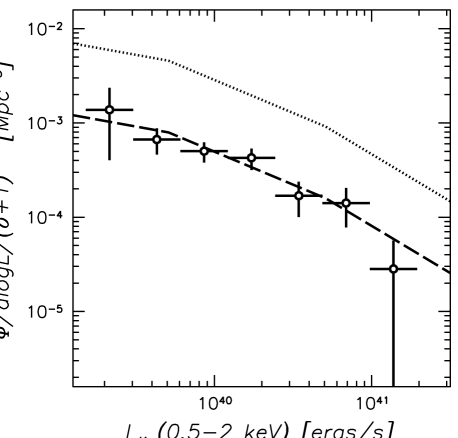
To determine the Coma galaxy luminosity function, we divide the number of detected galaxies by the Lagrangian volume (, where is the total gravitational mass of the cluster) surveyed as a function of the flux. We perform volume estimates for the main cluster and the infalling NGC 4839 subcluster separately applying the NFW dark-matter profile, and the corresponding virial () radius estimate of 4.0 and 2.6 Mpc (for CDM, Pierpaoli et al. 2001), using the relation of Finoguenov et al. (2001). The resulting Lagrangian volume is plotted in the left panel of Fig.12. As it can be seen from the figure, it is important to account for the substructure, due to inhomogeneous sensitivity of the survey.
The estimate of the total Lagrangian volume of the main cluster is Mpc3, where , so we survey 90% of the virial mass. The mean radius of the survey in the observer’s plane is 1.3 Mpc. A sphere of this radius is characterized by a Lagrangian volume of 52000 Mpc3, 57% of the survey volume.
The local luminosity function of X-ray sources by Hasinger (1998), scaled to our assumption of km s-1 Mpc-1 is given in the right panel of Fig.12.
The results of the CfA redshift survey (Santiago & Strauss 1992) show that the mean density of the typical volume covered by the local luminosity function of Hasinger (1998) is three times the mean density of the Universe. To provide a valid comparison, we further scale down the luminosity function of Hasinger (1998) by a factor of 3 since we normalize our Coma galaxy luminosity function to the mean density of the Universe.
We conclude that the X-ray emission of galaxies in the Coma cluster is quenched on average by a factor of 5.6. We estimate this factor from the difference between the luminosity function in the field and in the Coma cluster. It seems natural to attribute this result to reduced star-formation activity in cluster galaxies. Finoguenov & Miniati (2004) show the ellipticals in Coma have X-ray emission typical of the early-type galaxies found outside the cluster environment. Thus, differences in the luminosity functions between the Coma cluster and the field are due to preponderance of cluster galaxies with low X-ray to optical flux ratios.
Acknowledgements.
The paper is based on observations obtained with XMM-Newton, an ESA science mission with instruments and contributions directly funded by ESA Member States and the USA (NASA). The XMM-Newton project is supported by the Bundesministerium für Bildung und Forschung/Deutsches Zentrum für Luft- und Raumfahrt (BMFT/DLR), the Max-Planck Society and the Heidenhain-Stiftung, and also by PPARC, CEA, CNES, and ASI. The authors thank the referee, Bill Forman, for useful comments, which improved the presentation of the material of this work. AF acknowledges support from BMBF/DLR under grant 50 OR 0207 and MPG. AF profited from discussions with Guenther Hasinger, Wolfgang Pietsch, Gyula Szokoly, Bianca Poggianti, Michael Freyberg and Alexey Vikhlinin. USNO, DSS2, ADS and NED services are acknowledged.References
- (1) Arnaud, M., Aghanim, N., Gastaud, R., et al. 2001, A&A, 365, L67
- (2) Bravo-Alfaro, H., Cayatte, V., van Gorkom, J.H., Balkowski, C. 2001, A&A, 379, 347
- (3) Briel, U.G., Henry, J.P., Lumb, D.H., et al. 2001, A&A, 365, L60
- (4) Briel, U.G., Finoguenov, A., Henry, J.P. 2003, A&A in preparation
- (5) Donas, J., Milliard, B., Laget, M. 1995, A&A, 303, 661
- (6) Dow, K.L., White, S.D.M. 1995, ApJ, 439, 113
- (7) Finoguenov, A., Jones, C. 2001, ApJ, 547, 107
- (8) Finoguenov, A., Reiprich T., Boehringer H. 2001, A&A, 368, 749
- (9) Finoguenov, A., Miniati, F. 2004, A&A, subm.
- (10) Forman, W., Jones, C., Tucker, W. 1985, ApJ, 293, 102
- (11) Gaetz, T.J., Salpeter, E.E., Shaviv, G. 1987, ApJ, 316, 530
- (12) Gavazzi, G., Boselli, A., Donati, A., Franzetti, P., Scodeggio, M. 2003, A&A, 400, 451
- (13) Georgakakis, A., Georgantopoulos, I., Vallbé, M., et al. 2003, MNRAS, subm. (astro-ph/0311609)
- (14) Ghizzardi, S. 2001, XMM Calibration report EPIC-MCT-TN-011
- (15) Giacconi, R., Zirm, A., Wang, J., et al. 2002, ApJS, 139, 369
- (16) Godwin, J. G., Metcalfe, N., Peach, J. V. 1983, MNRAS, 202, 113
- (17) Grimm, H.-J., Gilfanov, M., Sunyaev, R. 2003, MNRAS, 339, 793
- (18) Hasinger, G., 1998, AN, 319, 37
- (19) Hasinger, G., Altieri, B., Arnaud, M., et al. 2001, A&A, 365, 45
- (20) Jansen, F., Lumb, D., Altieri, B., et al. 2001, A&A, 365, L1
- (21) Irwin, J.A., Athey, A.E., Bregman, J.N. 2003, ApJ, 587, 356
- (22) Lumb, D.H., Finoguenov, A., Saxton, R., et al. 2003, SPIE, 4851, 255
- (23) Matsushita, K. 2001, ApJ, 547, 693
- (24) Neumann, D. M., Arnaud, M., Gastaud, R., et al. 2001, A&A, 365, L74
- (25) Neumann, D.M., Lumb, D.H., Pratt, G.W., Briel, U.G. 2003, A&A, 400, 811
- (26) Pierpaoli, E., Scott, D., White, M. 2001, MNRAS, 325, 77
- (27) Pietsch, W., Vogler, A., Kahabka, P., Jain, A., Klein, U. 1994 A&A, 284, 386
- (28) Poggianti, B.M., Bridges, T.J., Mobasher, B., et al. 2001, ApJ, 562, 689
- (29) Santiago, B.X., Strauss, M.A. 1992, ApJ, 387, 9
- (30) Vikhlinin, A., Forman, W., Jones, C. 1994, ApJ, 435, 162
- (31) Vikhlinin, A., Forman, W., Jones, C. 1997, ApJ, 474, L7
- (32) Vikhlinin, A., McNamara, B.R., Forman, W., Jones, C., Quintana, H., Hornstrup, A. 1998, ApJ, 502, 558
- (33) Vikhlinin, A., Markevitch, M., Forman, W., Jones, C. 2001, ApJ, 555, L87
- (34) White, S.D.M., Briel, U.G., Henry, J.P. 1993, MNRAS, 261, L8
- (35) Zezas, A., Georgantopoulos, I., Ward, M.J. 1999, MNRAS, 308, 302
- (36) Zezas, A., Fabbiano, G., Rots, A.H., Murray, S.S. 2002, ApJS, 142, 239
| X | B-R | GMP | separ. | X-ray source J2000 | counts s-1, band (keV): | |||||||
|---|---|---|---|---|---|---|---|---|---|---|---|---|
| numb. | ′′ | ′′ | RA Decl. | ergs s-1 cm-2 | 0.5–2 | 0.5–1 | 1–2 | 2-4.5 | ||||
| 19 | 9.88 | – | 15.9 | 1576 | 11.25 | 195.5540 | 28.2142 | |||||
| 25 | 10.04 | – | 22.4 | 1616 | 16.31 | 195.5345 | 27.6476 | |||||
| 33 | 9.84 | – | 12.8 | 1681 | 8.92 | 195.5013 | 27.7822 | |||||
| 35 | 8.77 | 2.21 | 8.9 | 1688 | 11.48 | 195.4981 | 27.3878 | |||||
| 38 | 10.21 | – | 34.9 | 1715 | 7.02 | 195.4899 | 28.0056 | |||||
| 45 | 10.53 | – | 47.7 | 1750 | 8.16 | 195.4742 | 27.6234 | |||||
| 63 | 8.30 | 2.60 | 6.7 | 1904 | 8.51 | 195.4243 | 27.1215 | |||||
| 71 | 8.91 | 2.27 | 9.1 | 1940 | 10.40 | 195.4088 | 27.5915 | |||||
| 94 | 10.78 | – | 68.8 | 2059 | 5.72 | 195.3586 | 27.8860 | |||||
| 138 | 10.63 | – | 47.3 | 2374 | 7.41 | 195.2339 | 27.7908 | |||||
| 141 | 10.40 | – | 47.4 | 2390 | 8.97 | 195.2269 | 28.0064 | |||||
| 151 | 10.17 | – | 25.3 | 2413 | 5.93 | 195.2165 | 28.3653 | |||||
| 169 | 10.06 | – | 26.6 | 2516 | 14.12 | 195.1740 | 27.9754 | |||||
| 177 | 8.45 | 1.36 | 8.4 | 2550 | 2.87 | 195.1602 | 28.0098 | |||||
| 179 | 10.02 | – | 22.8 | 2559 | 15.45 | 195.1598 | 28.0576 | |||||
| 181 | 8.21 | 2.63 | 4.9 | 2566 | 5.36 | 195.1544 | 28.2665 | |||||
| 184 | 9.86 | – | 20.7 | 2599 | 15.05 | 195.1432 | 27.6376 | |||||
| 207 | 9.12 | 1.64 | 10.4 | 2725 | 7.49 | 195.0928 | 28.3999 | |||||
| 209 | 10.25 | – | 26.7 | 2798 | 4.37 | 195.0721 | 27.9566 | |||||
| 225 | 7.85 | 1.26 | 4.3 | 2888 | 5.89 | 195.0433 | 28.1300 | |||||
| 231 | 11.14 | – | 112.7 | 2921 | 8.51 | 195.0343 | 27.9766 | |||||
| 238 | 10.26 | – | 42.1 | 2975 | 7.14 | 195.0180 | 27.9878 | |||||
| 246 | 10.30 | – | 40.6 | 3055 | 5.26 | 194.9904 | 28.2467 | |||||
| 263 | 7.83 | 2.09 | 4.9 | 3152 | 7.53 | 194.9500 | 27.9944 | |||||
| 265 | 9.91 | – | 24.8 | 3170 | 3.12 | 194.9437 | 27.9744 | |||||
| 274 | 9.48 | – | 16.2 | 3262 | 19.11 | 194.9186 | 27.8589 | |||||
| 275 | 9.74 | – | 20.7 | 3269 | 11.21 | 194.9161 | 27.9544 | |||||
| 281 | 11.08 | – | 129.1 | 3329 | 5.24 | 194.8985 | 27.9589 | |||||
| 291 | 9.44 | – | 14.1 | 3403 | 15.10 | 194.8797 | 27.7900 | |||||
| 294 | 9.87 | – | 20.2 | 3423 | 7.64 | 194.8721 | 27.8500 | |||||
| 301 | 10.38 | – | 37.5 | 3561 | 26.35 | 194.8329 | 28.0911 | |||||
| 307 | 9.28 | 0.74 | 16.1 | 3585 | 14.75 | 194.8221 | 27.5911 | |||||
| 308 | 8.38 | 1.89 | 6.2 | 3606 | 8.38 | 194.8193 | 27.8955 | |||||
| 312 | 9.98 | – | 36.1 | 3656 | 29.63 | 194.8140 | 28.0788 | |||||
| 314 | 9.92 | – | 20.9 | 3661 | 8.97 | 194.8073 | 27.4022 | |||||
| 315 | 10.31 | – | 36.1 | 3664 | 7.94 | 194.8041 | 27.9777 | |||||
| 324 | 10.32 | – | 38.6 | 3792 | 4.86 | 194.7661 | 28.1232 | |||||
| 326 | 9.94 | – | 23.3 | 3816 | 5.93 | 194.7586 | 28.1165 | |||||
| 327 | 10.02 | – | 21.6 | 3818 | 7.86 | 194.7571 | 28.2254 | |||||
| 336 | 10.14 | – | 22.5 | 3896 | 11.62 | 194.7314 | 27.8321 | |||||
| 347 | 7.86 | 2.05 | 4.3 | 4028 | 5.93 | 194.6936 | 27.3565 | |||||
| 363 | 9.95 | – | 16.1 | 4135 | 7.14 | 194.6540 | 27.1753 | |||||
| 366 | 10.44 | – | 28.5 | 4156 | 6.28 | 194.6466 | 27.5964 | |||||
| 369 | 9.80 | – | 18.6 | 4159 | 9.41 | 194.6425 | 27.2642 | |||||
| 377 | 9.00 | 1.38 | 13.9 | 4188 | 13.47 | 194.6293 | 28.3774 | |||||
| 382 | 10.12 | – | 29.2 | 4230 | 9.65 | 194.6228 | 28.0174 | |||||
| 392 | 10.04 | – | 25.0 | 4315 | 11.07 | 194.5915 | 27.9662 | |||||
| 400 | 9.45 | – | 11.7 | 4351 | 10.05 | 194.5774 | 27.3095 | |||||
| 401 | 7.89 | 0.91 | 4.4 | 4358 | 5.27 | 194.5702 | 28.3061 | |||||
| 417 | 10.39 | – | 28.9 | 4471 | 6.63 | 194.5237 | 28.2427 | |||||
| 418 | 9.75 | – | 17.9 | 4499 | 13.02 | 194.5166 | 27.8149 | |||||
| 419 | 8.90 | 1.76 | 6.1 | 4513 | 6.32 | 194.5078 | 28.4560 | |||||
| 425 | 9.76 | 1.50 | 20.0 | 4555 | 5.76 | 194.4905 | 28.0604 | |||||
| 432 | 9.64 | – | 20.7 | 4592 | 10.17 | 194.4785 | 27.6148 | |||||
| 433 | 9.50 | 1.11 | 16.1 | 4579 | 16.49 | 194.4774 | 27.5814 | |||||
| 434 | 9.64 | – | 19.5 | 4597 | 9.59 | 194.4766 | 27.4903 | |||||
| 438 | 7.99 | 1.80 | 4.2 | 4615 | 6.82 | 194.4669 | 27.6981 | |||||
| 444 | 9.80 | – | 17.1 | 4648 | 19.21 | 194.4509 | 28.1747 | |||||
| 454 | 8.71 | 2.27 | 8.1 | 4715 | 7.41 | 194.4297 | 27.6068 | |||||
| 456 | 8.88 | 1.79 | 10.2 | 4718 | 8.10 | 194.4238 | 27.7957 | |||||
| 464 | 9.67 | – | 14.8 | 4792 | 8.27 | 194.4002 | 27.4856 | |||||
| 466 | 10.09 | – | 23.9 | 4794 | 7.01 | 194.3989 | 27.4934 | |||||
| 473 | 10.25 | – | 32.6 | 4829 | 7.36 | 194.3870 | 27.6100 | |||||
| 476 | 7.88 | 1.95 | 4.5 | 4843 | 3.56 | 194.3819 | 27.3867 | |||||
| 477 | 9.87 | – | 20.8 | 4849 | 12.87 | 194.3765 | 28.1888 | |||||
| 484 | 9.82 | – | 15.1 | 4907 | 11.02 | 194.3586 | 27.5443 | |||||
| 486 | 9.78 | – | 15.8 | 4918 | 7.98 | 194.3543 | 27.4032 | |||||
| 489 | 10.79 | – | 79.5 | 4928 | 8.34 | 194.3513 | 27.4976 | |||||
| 498 | 9.51 | – | 10.3 | 4987 | 4.83 | 194.3193 | 27.6186 | |||||
| 515 | 9.74 | – | 19.9 | 5038 | 5.59 | 194.2942 | 27.4041 | |||||
| 558 | 9.11 | 1.81 | 16.5 | 5254 | 2.14 | 194.1949 | 27.2936 | |||||
| 560 | 10.52 | – | 49.7 | 5279 | 11.27 | 194.1820 | 27.1780 | |||||
| 569 | 9.81 | – | 20.1 | 5364 | 8.13 | 194.1418 | 27.5377 | |||||
| S | B-R | GMP | separ. | X-ray source J2000 | counts s-1, band (keV): | |||||||
|---|---|---|---|---|---|---|---|---|---|---|---|---|
| numb. | ′′ | ′′ | RA Decl. | ergs s-1 cm-2 | 0.5–2 | 0.5–1 | 1–2 | 2-4.5 | ||||
| 6 | 10.63 | – | 47.3 | 2374 | 11.63 | 195.2351 | 27.7908 | |||||
| 7 | 10.40 | – | 47.4 | 2390 | 8.97 | 195.2269 | 28.0064 | |||||
| 22 | 10.06 | – | 26.6 | 2516 | 14.20 | 195.1727 | 27.9698 | |||||
| 26 | 10.02 | – | 22.8 | 2559 | 17.12 | 195.1590 | 28.0565 | |||||
| 43 | 8.30 | 1.9 | 7.7 | 2755 | 8.57 | 195.0797 | 27.9944 | |||||
| 45 | 9.72 | – | 18.0 | 2798 | 1.80 | 195.0733 | 27.9566 | |||||
| 50 | 8.90 | 1.4 | 13.3 | 2856 | 16.24 | 195.0495 | 28.0533 | |||||
| 52 | 7.85 | 1.3 | 4.3 | 2888 | 5.89 | 195.0433 | 28.1300 | |||||
| 54 | 9.40 | – | 12.7 | 2897 | 12.34 | 195.0418 | 27.8611 | |||||
| 56 | 11.14 | – | 112.7 | 2921 | 8.82 | 195.0343 | 27.9777 | |||||
| 59 | 9.48 | – | 17.8 | 2960 | 10.25 | 195.0205 | 28.0222 | |||||
| 60 | 10.26 | – | 42.1 | 2975 | 2.73 | 195.0167 | 27.9878 | |||||
| 76 | 7.87 | 1.2 | 5.6 | 3107 | 5.24 | 194.9651 | 27.9956 | |||||
| 80 | 7.83 | 2.1 | 4.9 | 3152 | 7.74 | 194.9500 | 27.9933 | |||||
| 82 | 8.46 | 1.2 | 9.2 | 3220 | 10.39 | 194.9261 | 28.1333 | |||||
| 89 | 11.08 | – | 129.1 | 3329 | 5.24 | 194.8985 | 27.9589 | |||||
| 95 | 10.13 | – | 30.5 | 3367 | 3.29 | 194.8846 | 27.9833 | |||||
| 98 | 9.44 | – | 14.1 | 3403 | 15.27 | 194.8759 | 27.7878 | |||||
| 99 | 9.87 | – | 20.2 | 3423 | 12.14 | 194.8734 | 27.8500 | |||||
| 100 | 9.61 | – | 22.8 | 3471 | 11.86 | 194.8582 | 28.0022 | |||||
| 102 | 10.20 | – | 34.0 | 3510 | 32.71 | 194.8545 | 27.9077 | |||||
| 107 | 10.38 | – | 37.5 | 3561 | 26.35 | 194.8329 | 28.0911 | |||||
| 113 | 10.31 | – | 36.1 | 3664 | 16.78 | 194.8066 | 27.9777 | |||||
| 115 | 8.30 | 2.5 | 7.7 | 3702 | 9.62 | 194.7916 | 27.8866 | |||||
| 119 | 9.96 | – | 26.1 | 3761 | 22.91 | 194.7751 | 27.9910 | |||||
| 120 | 10.08 | – | 32.9 | 3730 | 27.02 | 194.7755 | 27.7877 | |||||
| 123 | 10.32 | – | 38.6 | 3792 | 6.51 | 194.7661 | 28.1254 | |||||
| 124 | 9.94 | – | 23.3 | 3816 | 22.35 | 194.7560 | 28.1099 | |||||
| 130 | 10.14 | – | 22.5 | 3896 | 11.62 | 194.7314 | 27.8321 | |||||
| 131 | 9.42 | – | 13.8 | 3943 | 12.43 | 194.7214 | 27.8165 | |||||
| 141 | 8.19 | 1.7 | 5.4 | 4148 | 2.06 | 194.6454 | 28.0486 | |||||
| 147 | 10.12 | – | 29.2 | 4230 | 15.42 | 194.6215 | 28.0185 | |||||
| 149 | 10.04 | – | 25.0 | 4315 | 11.07 | 194.5915 | 27.9662 | |||||
| ID | ′′ | CGCG | U | B | V | GMP | ||
|---|---|---|---|---|---|---|---|---|
| X019 | 9.99 | 15.9 | 160108 | 8323 | 15.72 | 15.86 | 15.34 | 1576 |
| X025 | 10.15 | 22.4 | 160106 | 6876 | 15.43 | 15.34 | 14.66 | 1616 |
| X033 | 10.03 | 12.8 | 160104 | 7213 | 0.00 | 15.79 | 0.00 | 1681 |
| X038 | 10.27 | 34.9 | 160105 | 7747 | 0.00 | 14.90 | 13.81 | 1715 |
| X045 | 10.55 | 47.7 | 160103 | 7874 | 0.00 | 14.24 | 13.17 | 1750 |
| X094 | 10.71 | 68.8 | 160095 | 5482 | 14.03 | 13.52 | 12.55 | 2059 |
| X138 | 10.71 | 47.3 | 160260 | 7985 | 14.01 | 13.73 | 12.86 | 2374 |
| X141 | 10.27 | 47.4 | 160259 | 4964 | 15.06 | 14.52 | 13.52 | 2390 |
| X151 | 10.23 | 25.3 | 160091 | 7647 | 0.00 | 15.06 | 0.00 | 2413 |
| X179 | 10.15 | 22.8 | 160252 | 7718 | 15.19 | 15.38 | 14.71 | 2559 |
| X184 | 10.03 | 20.7 | 160086 | 7499 | 15.61 | 15.77 | 15.36 | 2599 |
| X209 | 10.31 | 26.7 | 160248 | 6848 | 15.29 | 14.79 | 13.76 | 2798 |
| X231 | 10.99 | 112.7 | 160241 | 6517 | 13.18 | 12.59 | 11.55 | 2921 |
| X238 | 10.15 | 42.1 | 160239 | 6397 | 15.71 | 15.36 | 14.36 | 2975 |
| X246 | 10.31 | 40.6 | 160238 | 6730 | 15.29 | 14.77 | 13.74 | 3055 |
| X265 | 9.95 | 24.8 | 160236 | 9400 | 16.33 | 15.87 | 14.84 | 3170 |
| X281 | 10.71 | 129.1 | 160231 | 7189 | 13.68 | 13.12 | 12.09 | 3329 |
| X294 | 9.99 | 20.2 | 160226 | 6950 | 16.59 | 15.82 | 14.79 | 3423 |
| X301 | 10.35 | 37.5 | 160224 | 4643 | 15.26 | 14.71 | 13.74 | 3561 |
| X314 | 10.03 | 20.9 | 160074 | 5633 | 0.00 | 15.68 | 0.00 | 3661 |
| X315 | 10.27 | 36.1 | 160221 | 6760 | 15.19 | 14.60 | 13.55 | 3664 |
| X324 | 10.31 | 38.6 | 160215 | 7966 | 15.28 | 14.74 | 13.69 | 3792 |
| X326 | 9.99 | 23.3 | 160213 | 9386 | 15.61 | 15.85 | 15.26 | 3816 |
| X327 | 10.07 | 21.6 | 160214 | 8028 | 0.00 | 15.45 | 0.00 | 3818 |
| X336 | 10.23 | 22.5 | 160212 | 7549 | 15.38 | 15.10 | 14.30 | 3896 |
| X363 | 10.03 | 16.1 | 160067 | 7653 | 15.40 | 15.58 | 15.19 | 4135 |
| X366 | 10.51 | 28.5 | 160068 | 7550 | 14.65 | 14.44 | 13.67 | 4156 |
| X369 | 10.03 | 18.6 | 160064 | 7368 | 0.00 | 15.98 | 15.59 | 4159 |
| X382 | 10.19 | 29.2 | 160065 | 7188 | 0.00 | 15.17 | 0.00 | 4230 |
| X392 | 10.07 | 25.0 | 160063 | 6044 | 15.92 | 15.36 | 14.36 | 4315 |
| X417 | 10.51 | 28.9 | 160055 | 7164 | 14.53 | 14.46 | 13.78 | 4471 |
| X418 | 9.91 | 17.9 | 160053 | 7205 | 0.00 | 16.04 | 0.00 | 4499 |
| X444 | 9.99 | 17.1 | 160049 | 7245 | 0.00 | 15.96 | 14.98 | 4648 |
| X466 | 10.23 | 23.9 | 160046 | 7317 | 0.00 | 15.32 | 0.00 | 4794 |
| X473 | 10.27 | 32.6 | 160042 | 6097 | 15.45 | 14.88 | 13.86 | 4829 |
| X477 | 10.03 | 20.8 | 160043 | 7078 | 0.00 | 15.61 | 0.00 | 4849 |
| X484 | 10.07 | 15.1 | 160040 | 5523 | 0.00 | 15.90 | 0.00 | 4907 |
| X489 | 10.75 | 79.5 | 160039 | 7318 | 13.81 | 13.29 | 12.21 | 4928 |
| X560 | 10.55 | 49.7 | 160028 | 7610 | 0.00 | 14.21 | 13.20 | 5279 |
| S119 | 9.95 | 26.1 | 160216 | 7895 | 16.12 | 15.62 | 14.59 | 3761 |
| ID | ′′ | GMP | memb. | /comment | |
|---|---|---|---|---|---|
| X169 | 10.06 | 26.6 | 2516 | M | 6363 |
| S054 | 9.40 | 12.7 | 2897 | M? | 9902/confusion |
| S059 | 9.48 | 17.8 | 2960 | M | 5786 |
| S095 | 10.13 | 30.5 | 3367 | M | 5848 |
| X291 | 9.44 | 14.1 | 3403 | M | 7825 |
| S100 | 9.61 | 22.8 | 3471 | M | 6684 |
| S131 | 9.42 | 13.8 | 3943 | M | 5496 |
| X400 | 9.45 | 11.7 | 4351 | M | 7447 |
| X425 | 9.76 | 20.0 | 4555 | M | 8299 |
| X433 | 9.50 | 16.1 | 4579 | M | 4999 |
| X464 | 9.67 | 14.8 | 4792 | M | 7234 |
| X486 | 9.78 | 15.8 | 4918 | M | 4857 |
| X498 | 9.51 | 10.3 | 4987 | M | 7257 |
| X515 | 9.74 | 19.9 | 5038 | M | 6215 |
| X558 | 9.11 | 16.5 | 5254 | M | 7787 |
| X569 | 9.81 | 20.1 | 5364 | M | 7105 |
| X177 | 8.45 | 8.4 | 2550 | M? | merger |
| X456 | 8.88 | 10.2 | 4718 | M? | FOCA |
| X476 | 7.88 | 4.5 | 4843 | B? | |
| X181 | 8.21 | 4.9 | 2566 | B | |
| X207 | 9.12 | 10.4 | 2725 | B | 27281 |
| X274 | 9.48 | 16.2 | 3262 | F | 3747 |
| X419 | 8.90 | 6.1 | 4513 | B | |
| X432 | 9.64 | 20.7 | 4592 | B | 20320 |
| S141 | 8.19 | 5.4 | 4148 | B |