Using Chandra/LETG spectra to probe stellar coronae
Abstract
We probe the relationship between surface magnetic fields and the X-ray emitting corona in the rapidly rotating star AB Dor. Circularly polarised spectra have been inverted to produce a surface (photospheric) magnetic field map. This surface map has been extrapolated to model AB Dor’s coronal field topology and X-ray light curve. Chandra/LETG light curves of AB Dor from the same epoch show intrinsic variability at the 30% level. Period analysis indicates a fraction of this is due to rotational modulation. We measure velocity shifts in emission line centroids as a function of and find evidence of rotational modulation (max. vel. km s-1). This modulation may indicate the presence of a localised X-ray emitting region at mid-to-high latitudes.
Astrophysics Division, Research and Science Support Department of ESA, ESTEC, Postbus 299, NL-2200 AG Noordwijk, The Netherlands
Harvard Smithsonian CfA, 60 Garden St, Cambridge MA02138, USA
School of Physics & Astronomy, Univ. of St Andrews, Fife, UK
Laboratoire d’Astrophysique, Observ. Midi-Pyrénées, Toulouse, France
1. Introduction
We present the first results from a co-ordinated optical and X-ray campaign to probe the corona of a rapidly rotating, active cool star. New X-ray and EUV observations reveal a picture of stellar coronae unlike anything on the Sun. Emission measures of about cm-3 are found in plasma at temperatures of 8 MK and beyond, even in relatively quiescent coronae (e.g. Sanz-Forcada et al. 2003). Emission measures peak at cm-3 at 2.5 MK on the Sun in active regions (Drake et al. 2000). While the thermal properties of active stellar coronae are increasingly well-determined, we have yet to establish where this emission originates and to confront observations with theoretical models.
Previous studies provide evidence for both extended and compact coronae in active cool stars. The extended coronal model is supported by observations of fast moving cool ( K) H absorption transients in young stars. These are caused by prominences rigidly corotating with the star at heights beyond the Keplerian corotation radius (Collier Cameron et al. 2001). Further support for extended coronae comes from time-resolved HST spectroscopy of the eclipsing binary, V471 Tau (K2V+DA). The hot white dwarf acts as a probe of circumstellar material around the K2V enabling Walter (this volume) to detect transition region temperature plasma ( K) above 2 .
Support for compact coronae comes from X-ray light curves of the eclipsing binary, Algol (B8V+K2III). Flaring regions are found to have heights, above the K star (Schmitt & Favata 1999, Schmitt et al. 2003). Maggio et al. (2000) find evidence for a small flaring region ( ) on the single, K0V, AB Dor. likely to be located near its pole. Electron density diagnostics measured in K plasma in active stars are typically very high ( cm-3). Densities this high are more easily explained in terms of compact X-ray emitting regions (e.g. Sanz-Forcada et al. 2003).
Brickhouse et al. (2001) find evidence for compact, quiescent coronae in active stars in a Chandra/HETG study of the contact binary, 44i Boo (G0V & G0V), spanning over 2.5 . Flaring emission is filtered out and velocity shifts in line centroids of emission line profiles are measured as a function of rotation phase. Rotational modulation in the quiescent corona is detected, indicating a compact emitting area near the pole of the primary. We want to follow up on this latter study in order to learn whether the picture of compact stellar coronae is applicable to other active cool stars or whether it is exclusive to contact binaries.
1.1. AB Doradus
AB Doradus (K0V, =6.9, =0.51 d, v=90 km s-1) is an active, rapidly rotating single star that has recently arrived onto the main sequence. It is an ideal candidate for spectroscopic mapping techniques such as Doppler imaging as its 12.4 hour rotation period means that a large fraction of its surface can be tracked in one night, and its rotationally broadened spectral line profiles enable detailed surface maps to be reconstructed (∘ longitude resolution at the equator). Spot maps of AB Dor’s surface typically show a dark spot covering its pole (polar cap) with smaller spots co-existing at lower latitudes (e.g. Donati et al. 1999). AB Dor is also bright in X-ray wavelengths, , and shows strong signs of coronal variability. ROSAT X-ray light curves of AB Dor indicate rotational modulation at the 5-13% level (Kuerster et al. 1997).
2. Coronal field modelling
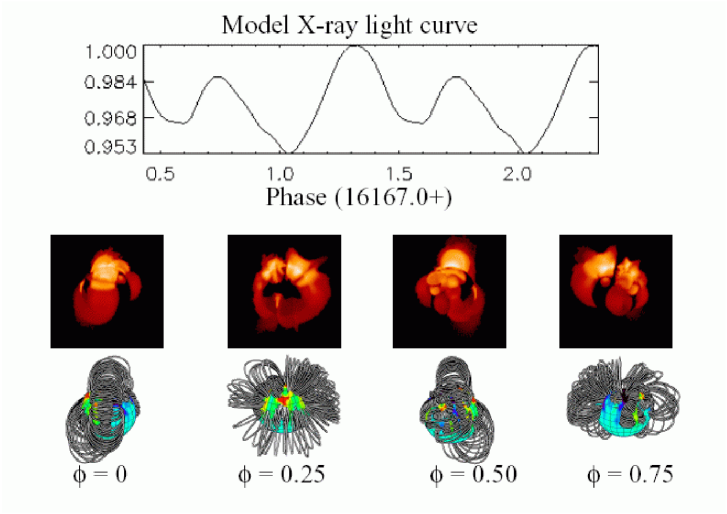
A time-series of high-resolution circularly polarised spectra was acquired using the AAT/UCLES/Semel polarimeter setup between 2002 Dec 11 to 14. These spectra are used to generate an X-ray model of AB Dor and to predict its quiescent X-ray lightcurve at this epoch using the following steps (also see Fig. 1).
First, circularly polarised spectra are inverted using Zeeman Doppler imaging (Semel 1989; Donati et al 2000). The resulting magnetic field maps are extrapolated assuming that the field is potential and open (i.e. not emitting) beyond 3.4 (Jardine et al. 2001). If the closed corona is isothermal and in hydrostatic equilibrium the 3-D X-ray emission model of AB Dor is as depicted in Fig. 1. X-ray “snapshots” like these are used to predict the quiescent X-ray light curve of AB Dor between 2002 Dec 11 to Dec 14. This model light curve predicts X-ray rotational modulation at the 5% level in AB Dor’s quiescent corona.
3. Chandra/LETG spectra
We observed AB Dor using the Chandra/LETG instrument on 2002 December 11 over 88 ksec (1.98 ). The LETG spectra span a wavelength range from Å, with spectral resolution ranging from ( at the longest wavelengths). Measuring line centroids as precisely as possible is crucial for this analysis, so it would make sense to use the best spectrally resolved lines in this dataset. In this regard, however, LETG spectra present two challenges. Firstly, the highest wavelength lines in the dataset are also the noisiest with the strongest background (Fig. 2b). This clearly affects our centroiding capability. The second challenge is that the LETG wavelengths are poorly calibrated (S.M. Chung priv. comm.). We compensate for these deficiencies in the following ways:
We measure the discrepancy, , between the observed wavelength position of the strongest emission lines and the theoretical wavelength, (using the atomdb database). This is used to correct the wavelength position of the observed line profile and is used to convert the wavelength scale into velocity-space. The 88 ksec exposure is then divided up into eight quarter-phase bins. To improve our centroiding capability, we integrate over the six strongest lines in the high spectral resolution region (Å). This integration is done by converting the six strongest lines between Å into velocity-space, rebinning them onto the same velocity scale and then integrating the counts from all the lines (Brickhouse, this volume). We measure line centroids by fitting Gaussians to the “summed” line at each of the eight quarter-phase bins. The centroid of this summed line profile is measured with a precision of km s-1 (Fig. 3). In practise, we find that the strong O viii 18.97 Å line can be measured with an equivalent level of precision ( km s-1) despite its relatively poor resolution.


4. Discussion
Fig. 3 shows the X-ray light curve for AB Dor. We find that the light curve varies by 30%. Initial periodogram analyses indicate that a fraction of this is indeed due to rotational modulation. We will use the method used by Kürster et al. (1997) to filter this X-ray light curve in order to distinguish the rotationally modulated component. This rotationally modulated component of the light curve will be compared with the predicted light curve in Fig. 1. Our 3-D coronal model of AB Dor can also be refined, we can compensate for missing magnetic field information (e.g. in the polar cap). However, only a unipolar spot should significantly modify the coronal field distribution (McIvor et al. 2003). We will also evaluate the effect on the predicted X-ray lightcurve if the global magnetic field is non-potential using the technique described by Hussain et al. (2002).
Measurements of the centroids of the best resolved spectral lines (the summed profile derived using the above method and O viii 18 Å line) show evidence of rotational modulation that repeats from one rotation cycle to the next. Even though both the O viii 18 Å and the summed line profile show the same trend, the uncertainty associated with our velocity shift measurements makes this result somewhat inconclusive. This pattern of rotational modulation would indicate that the bulk of quiescent X-ray emission in AB Dor (at this epoch) originated in localised regions, most likely at high latitudes (60∘). Emission originating at the pole would show no rotational modulation. We will add more lines from the longer wavelengths ( Å) to reduce the error bars on this measurement.
References
Brickhouse,N.S., Dupree, A.K. & Young, P.R. 2001, ApJ 562, L75
Collier Cameron,A., Jardine, M.M. & Donati, J.-F. 2002, in
ASP Conf. Proc. 277,
eds. F.Favata & J.J.Drake (San Francisco: ASP) 397
Donati,J.-F., Collier Cameron,A., Hussain,G.A.J & Semel,M. 1999, MNRAS, 302, 437
Drake,J.J., Peres,G., Orlando,S., Laming,J.M. & Maggio,A. 2000, ApJ, 545, 1074
Hussain,G.A.J., van Ballegooijen,A.A., Jardine,M.M. & Collier Cameron,A. 2002, ApJ, 575, 1078
Kürster,M., Schmitt,J.H.M.M., Cutispoto,G. & Dennerl,J. 1997, A&A, 320, 831
Jardine,M., Collier Cameron,A., Donati,J.-F., Pointer,G.R. 2001, MNRAS, 324, 201
Maggio,A., Pallavicini,R., Reale,F., Tagliaferri,G. 2000, A&A, 356, 627
McIvor,T., Jardine,M.M., Collier Cameron,A., Wood,K., Donati,J.-F. 2003, MNRAS, 345, 601
Sanz-Forcada,J., Brickhouse,N.S., Dupree,A.K. 2003, ApJS, 145, 147
Schmitt,J.H.M.M. & Favata, F. 1999, Nature 401, 44
Schmitt,J.H.M.M., Ness, J.-U. & Franco, G. 2003, A&A
Semel,M. 1989, A&A, 225, 456