BeppoSAX observations of the quasar Markarian 205
We present the first BeppoSAX observation (0.1 to 220
keV) of the quasar Mrk~205. We have searched for the
unusual Fe line profile claimed in the XMM-Newton spectrum
which has been widely discussed in recent literature. We find no
evidence for a broad, ionized Fe line component in our data. We
detect for the first time a Compton hump in this object. Besides, when
this component is included in the fit, the line strength diminishes,
in agreement with a recent re-analysis of the
XMM-Newton data, but with better constraints on the reflection
component thanks to the PDS instrument (15-220 keV). We interpret this
fact as another indication for illumination of a distant and cold
material rather than reprocessing in the highly ionized inner parts of
an accretion disk.
We cannot constrain the presence of a high energy cutoff but we confirm the existence of a variable soft excess (one year timescale).
Key Words.:
Galaxies: active – quasars: individual: Mrk~205 – X-rays: galaxies1 Introduction
Discovered by Weedman (weedman (1970)), the quasar Mrk~205 is
seen through the southern spiral arm of the nearby spiral, barred galaxy
NGC~4319 at a projected distance of roughly 40″ from its
center. From its radio luminosity at 6 cm, Mrk~205 is classified
as a radio-quiet quasar (Rush et al. 1996a ), but it is still not
clear whether it belongs to the radio-quiet quasar class (e.g. Bahcall et
al. bahcall (1992)) or to the Seyfert 1 class (e.g. Veron-Cetty & Veron
veron (2001)). Mrk~205 has a redshift (Huchra et al.
huchra (1990)) while NGC~4319 has (Bowen et
al. bowen1 (1991)).
In the standard paradigm of (radio-quiet) Active Galactic Nuclei (AGN),
X-ray photons result from Compton upscattering of optical-UV photons in a
hot thermal corona above the accretion disk surrounding a supermassive
black hole. A large fraction of the seed photons are thought to be
produced by thermal emission of the accretion disk itself, but
Mrk~205 was found by McDowell et al. (mcdowell (1989)) to have a
weak blue bump. One of the possible scenarios which could explain this
spectral morphology is that the bump may be highly variable and thus
observed in a particularly weak state. In the thermal comptonisation
framework, blue bump variability would also induce hard X-ray
variations.
A soft X-ray excess component may be interpreted as the hard tail of
the blue bump (Walter & Fink walterfink (1993); Brunner et al.
brunner (1997)). So far, evidence for a soft excess in Mrk~205
was only reported in two observations;
with EINSTEIN IPC (Wilkes & Elvis
wilkeselvis (1987)) and XMM-Newton (Reeves et
al. reeves2 (2001)).
BeppoSAX, with its unique broad-band capabilities allows to extend
the observation of Mrk~205 for the first time above 20 keV to
study the properties of the hard X-ray emission as well as of a potential
reflection component. Indeed, some of the X-ray photons can be
reprocessed in the surroundings, in particular in the disk itself giving
rise to neutral (or low-ionization) Fe K line. While it is a
common feature of Seyfert 1 galaxies (Nandra & Pounds nandra (1994)),
only a few quasars present a clear detection of such a component
(Williams et al. williams (1992); Nandra et al. nandra2 (1997)).
Furthermore, the centroid of the line
was often measured at energies close to 6.7 keV suggesting that its
origin may be in an ionized layer of the accretion disk (Reeves & Turner
reeves1 (2000)), the neutral Fe K being emitted in distant and
cold material lying outside the broad line region. Reeves et al.
(reeves2 (2001)), who analysed the XMM-Newton data of
Mrk~205, claimed the existence of a broad ionized component in
addition to the neutral one in this object. However, Page et al.
(page (2003)) reprocessed the data including a reflection hump
component in the fit and found little evidence for a
broad, ionised component in the data.
In this paper, we present the analysis of three BeppoSAX
observations of Mrk~205 for a total of 200 ks of exposure time. In
Section 2, we summarize the knowledge we had on Mrk~205 prior to
our BeppoSAX observation. In Section 3, we describe the data and
their analysis while in Section 4 we compare our results and discuss them
in the framework of the unified model.
2 Previous X-ray observations of Mrk~205

| Mission, Reference | Date | Flux2-10keV | ||
|---|---|---|---|---|
| 1020 cm-2 | 10-11erg cm-2 s-1 | |||
| EINSTEIN (HRI), [a] | 22-11-1978 | 1.50f | 3.00 | 1.36 |
| EINSTEIN (IPC)†, [b] | 20-04-1980 | 1.80 | 2.00 | 1.18 |
| EXOSAT⋆, [c] | 10-11-1983 | 1.73 | 1.33 | 0.72 |
| EXOSAT⋆, [c] | 27-01-1984 | 1.94 | 2.84 | 0.66 |
| GINGA‡, [d] | 16-01-1988 | 1.95 | 3.40 | 1.01 |
| ROSAT (PSPC), [e] | 10-11-1991 | 2.38 | 3.24 | 0.16 |
| ROSAT (PSPC), [e] | 15-04-1992 | 2.32 | 3.32 | 0.11 |
| ASCA‡, [f] | 03-12-1994 | 2.13 | 2.50 | 0.75 |
| BeppoSAX, this work | 12-03-1997 | 1.77 | 2.90 | 1.21 |
| XMM-Newton†‡, [g] | 06-05-2000 | 1.86 | 4.30 | 0.47 |
| BeppoSAX†‡, this work | 21-12-2001 | 1.87 | 2.90 | 1.11 |
| BeppoSAX, this work | 05-01-2002 | 1.72 | 3.69 | 0.72 |
Note: Galactic cm-2 (Dickey & Lockman dickey (1990))
† evidence for a soft excess component reported
⋆ broken power law model preferred
‡ evidence for an Fe K line reported
f fixed parameter
Mrk~205 was observed by EINSTEIN HRI (Tananbaum et al.
tananbaum (1979): [a]; Zamorani et al. zamorani (1981)), EINSTEIN IPC (Wilkes & Elvis wilkeselvis (1987): [b]),
EINSTEIN A-2 (Della Ceca et al. dellaceca (1990)), EXOSAT
(Singh et al. singh (1991): [c]), GINGA
(Williams et al. williams (1992): [d]), ASCA (Reeves & Turner
reeves1 (2000): [f]), ROSAT PSPC (Fiore et al. fiore4 (1994):[e];
Fiore fiore0 (1994); Rush et al. 1996b ; Ciliegi & Maccacaro
ciliegi (1996); Fiore et al. fiore3 (1997)), ROSAT HRI
(Arp arp96 (1996)), XMM-Newton (Reeves et al. reeves2 (2001):
[g]; Page et al. page (2003)) and BeppoSAX (this work).
Mrk~205 was neither observed by RXTE nor Chandra to date.
We summarize the spectral parameters found in Fig. 1 and
Table 1. The spectral variability was important over the 24
years spanned by the data (Fig. 1, upper panel). The photon
indexes were measured mostly over the range keV and thus were not
affected by a soft excess component. However, the
two ROSAT points (1991, 1992) are extrapolated values from the
keV, i.e. a spectral range very sensitive to the presence
of a soft excess. They are certainly overestimated. In addition,
several papers
discuss the ROSAT PSPC calibration problems which results in a measure
of the AGN X-ray spectral slopes being significantly steeper than those from
other missions (Beckmann et al. beckmann (2002) and references therein).
We will discuss further in Section 4 the possible origin of the
observed spectral variability in this object.
Little variations of the Hydrogen column density were observed during the
same period (Fig. 1, second panel from the top). An excess of
absorption may be present in the XMM-Newton 2000 observation, its
reality will be discussed in Section 3.7.
The keV flux seems to have decreased during the first 18
years of observation, a trend possibly correlated with a similar trend
seen in the 1300 Å IUE light curve (Fig. 1, third
panel from the top). Here again, the two ROSAT estimates of
the keV flux may be underestimated due to the overestimation of
the keV photon index.
In the remainder of this section, we will focus on the XMM-Newton observation which took place one and a half year before
our BeppoSAX pointings.
2.1 XMM-Newton observation
Reeves et al. (reeves2 (2001)) reported an observation done with
XMM-Newton on 6 May 2000. They measured a photon index
with an absorbing column in excess of the
Galactic one limited to cm-2. Fitting
the MOS data only they found evidence for an ionized Fe line component at
6.7 keV along with the neutral Fe K component. The same result
was obtained using only the PN data, and thus the simultaneous fit of the
data from both instruments gave tight constraints. They finally obtained
the best fit with a narrow line resulting from neutral Fe K
emission at keV ( eV) and a broad component
at keV ( eV). They did not detect Fe
K edge, nor a reflection component but claimed that they could not rule
out its presence.
The observations were consistent with a relativistically-broadened
accretion disk line model (Fabian et al. fabian (1989)) only if the
disk ionization was high enough to produce
He-like Fe at 6.7 keV and the neutral component was
present.
A clear soft excess was also detected, but fitting it with a black body
gave a much too high temperature ( eV) to be direct emission
from the accretion disk. An explanation is enhanced emission from the
upper layers of the ionized accretion disk. The fact that the Compton
reflection from ionized material model (pexriv: Magdziarz &
Zdziarski magdz (1995)) gave good results (with erg cm
s-1) was probably confirming this
(see also Nayakshin et al. nayaketal (2000)). No warm absorber was
found; the limits on the OVII
and OVIII edges were and respectively.
Page et al. (page (2003)) reprocessed these data and found that an acceptable fit was obtained with a power law plus neutral emission line at 6.4 keV. They noticed that a better fit was obtained either with a Compton reflection component or with an ionized emission line, with a similar goodness of fit. The presence of ionized relativistic material was thus not unambiguously detected in this object, the illumination of a distant cold material providing a simpler self-consistent explanation.
3 BeppoSAX observation
Mrk~205 was observed by BeppoSAX (Boella et al.
1997a ) on 21 December 2001 (LECS: 47 582 s, MECS: 165 458 s,
PDS: 70 549 s) and on 5 January 2002 (LECS: 3 611 s, MECS: 32 603 s,
PDS: 12 606 s). In addition, public data from the archive (12 March
1997, LECS: 2 525 s, MECS: 14 727 s, PDS: 6 646 s; part of the core
program and pointed on NGC~4319) are
included in the present study.
LECS (Low Energy Concentrator Spectrometer, Parmar et al. parmar (1997))
and MECS (Medium Energy Concentrator Spectrometer, Boella et al.
1997b ) data were reduced following the standard procedures. For
PDS (Phoswich Detector System, Frontera et al. frontera (1997)) data,
high level products from the Sax Data Center were used. LECS and MECS
data have been screened according to Fiore et al. (fiore (1999)) to
produce equalized event files using an extraction radius of 8′
for LECS and 4′ for MECS. Data from the two MECS units have been
merged to increase the signal-to-noise ratio.
For the longest exposure (2001), the average source flux in the
keV band (MECS data only, power law model with Galactic absorption) was
erg cm-2 s-1 corresponding to a
luminosity erg s-1 in the keV band
rest frame (here and in the following km s-1 Mpc-1). From that
luminosity, a black hole mass of about
could be inferred. These values are more typical of
a luminous Seyfert 1 galaxy than a quasar.
The keV flux measured in 2001 was twice the value measured one
and a half year before by XMM-Newton (Fig. 1).
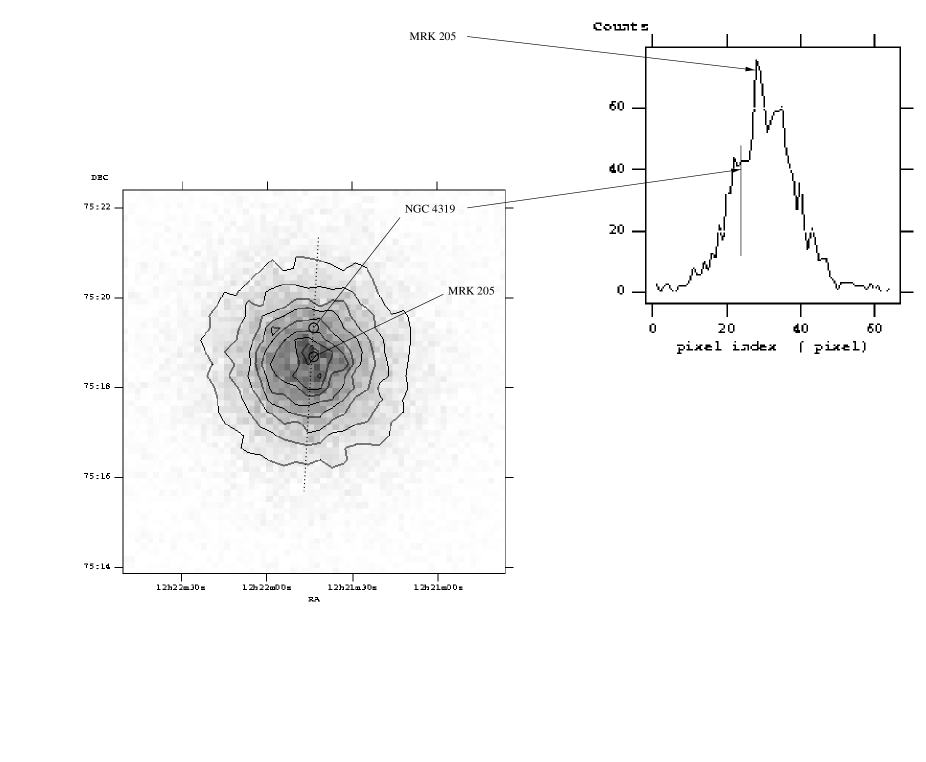
3.1 Image analysis: unprobable influence from NGC~4319 and other sources
We analysed the MECS keV image (angular
resolution 42″) of the 2001 observation and compared it with a ROSAT HRI keV image (angular resolution of 5″). For
the HRI image, Arp (arp96 (1996)) evaluated the shift of the position
from the optical to X-ray to be of at most 7″ , equivalent to one
MECS pixel. Three sources were identified in the MECS image,
Mrk~205 included. Being in the field of view of the PDS also
(1.4 degrees while the MECS field of view is 28′), we investigated if one of the
other two sources could contribute to the
Mrk~205 PDS spectra.
In addition, one had to make sure that NGC~4319 located at
40″ from Mrk~205 (and thus not resolved by this
instrument) was not emitting in the X-rays (we used the following J2000
coordinates for Mrk~205:
12h 21′ 44.12″ +75° 18′ 38.2″ and
for NGC~4319:
12h 21′ 44.07″ +75° 19′ 21.3″ ,
these are located by circles on Fig. 2). We discuss those
points below.
-
1.
According to the profile displayed in Fig. 2 (right panel), NGC~4319 is located in a zone in which half of the MECS peak count rate is received. Furthermore the shape itself does not allow to tell if NGC~4319 is really detected (the break in the profile can be a feature of the MECS PSF). It was not detected by ROSAT HRI (Arp arp96 (1996)) in the soft X-ray domain, but it could be Compton thick with emission only detected above 5-10 keV. However, there are no radio sources (apart from Mrk 205) above 2.5 mJy within a radius of 1.5′ of Mrk 205 in the NVSS catalog (Condon et al. condon (1998)). Thus it is very unlikely that NGC~4319 is an AGN;
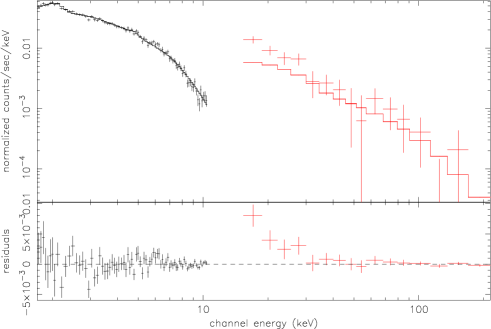
-
2.
We have fitted the 2001 MECS spectrum with a power law, extrapolated the model in the PDS domain and added the PDS data without fitting them but including an intercalibration constant MECS/PDS frozen to the recommended value of 0.88 (see Fiore et al. fiore (1999)). This is of course not taking into account any reflection component. Fig. 3 shows the resulting spectra along with the residuals of both data sets with respect to the MECS best fit model. It is very unlikely that emission from NGC~4319 contributes to the excess at 20 keV and matches the extrapolation of the MECS flux at high energies.
-
3.
The other sources in the MECS are XMMU~J122206.4+752613111the source XMMU~J122206.4+752613 corresponds to MS~1219.9+7542 and to ROSAT 1RXS~J122214.2+752624 which is a narrow emission line galaxy and NGC~4291, a non-active elliptical galaxy. The first has a MECS count rate 10 times smaller than Mrk~205 while for the latter it is 100 times smaller. According to Fiore et al. (fiore (1999)), those sources are certainly in the residual PDS count rate (estimated by comparing to the known MECS count rate) obtained in blank fields (Guainazzi & Matteuzzi guai (1997));
From these different arguments, we conclude that neither NGC~4319 nor one of the two other sources detected in MECS contribute significantly to the X-ray spectrum of Mrk~205.
3.2 Possible absorption in the spiral arms of NGC~4319
Of type Spec, NGC~4319 is an extremely disrupted
spiral galaxy (Arp arp96 (1996)) with an ISM very different from the
Milky Way’s ISM. The ISM of NGC~4319 has been thoroughly
studied by various authors which have found Ca II K
and Mg I b absorption features at the redshift of NGC~4319
(Stockton et al. stockton2 (1979)).
Bahcall et al. (bahcall (1992)) succeeded in the detection of
Mg II doublet in NGC~4319 and deduced an approximative H I
column density of about cm-2 from the Mg II
column density, precised by Womble et al. (womble (1993)) to be
N(H I) cm-2.
The gas in the inter-arm region of NGC~4319 shows a
higher grade of ionisation than in the Milky Way and the unusually
low amount of HI (or Mg II) is not understood for this kind of
late-type galaxy.
The X-ray absorption in the keV energy range is however
dominated by CNO K-shell absorption, but no evidence for an enhanced
abundance of heavy elements is reported in the literature.
To conclude, we do not find evidence for absorption in the
Mrk~205 data due to the presence of NGC~4319 in
the line of sight.
3.3 Variability


We produced light-curves from the event files using Xronos 5.16 in a
single binning of 2500 s to ease intercomparison between the different
observations (Fig. 4). Note that 15 days separate the middle
panel of Fig. 4 to the right panel. LECS and MECS light curves
of the statistically best observation (2001) were surprisingly different.
Cross-correlation analysis gave a weak correlation
coefficient between these two light curves.
From 1997 to 2001, the LECS and MECS count rates remained
constant. Since a MECS unit was lost between those 2 observations,
we have plotted in Fig. 4 the MECS light curves for a
single unit. The average PDS count rate seems to have increased by
about 40%, but this latter value is very inaccurate due to the few
points in 1997.
From 2001 to 2002, the LECS average count rate seemed to have dropped
by about 16% percent, but this latter value is based on a small
fraction of the observation time. The MECS average count rate dropped
by 15%, while the PDS count rate remained constant.
From the December 2001 observation (Fig. 4, middle panels;
see also Fig. 5) one
sees that no significant variability was observed on very short
timescales (of the order of hours). On the other hand, long term
variability (on week and year timescale) can be quite
important (Fig. 1).
In Fig. 5, we display the light curves keV and keV along with the hardness ratio, for the longest observation (2001). The keV energy band showed a weak minimum (10% below the average flux) around s which was not present in the keV range. The resulting hardness ratio thus showed an hardening around that time. The differences in the two light curves are certainly not due to variations as a value of the order of cm-2 is unlikely to change the spectra above 2 keV.
3.4 Model independent spectral analysis
To study the spectral variations between the different observations, we have divided the 3 spectra (LECS, MECS, PDS) of the 2001 observation from the 3 spectra of the 2002 observation (Fig. 6). We have also divided the 3 spectra of the 2001 observation from the 3 spectra of the 1997 observation (Fig. 7). We have taken the ratios for each energy bins. One sees an important variation in the keV energy range between the 2001 and 2002 observation which did not occur between the 1997 and 2001 observation, in agreement with Fig. 4. A rough comparison of Fig. 6 and Fig. 7 shows that the LECS and PDS points may have been enhanced as well in Fig. 6, but the signal-to-noise is not good enough to conclude that the soft keV or hard keV bands varied significantly.


3.5 Spectral analysis
| Observation | (dof), proba | ||
|---|---|---|---|
| cm-2 | |||
| 2001 | 1.87 | p | 182.23(139), 0.008 |
| 1997 | 1.77 | p | 106.88(99), 0.277 |
| 2002 | 1.72 | 3.69 | 104.70(99), 0.328 |
p pegged at Galactic value cm-2
The spectral fitting was performed with XSPEC 11.2.0. In the following,
all errors are quoted at the 90% confidence level for one interesting
parameter. We have used the recommended energy bounds (LECS:
keV, MECS: keV, PDS: keV), and the intercalibration
“constants” were free to vary in the intervals and
for LECS/MECS, PDS/MECS respectively
(Fiore et al. fiore (1999)).
The upper panel of Fig. 8 represents a fit of the 2001 data with
a power law model modified by interstellar photoelectric absorption.
The photoelectric absorption cross
sections used were those of Morrison and McCammon (morrison (1983)).
The lower panels of Fig. 8 show the fits residuals with the same
model for the 1997 and 2002 observations respectively. The best fit
spectral parameters found are presented in Table 2.
The fit of the 2001 observation is poor with an excess in the keV
range as well as in the soft X-rays, up to about 1 keV, finally a small
feature around 6 keV is present.
For the 1997 and 2002 observations, the fits are already acceptable
with this simple
model for the continuum. In the 2002 observation, a line-like feature is
clearly detected around 1 keV while a small excess in the range
keV may be present. The signal-to-noise ratio of the continuum
is not good enough to accurately constrain more complex physical
models.
3.6 Spectral analysis: reflection component
We started a more detailed analysis by fitting the 2001 observation
data above 2 keV, i.e. using MECS and PDS data only. As
was not constrained in this case, we fixed it to the Galactic value.
We tried 2 different models for the continuum shape.
The first was a cut-off power law plus a Compton reflection from dense,
neutral matter (pexrav: Magdziarz &
Zdziarski magdz (1995)). This model is meant to describe
the effects of Compton
scattering of photons from an X-ray source associated with the inner
parts of the accretion disk. The spectrum of reflected X-ray was computed
as a function of disk inclination using the transfer function of
Magdziarz & Zdziarski (magdz (1995)). The free parameters of this model
are the spectral index of the primary power law, the folding
(upper cutoff) energy of the primary X-ray spectrum and the
normalization of the reflection component . In our fits, the inclination
angle of the disk was frozen to 30 degrees as it is usually admitted for
Seyfert 1 galaxies, while the abundances of Fe and other heavy elements
were fixed to the solar values.
The second model was a more physical model of thermal Comptonisation for
a disk-corona configuration in a slab geometry (compha: Haardt
haar (1993); Haardt et al. haardt (1997)). The table model for
XSPEC222http://pitto.mib.infn.it/haardt/ATABLES includes both
the primary continuum and the reflection. The reflection component was
computed following White et al. (white (1988)) and Lightman & White
(lightman (1988)) assuming reflection on neutral matter and a constant
spectral shape (angle-averaged) for the reflected photons. The free
parameters of the model are the corona temperature normalized to the
electron mass ,
the corona optical depth and the normalization of the reflection
component (without the comptonisation effects). In our fits, the
temperature of the disk (which is assumed to radiate like a
single black-body) was frozen to 10 eV while the inclination angle of the
disk was frozen to 30 degrees.
Both continuum models were completed by the addition of a Gaussian
emission line to model the Fe K line with a width of 0.1 keV
frozen (a more detailed analysis on the Fe line parameters is made
below). The best fit spectral parameters are given in Table 3.
| Obs. | Model | (dof), prob. | |||||||
|---|---|---|---|---|---|---|---|---|---|
| keV | keV | eV | |||||||
| SAX 2001 | A+PL | 1.83 | - | - | - | - | - | - | 137.47(93), 0.002 |
| A+PEXRAV+G | 2.00 | 487.17 | 1.74 | - | - | 6.51 | 71.30 | 100.38(89), 0.192 | |
| A+COMPHA+G | - | - | 3.22 | 0.32 | 0.15 | 6.52 | 70.30 | 100.39(89), 0.192 | |
| SAX 1997 | A+PL | 1.74 | - | - | - | - | - | - | 48.36(53), 0.655 |
| A+PEXRAV+G | 1.77 | 240.00f | - | - | 6.40f | 1 | 48.16(51), 0.587 | ||
| A+COMPHA+G | - | - | 2.50f | 0.48 | 0.05 | 6.40f | 1 | 47.66(51), 0.607 | |
| SAX 2002 | A+PL | 1.69 | - | - | - | - | - | - | 49.91(53), 0.595 |
| A+PEXRAV+G | 1.80 | 228.30 | - | - | 6.40f | 34.90 | 46.89(50), 0.599 | ||
| A+COMPHA+G | - | - | 2.43 | 0.37 | 0.19 | 6.40f | 38.90 | 46.27(50), 0.624 | |
| XMM 2000 | A+PEXRAV+G | 1.73 | 500.00f | 0.48 | - | - | 6.40f | 75 | 75.24(54), 0.029 |
f parameters fixed in the fit
u unbounded parameters
The fit of the observation made in 2001 is improved by using
pexrav without cutoff
(=29.51 for 1 more parameters; F-test value 25.20 and
probability ). It is slightly improved
when including the cutoff (=1.97 for 1 more parameters;
F-test value 1.70 and probability 0.196)
and the line (=5.60 for 2 more parameters; F-test value
2.48 and probability ).
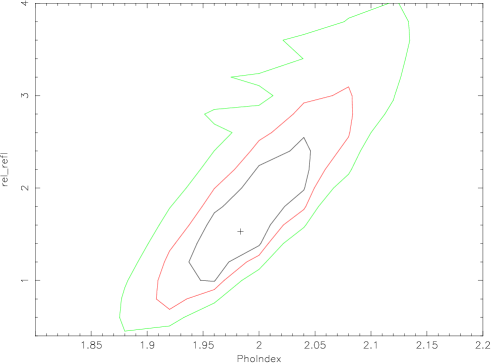
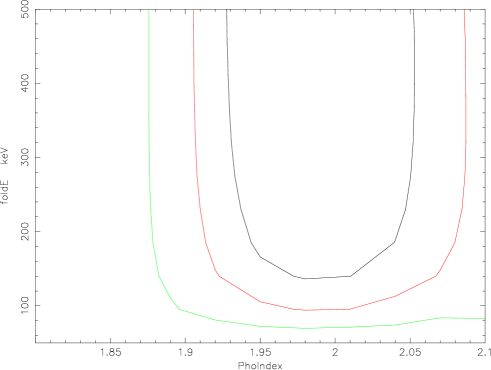
The solid angle subtended by the reflector is poorly
constrained (Fig. 9). Figure 10 shows that the cutoff
upper limit is not constrained.
The is not significantly improved by pexrav for the two other
observations (Table 3). We thus cannot constrain
the presence of this component in 1997 and 2002.
The fit of the December 2001 observation is improved by using
compha when compared to a power law
(=30.11 for 2 more parameters; F-test value 12.80 and
probability ). It is slightly improved
by including the Fe line (=7.17 for 2 more parameters;
F-test value 3.19 and probability ).
To summarize, fitting with the thermal comptonisation model compha does not improve the fit of
the 2001 observation in comparison to the Compton
reflection from cold material
pexrav fits.
3.7 Spectral analysis: soft excess
We now consider the broad band 2001 spectrum, adding the LECS 0.12-4.0 keV data to the MECS and PDS data. Freezing all the parameters of the best fit pexrav model above 2 keV and fitting again the broad band spectrum, we get an cm-2, and a of 138.49 for 142 degrees of freedom (dof). We found no clear evidence for a soft excess of photons in the LECS, even if the intercalibration constant is set to its lowest value of 0.7. To have an upper limit on a soft excess component, we add a black body to our model, fixing its temperature to the one obtained by Reeves et al. (reeves2 (2001)) with the XMM-Newton data, i.e. eV. We found an cm-2 and a for 1 more parameter; F-test value 1.78 and probability . The soft excess is here much weaker ( 3% of the emission over the range 0.5-2.0 keV) than it was claimed in the XMM-Newton observation ( 15% of the emission in the range 0.5-2.0 keV).
| Obs. | Model | (dof) | proba | ||
|---|---|---|---|---|---|
| 1020 cm-2 | eV | ||||
| BeppoSAX 2001 | A+PEXRAV+G+BB | 3.60 | 100.00 | 137.40(140) | 0.546 |
| XMM 2000 | A+PEXRAV+G+BB | 164.86 | 325.09(231) |
u unbounded parameters
p pegged at Galactic value cm-2
We re-analysed the XMM-Newton PN data to see whether the soft
excess component was as important as claimed by Reeves et al.
(reeves2 (2001)) when the reflection component was present. Indeed,
Reeves et al. (reeves2 (2001)) discussed the soft excess component
modeling the continuum with a power law while Page et al. (page (2003))
used the Compton reflection model but stopped their analysis at 3 keV. As
before, we deduced the parameters of the continuum fitting the data above
2 keV (Table 3). The pexrav model produced a
of 75.24 (54 dof) with a realistic reflection parameter
of 0.48. We then fixed the continuum and included the 0.5 to 2.0 keV
points. The residuals showed a clear excess below 2 keV. Adding a
black body with a temperature of 120 eV did not produce a good fit
( for 232 dof) but, when this parameter was released,
the fit was much better and the temperature significantly increased
(see Table 4 and Fig. 11). We did not find an
unusual value of (Fig. 1) anymore.
The contribution of the soft excess component is thus more important
than previously claimed: it represents 23% of the emission in
the range 0.5 to 2.0 keV.

However, the black body parameters do show suspicious values meaning that the emission is probably not a simple black body.
3.8 Spectral analysis: Fe K line
To assess the importance of an Fe K line in our data, we
concentrate on
the MECS data. In this case, is not constrained, we thus fixed it
to the Galactic value. Using only the power law model, it is
clear from the residuals in the lower panel of Fig. 8 that a line
feature is detected in the 2001 observation, while it does not seem to be
present in the 2002 observation (same figure). The
statistics of the 1997 observation is too poor to give conclusive results.
On the other hand, after fitting the continuum of the 2001 data with
the Compton
reflection model, the residuals do not show a clear evidence for a
line feature anymore.
We thus concentrate on the 2001 best fit observation and add a
Gaussian emission
line. The fit is improved ( for 1
more parameter; F-test 5.39 and probability )
with a line at 6.53 keV consistent with neutral
Fe K and weakly ionized
species. Note that the line is not resolved as eV is
smaller than the MECS energy resolution.
Both Compton reflection from cold material and thermal
comptonisation model give a line energy of 6.53 keV
but the latter gives a slightly larger equivalent width.
According to George & Fabian (geofab (1991)), if a reflection is
present, it has to be associated with an Fe line. In the neutral case,
they computed an equivalent width of the order of 1.7 keV with respect
to the reflection or 150 eV with respect to the continuum, for
(see also Zdziarski et al. zdziarski (2002)). Our measures
of the line equivalent width and are inconsistent with the
predictions of George & Fabian (geofab (1991)). We shall discuss in
Section 4 a possible reason to this deviation.
Unlike Reeves et al. (reeves2 (2001)) and Page et al.
(page (2003)), no residuals are found at 7 keV, but the line
equivalent width and centroid suggest that it could also be a blend of a
neutral narrow component and a weakly ionized one. Adding a second
Gaussian to the model while freezing the line energies to 6.4 keV and 6.7
keV rest frame following Reeves et al. (reeves2 (2001))
was not significant and neither was the relativistically-broadened
accretion disk line
model (Fabian et al. fabian (1989)) which was preferred by Reeves et
al. (reeves2 (2001)).
| Model | (dof) | prob | ||||
|---|---|---|---|---|---|---|
| keV | eV | eV | ||||
| A+PEXRAV | 1.99 | - | - | - | 92.81(78) | 0.121 |
| A+PEXRAV+G | 1.99f | 6.53 | 56.80 | 86.74(77) | 0.210 | |
| A+COMPHA | - | - | - | - | 95.53(79) | 0.099 |
| A+COMPHA+G | - | 6.53 | 71.90 | 86.25(77) | 0.220 |
f parameters fixed in the fit
For the 2002 observation, the residuals were not improved when using the Compton reflection model and thus were identical to Fig. 8.
3.9 Line feature at 1 keV
The spectrum of the 2002 observation contains a narrow emission line
feature centered at about 1 keV (see Fig. 8, lower right panel).
We have fitted a model composed of a power law plus Galactic absorption
and a Gaussian component (Fig. 12) and found the following
results. The line is centered at keV (quasar rest
frame) has a width of keV (not resolved; the
LECS energy resolution at 1 keV is 0.2 keV) and
an equivalent width
of 518 eV. The addition of the line significantly improves the fit at better
than the 98% confidence level according to the F-test. Note
however that even if this simple model allows us to estimate the line
centroid energy and total flux, it is physically unrealistic as it is
likely that this line results from a blend of several emission lines,
predominantly from ionized species of Ne and possibly from Fe L shell.
A similar feature was also found in the ASCA spectrum of the quasar
PG~1244+026 (Fiore et al. fiore5 (1998); George et al.
george (2000)) as well as in the ASCA spectrum of the Seyfert 1
galaxies TON~S180 (Turner et al. turner1 (1998)) and
Akn~564 (Turner et al. turner2 (1999)).
We searched the XMM-Newton data for this feature but did not find a
clear evidence for it (the equivalent width reached a maximum of 10 eV).

4 Discussion-Conclusion
The nature of Mrk~205.
It has been noted that, in contrast to the Seyfert 1 case, the
detection of Fe K line in quasars was more seldom and
that if detected, the line energy
was around 6.7 keV instead of 6.4 keV (Reeves & Turner reeves1 (2000)).
It was thus suggested that sensitive instruments like the EPIC camera on
XMM-Newton could observe the Fe K emission of quasar in
detail. From our X-ray observations of Mrk~205, and from the
luminosity we obtained from them, we suggest to be careful in classifying
this object. Its luminosity is found in the region in which it is difficult
to choose for a Seyfert 1 or for a quasar. It seems thus difficult to
generalize any findings
made on this object to a whole class.
The soft excess variability.
The soft excess seems to be variable in this source
although a very strong soft excess was never reported.
It seems to be absent/not detected in 1997, strong in 2000, weak
in 2001 and absent
again in 2002 (thus varied in a 2 weeks timescale). The variability of
the soft excess cannot be associated with variability of a cold absorber
as we have shown in Fig. 1 and Section 3 that the absorbing
column density deduced from spectral
modeling was roughly constant over all the observations.
Note that the soft excess component measured here should not be
associated with direct thermal emission from the accretion disk because
its temperature is much too high.
Thermal comptonisation. The historic variations of the photon index
can be explained in the framework of thermal comptonisation.
Mrk~205 showed large keV flux variations
between the 1997 (high flux state), 2000 (low flux state),
2001 (high flux state) and 2002 (low flux state) observations which do
not seem to be correlated with variability of the soft excess.
However, in thermal comptonisation processes, the index of the comptonised
component is inversely correlated with the ratio of the photon seed flux
to the comptonised power law flux. We can test this hypothesis if we
assume that the soft excess strength is proportional to the strength of
the soft photon field (Walter & Fink walterfink (1993); Walter &
Courvoisier walter1 (1990)).
The index for 2000 was for a ratio of 23% while for 2001
the index was for a ratio of 3%. This is thus in
disagreement with our expectations.
On the other hand, using the compha model to estimate the
UV flux, we found that an increase of the photon index goes with a
larger UV flux, in agreement with simple thermal comptonization
model expectation. Similar conclusions were found by Petrucci et
al. (pet00 (2000)) for the Seyfert 1 galaxy NGC~5548.
The contradiction between the soft X-ray and UV variations is not very
surprising. Indeed the soft excess component is certainly linked to
the UV bump through complex radiative transfer (e.g. comptonization
in the warm (few keV) upper layer of the accretion
disk). Consequently, its expected spectral behavior is not
straightforward and may be at odds from the zeroth order expectations.
Constraints on the reflecting material.
The nature of the reprocessing
medium can be the
accretion disk or some obscuring, distant material. If the Fe K
line is produced in the inner parts of the accretion disk, its profile
should be
considerably broader, with very distinct asymmetries due to Doppler and
gravitational redshift. This is not possible to test with the BeppoSAX data while Page et al. (page (2003)) report that they did not
find evidence for it in the XMM-Newton data either.
The strength of the Compton reflection is here
systematically higher than what was found in
Seyfert galaxies (, Nandra & Pounds
nandra (1994)), while on the contrary, the iron line equivalent width
EW is smaller than the mean EW value. It is worth noting however that
our measures of are consistent with at 90% confidence,
see Fig. 9.
The inconsistency between the best fit values of
and the line EW may then occur by chance and the reflecting material
in Mrk~205 may simply cover a solid angle as seen
from the X-ray source. The line energy then also suggests the material
to be neutral. A low Fe abundance will make the line weaker and the
Compton reflection hump stronger (as observed) by reducing the opacity
above the Fe K edge (George & Fabian geofab (1991)).
Given these constraints a simple solution could be that the
reprocessing is done in a distant material e.g. the dust torus.
However, we cannot rule out the presence of close mildly ionized
material. Indeed Nayakshin & Kallman (naykal (2001)) have shown
that in the case of relatively strong illumination by local X-ray
flares, the upper layer of the reflecting material may become strongly
ionized. In this case the reflection features are mainly produced by
the neutral depth layer and the expected line energy is 6.4 keV as we
observed. The line EW is however smaller than the one expected in the
case of neutral reflector since the line may be partly comptonized in
the hot skin. But clearly this skin cannot be highly ionized since in
this case it would act like a perfect mirror and the reflection hump
would be suppressed contrary to what we observe. Lines in the soft
band are also expected in the case of a mildly ionized medium and it
may explain the poor fit of the soft excess with a simple black body
component.
The 1 keV line. The spectrum of January 2002 contains a narrow
emission feature centered at an energy of 1 keV which was
also found in at least 3 other AGN. This feature could be explained
by a blend of several emission lines, predominantly from ionized species of
Ne and possibly from Fe L shell. The line emission could be a result
of reflection in photoionized matter. It could also be resulting
from recombination in
an optically thin thermal plasma.
Acknowledgements.
PF acknowledges a grant from the Swiss National Science Foundation. This research has made use of the NASA/IPAC Extragalactic Database (NED) which is operated by the Jet Propulsion Laboratory, California Institute of Technology, under contract with the NASA. This research has also made use of the SIMBAD database, operated at CDS, Strasbourg, France.References
- (1) Arp, H. 1996, A&A, 316, 57
- (2) Bahcall, J. N., Jannuzzi, B. T., Schneider, D. P., et al. 1992, ApJ, 398, 495
- (3) Beckmann, V., Wolter, A., Celotti, A., et al. 2002, A&A, 383, 410
- (4) Boella, G., Butler, R. C., Perola, G. C., et al. 1997a, A&AS, 122, 299
- (5) Boella, G., Chiappetti, L., Conti, G., et al. 1997b, A&AS, 122, 327
- (6) Bowen, D. V., Pettini, M., Penston, M. V., Blades, C. 1991, MNRAS, 248, 153
- (7) Brunner, H., Mueller, C., Friedrich, P., et al. 1997, A&A, 326, 885
- (8) Ciliegi, P. & Maccacaro, T. 1996, MNRAS, 282, 477
- (9) Condon, J. J., Cotton, W. D., Greisen, E. W. et al. 1998, AJ, 115, 1693
- (10) Della Ceca, R., Palumbo, G. G. C., Persic, M., et al. 1990, ApJS, 72, 471
- (11) Dickey, J. M. & Lockman, F. J. 1990, Annu. Rev. Astron. Astrophys., 28, 215
- (12) Fabian, A. C., Rees, M. J., Stella, L., White, N. E. 1989, MNRAS, 238, 729
- (13) Fiore, F. 1994, in AIP Conf. Proc. 313, The Soft X-ray Cosmos, eds. Schlegel and Petre, p. 95
- (14) Fiore, F., Elvis, M., McDowell, J. C. et al. 1994, ApJ, 431, 515
- (15) Fiore, F., Matt, G., Nicastro, F. 1997, MNRAS, 284, 731
- (16) Fiore, F., Matt, G., Cappi, M., et al. 1998, MNRAS, 298, 103
-
(17)
Fiore, F., Guainazzi, M., Grandi, P. 1999,
http://www.asdc.asi.it/bepposax/software/index.html - (18) Frontera, F., Costa, E., Dal Fiume, D. 1997, A&AS, 122, 357
- (19) George, I. M. & Fabian, A. C. 1991, MNRAS, 249, 352
- (20) George, I. M., Turner, T. J., Yaqoob, T., et al. 2000, ApJ, 531, 52
-
(21)
Guainazzi, M. & Matteuzzi, A. 1997, Technical report,
ftp://www.asdc.asi.it/pub/sax/doc/reports/sdc-tr014.ps.gz - (22) Haardt, F. 1993, ApJ, 413, 680
- (23) Haardt, F., Maraschi, L., Ghisellini, G. 1997, ApJ, 476, 620
- (24) Huchra, J. P., Geller, M. J., Henry, J. P., Postman, M. 1990, ApJ, 365, 66
- (25) Lightman, A. P. & White, T. R. 1988, ApJ, 335, 57
- (26) Magdziarz, P. & Zdziarski, A. A. 1995, MNRAS, 273, 837
- (27) McDowell, J. C., Elvis, M., Wilkes, B. J., et al. 1989, ApJ, 345, L13
- (28) Morrison, R. & McCammon, D. 1983, ApJ, 270, 119
- (29) Nandra, K. & Pounds, K. A. 1994, MNRAS, 268, 405
- (30) Nandra, K., George, I. M., Mushotzky, R. F., et al. 1997, ApJ, 488, L91
- (31) Nayakshin, S., Kazanas, D., Kallman, T. R. 2000, ApJ, 537, 833
- (32) Nayakshin, S. & Kallman, T. R. 2001, ApJ, 546, 406
- (33) Page, M. J., Davis, S. W., Salvi, N. J. 2003, MNRAS, 343, 1241
- (34) Parmar, A. N., Martin, D. D. E., Bavdaz, M., et al. 1997, A&AS, 122, 309
- (35) Petrucci, P. O., Haardt, F., Maraschi, L., et al. 2000, ApJ, 540, 131
- (36) Reeves, J. N. & Turner, M. J. L. 2000, MNRAS, 316, 234
- (37) Reeves, J. N., Turner, M. J. L., Pounds, K. A., et al. 2001, A&A, 365, L134
- (38) Rush, B., Malkan, M. A., Edelson, R. A. 1996a, ApJ, 473, 130
- (39) Rush, B., Malkan, M. A., Fink, H. H., Voges, W. 1996b, ApJ, 471, 190
- (40) Singh, K. P., Rao, A. R., Vahia, M. N. 1991, A&A, 248, 37
- (41) Stockton, A., Wyckoff, S., Wehinger, P. A. 1979, ApJ, 231, 673
- (42) Tananbaum, H., Avni, Y., Branduardi, G., et al. 1979, ApJ, 234, L9
- (43) Turner, T. J., George, I. M., Nandra, K. 1998, ApJ, 508, 648
- (44) Turner, T. J., George, I. M., Netzer, H., et al. 1999, ApJ, 526, 52
- (45) Véron-Cetty, M. P. & Véron, P. 2001, A&A, 374, 92
- (46) Walter, R. & Courvoisier, T. J.-L. 1990, A&A, 233, 40
- (47) Walter, R. & Fink, H. H. 1993, A&A, 274, 105
- (48) Weedman, D. W. 1970, ApJ, 161, L113
- (49) White, T. R., Lightman, A. P., Zdziarski, A. A. 1988, ApJ, 331, 939
- (50) Williams, O. R., Turner, M. J. L., Stewart, G. C., et al. 1992, ApJ, 389, 157
- (51) Wilkes, B. J. & Elvis, M. 1987, ApJ, 323, 243
- (52) Womble, D. S. 1993, PASP, 105, 1043
- (53) Zamorani, G., Henry, J. P., Maccacaro, T., et al. 1981, ApJ, 245, 357
- (54) Zdziarski, A. A., Leighly, K. M., Matsuoka, M., et al. 2002, ApJ, 573, 505