Ground-State Maser Emission Toward Evolved Stars
Abstract
We have made the first unambiguous detection of vibrational ground-state maser emission from 28SiO toward six evolved stars. Using the Very Large Array, we simultaneously observed the , 43.4-GHz, ground-state and the , 43.1-GHz, first excited-state transitions of 28SiO toward the oxygen-rich evolved stars IRC+10011, Ceti, W Hya, RX Boo, NML Cyg, and R Cas and the S-type star Cyg. We detected at least one SiO maser feature from six of the seven stars observed, with peak maser brightness temperatures ranging from 10000 K to 108800 K. In fact, four of the seven spectra show multiple maser peaks, a phenomenon which has not been previously observed. Ground-state thermal emission was detected for one of the stars, RX Boo, with a peak brightness temperature of 200 K. Comparing the and the transitions, we find that the ground-state masers are much weaker with spectral characteristics different from those of the first excited-state masers. For four of the seven stars the velocity dispersion is smaller for the emission than for the emission, for one star the dispersions are roughly equivalent, and for two stars (one of which is RX Boo) the velocity spread of the emission is larger. In most cases, the peak flux density in the emission spectrum does not coincide with the maser peak. Although the angular resolution of these VLA observations were insufficient to completely resolve the spatial structure of the SiO emission, the SiO spot maps produced from the interferometric image cubes suggest that the masers are more extended than their counterparts.
Accepted by the Astrophysical Journal 2004 February 20
1 INTRODUCTION
Although the study of SiO maser emission toward long-period variable stars is an active field of research, very little work has been done with regards to the vibrational ground-state () SiO emission toward these evolved objects. The question of the existence of observable ground-state SiO masers was first posed by Buhl et al. (1975). The ground-state lines of 28SiO and the much rarer 29SiO and 30SiO isotopic species have been observed in a number of single-dish surveys conducted primarily at 43 GHz () and 86 GHz (). In the two isotopic species, this ground-state emission has been shown to be relatively weak unsaturated maser emission (Alcolea & Bujarrabal, 1992). For 28SiO the nature of the emission is not as clear. Although Buhl et al. (1975) may have detected a weak maser line toward the star VY CMa, the general consensus on the 86.8 GHz line is that it is thermal circumstellar SiO emission with broad parabolic or flat-topped line profiles (see for example Bujarrabal, et al., 1986). The , 43.4-GHz line was similarly thought to be thermal in nature, however in surveys by Jewell et al. (1985) and Jewell et al. (1991) several of the line profiles showed narrow emission spikes ( km s-1) superposed, in some cases, on broader pedestals of emission. Jewell et al. suggested that these narrow spikes could be maser emission with linewidths comparable to or narrower than the thermal Doppler width. The data of Jewell et al. (1991) also suggested a correlation between the intensities of the and lines providing additional evidence for ground-state maser emission and the possibility that the gas producing the two types of emission is spatially coincident.
To date, very little interferometric imaging of the emission toward SiO maser emitting regions has been conducted. The more abundant 28SiO species was observed toward the Orion IRc2 star-forming region in the transition (Chandler & DePree, 1995) and the transition (Wright et al., 1995). In each case, the detected emission was found to have both maser and thermal components. Observations of the rarer 29SiO transition toward Orion (Baudry, Herpin & Lucas, 1998) also showed this blend of thermal and maser emission. A comparison of the 28SiO and 29SiO maser spots maps lead Baudry, Herpin & Lucas (1998) to conclude that the two isotopic species are not excited in the same gas layers.
Toward late-type stars, interferometric observations of the 28SiO emission have been conducted by Lucas et al. (1992) and by Sahai & Bieging (1993). No evidence of ground-state masers was found in either observation with the possible exception being an intense spike of emission toward the star R Cas Lucas et al. (1992). Prior to the work presented here, no interferometric studies of the 28SiO transition had been conducted. We therefore sought to detect and image the ground-state SiO maser emission toward 7 stars from the list of possible detections in Jewell et al. (1991).
2 OBSERVATIONS AND REDUCTION
Observations of the , 43.4-GHz and , 43.1-GHz transitions of 28SiO were performed using the Very Large Array (VLA) in C-configuration. The VLA is maintained and operated by the National Radio Astronomy Observatory (NRAO)111The National Radio Astronomy Observatory is a facility of the National Science Foundation operated under cooperative agreement by Associated Universities, Inc.. We observed the 7 stars and associated extragalactic phase calibrators over three epochs. The stars Ceti and IRC+10011 (WX Psc) were observed on August 4, 2001; the stars NML Cyg, R Cas, and Cyg were observed on August 8, 2001; and the stars RX Boo and W Hya were observed on August 10, 2001. Data were simultaneously in two bandpasses of bandwidth 6.25 MHz centered on line rest frequencies of 43122.808 MHz and 43423.858 MHz for the and transitions respectively. The VLA correlator in normal mode produced 64 channels per IF with a channel spacing of 97.656 kHz (0.68 km s-1).
Data were reduced using the standard routines within the Astronomical Image Processing System (AIPS). For the first epoch, the absolute flux density scale was established using 3C84 assuming a flux density for this source of Jy. For the second and third epochs, both 3C84 and 3C286 were used for the amplitude calibration. The 43-GHz flux density of 3C286 was assumed to be Jy. For each star observed, a nearby extragalactic calibrator was also observed in order to estimate the instrumental and atmospheric phase fluctuations. Phase corrections estimated from the calibration sources were applied to the target source data. To eliminate ringing in channels adjacent to strong maser features, the data were Hanning smoothed prior to imaging. This resulted in a degradation of the spectral resolution by a factor of 2 to (1.4 km s-1).
For each source, an iterative self-calibration and imaging procedure was performed to map a single strong reference spectral feature in the transition. The resulting phase solutions were applied to all channels in the the bands containing both the and transitions. From the calibrated data, total intensity image cubes, consisting of pixel images of the center 60 spectral channels, were produced for both the and SiO emission lines for each star. Naturally-weighted individual channel images were made with an approximately field of view. The synthesized beam sizes ranged from for the highest declination source, R Cas, to for the lowest declination source, W Hya. For the star RX Boo, the emission was resolved out on long baselines. We therefore reduced the resolution for RX Boo by a factor of two by limiting the range used in the imaging. This resulted in an image cube with a synthesized beam of
Positions for 5 of the 7 stars as determined from our VLA observations are reported in Table 1. Each position was determined from a two-dimensional (2-D) Gaussian fit to the peak in the image of the reference feature for the transition prior to self-calibration. The errors in the position are based on the size of the synthesized beam divided by twice the signal-to-noise ratio (SNR) in the image. These errors represent a small fraction of the beam and are probably not representative of the true error in the derived position of the star. There may be significant blending of multiple maser features in the peak channel (discussed below). In addition, SiO masers typically exhibit ring-like structures with shell sizes are on the order of tens of milliarcseconds. The position of one or more maser features at random locations on the ring is therefore not a good representation of the position of the stellar photocenter and may be off by more than half the diameter of the SiO maser shell. For the stars RX Boo and W Hya, the phase stability prior to self-calibration was insufficient to determine a reliable position from the image. Therefore, no position is reported for these stars.
Numerous Very Long Baseline Interferometry (VLBI) studies of circumstellar SiO masers have shown that a single spectral channel often contains multiple maser features; however, the angular resolution of our VLA data was not sufficient to resolve multiple features separated by distances less than typical maser shell diameters of 30–50 mas. In order to parameterize individual maser components, 2-D Gaussian functions were fit to the peak in each spectral channel of the image cubes using the AIPS task SAD. The analysis of the spectral image cubes, the results of the Gaussian fits to the and SiO emission and the astrophysical interpretation are discussed below.
3 RESULTS
3.1 Ground-State Maser Emission
As mentioned in the previous section, we fit 2-D Gaussians to the emission peak in each spectral channel yielding component flux density, spatial position, and velocity information. Since the primary goal of these observations was to determine whether ground-state SiO maser emission is exhibited in the atmospheres of late-type stars, we concentrate here on the ground-state, , transition. In order to determine whether the observed SiO emission has a maser component to it, we converted the fitted component flux densities to equivalent brightness temperatures using:
| (1) |
where, for the right-hand estimate, is the flux density in Jy and is the geometric mean of the fitted source size in arcseconds. Figures 1–7 plot the flux densities and equivalent brightness temperatures for all 7 stars observed. In these figures, the solid line represents the fitted component flux densities in Janskys (Jy), and the points represent the equivalent component brightness temperatures. For unresolved maser spots, we assumed source sizes of 0.5 times the beam. The points are scaled by the logarithm of the flux density, and are color coded according to velocity bin. The flux density, deconvolved source size, and brightness temperature for the strongest spectral feature toward each source are tabulated in Table 2.
The kinetic temperature of the gas in the circumstellar envelope, ,can be estimated from
| (2) |
where is the stellar photospheric temperature, is the stellar radius and R is the radial distance in the circumstellar envelope (CSE) (Langer & Watson, 1984; Herpin & Baudry, 2000). Assuming an estimate of K, the kinetic temperature in the region of the SiO masers is 1500 K. We used this kinetic temperature to compare to the brightness temperatures of the SiO ground-state emission, as a nominal test to determine whether the emission observed in the transition is indeed masing. This temperature is rather conservative given the expectation that the masers should occur at a larger radial distance than the SiO masers (discussed later). From Table 2 we see that for 6 of the 7 stars observed, the peak brightness temperature is much higher than the nominal 1500 K kinetic temperature. We take this comparison to clearly indicate that some of the SiO emission is indeed maser emission. The only star that was observed that does not show maser emission from ground-state SiO in is RX Boo. In addition, the deconvolved angular sizes for the peaks in the six stars with suspected maser emission (see Table 2) were well below the corresponding beam size. This is also suggestive of compact maser emission. The only source with a deconvolved source size greater than the synthesized beam was again RX Boo.
Examination of Figures 1–7 shows that 4 of the 6 ground-state maser sources show multiple brightness temperature peaks well above the nominal kinetic temperature. The two exceptions are Ceti and Cyg. It is highly probably that these additional features are also ground-state masers. Such multiple masing features contradict previously reported detections which showed single narrow emission peaks in the spectra. The six maser stars appear to show a range in the degree of masing from Cyg and Ceti which exhibit single maser peaks to sources like NML Cyg and IRC+10011 in which nearly the entire spectrum is above the brightness temperature threshold for masing. The spectra for the latter two stars are similar to the spectrum for Orion IRc2, which Chandler & DePree (1995) found to be dominated by SiO maser emission. For Cyg, it appears that the single maser feature sits on a broader pedestal of thermal SiO emission. This is reminiscent of some of the spectra observed by Jewell et al. (1991) and the spectrum for R Cas observed by Lucas et al. (1992).
3.2 Comparison of the and SiO Emission
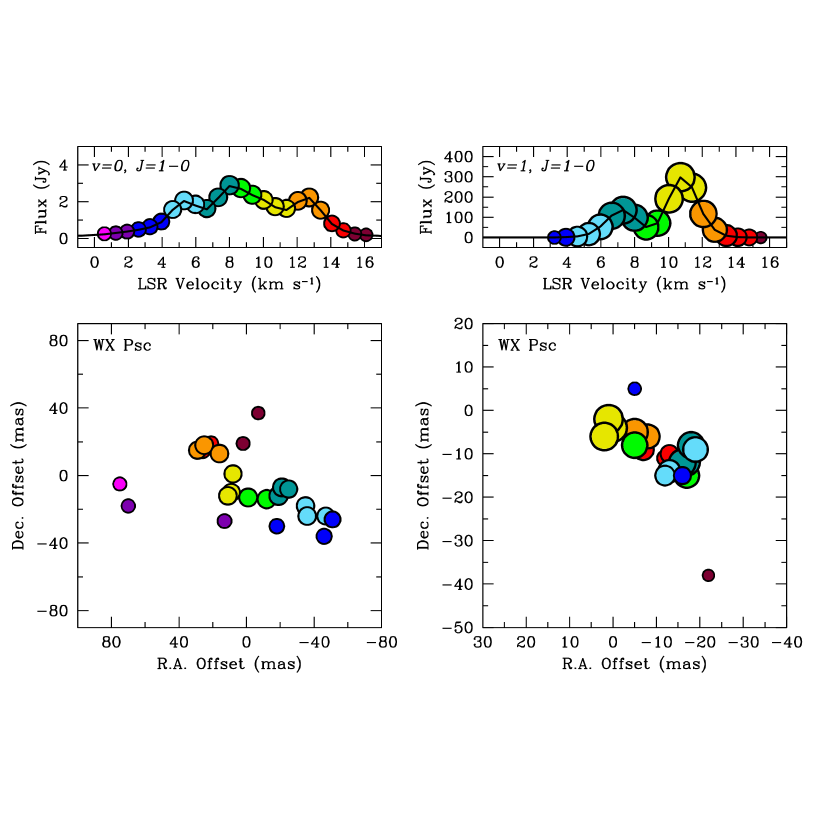
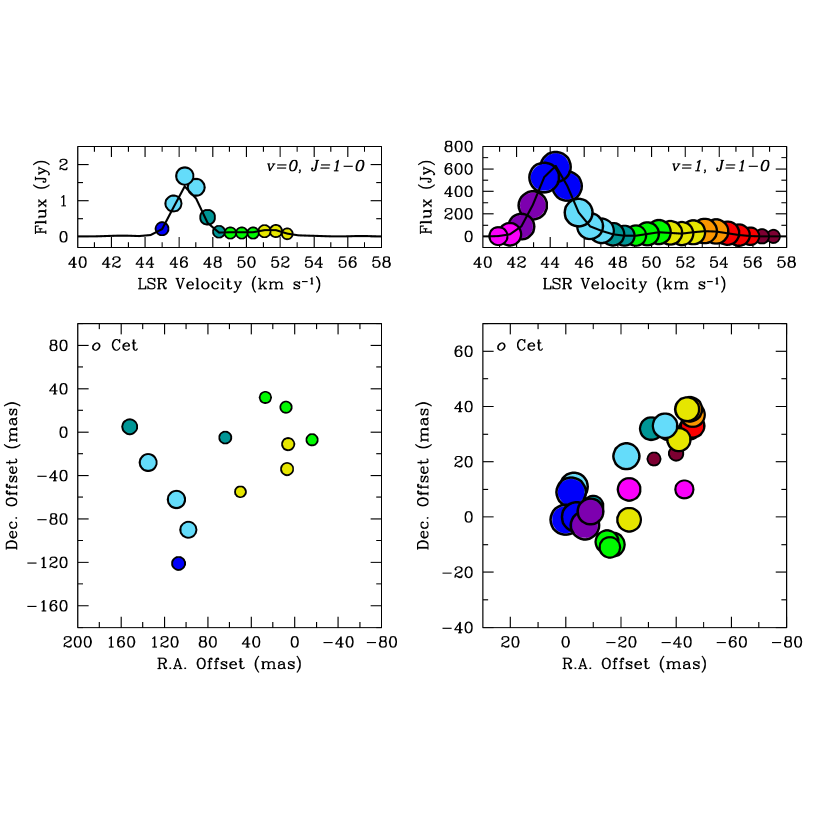
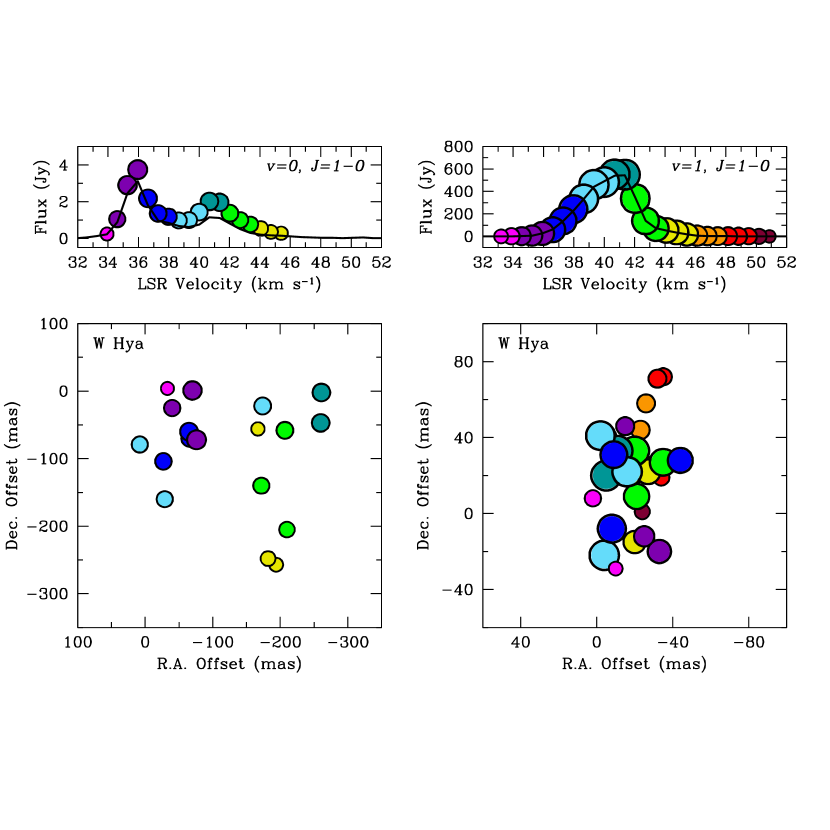
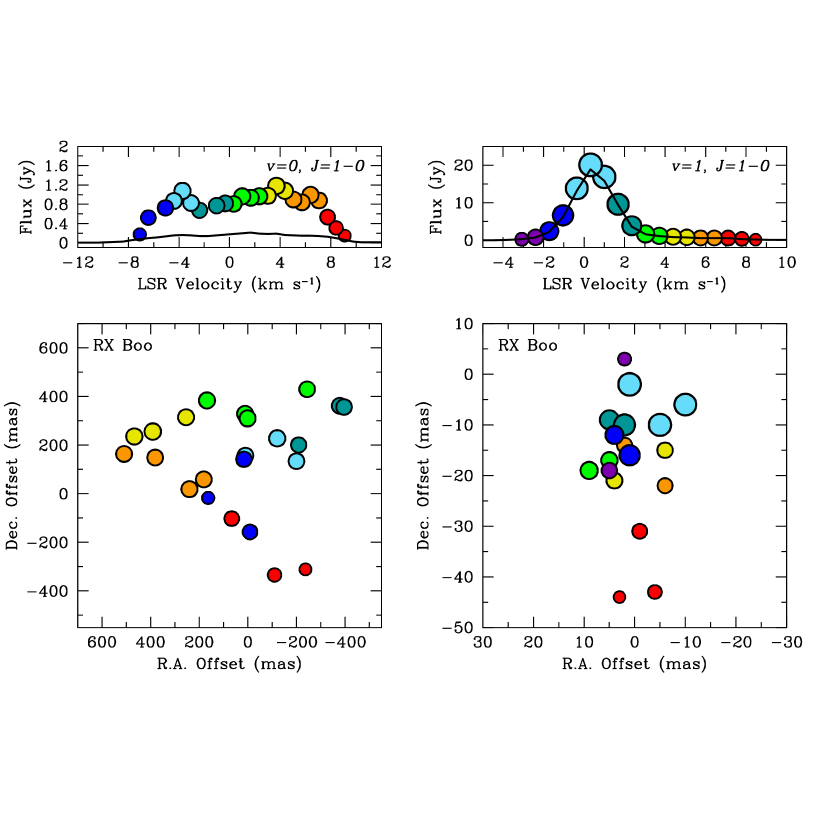
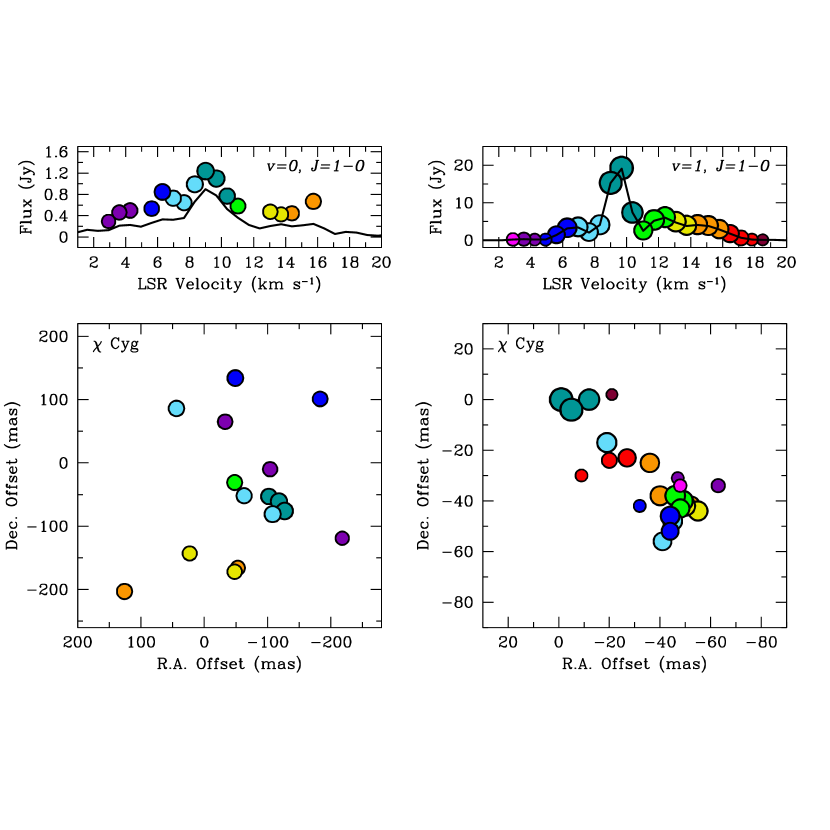
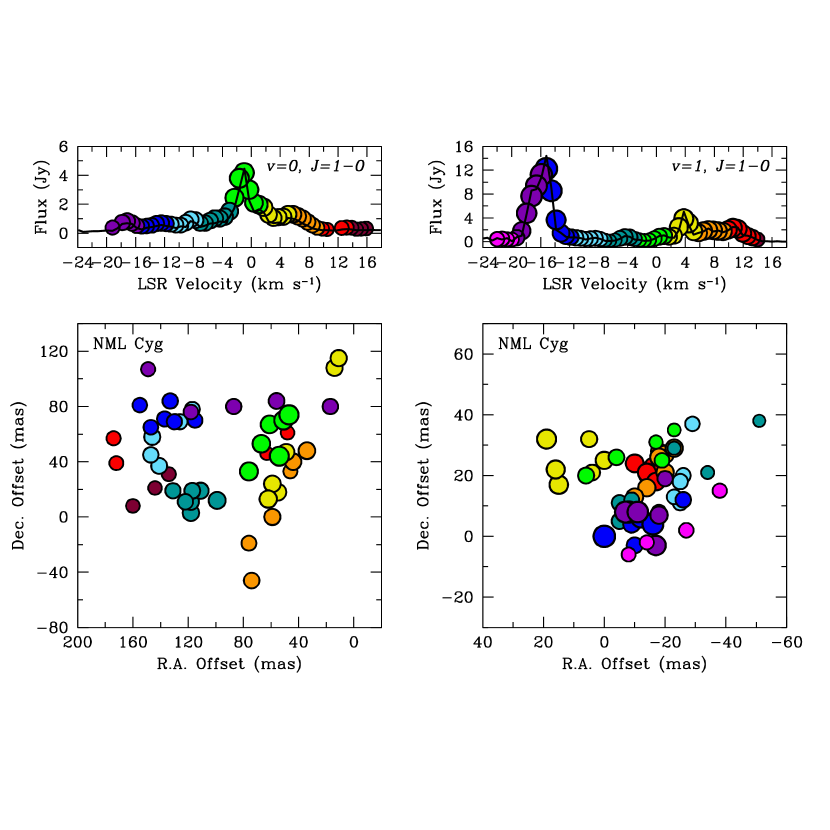
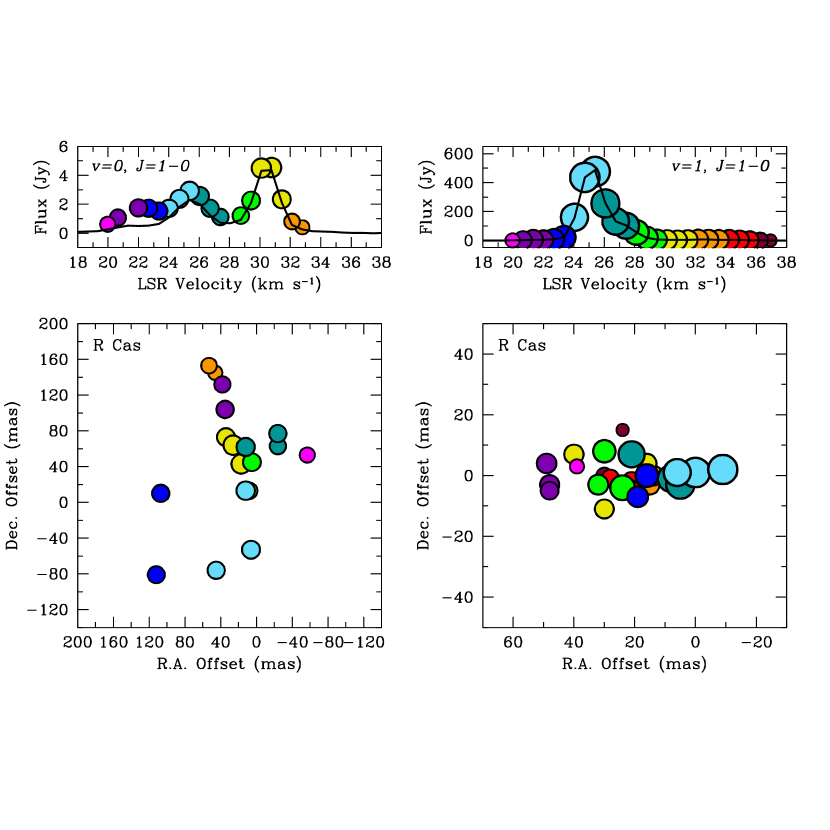
Having established that there is at least some degree of masing in the ground-state SiO emission toward 6 of the 7 stars observed, we sought to compare the emission with that observed for the more common , first excited-state maser transition. To facilitate this comparison, we plotted the results of the 2-D Gaussian fits in Figures 8–14. In each figure, the two left panels show the spectrum (upper panel) and spatial distribution (lower panel) of the SiO emission. Similarly, the two right panels show the spectrum and spatial distribution of the SiO emission. Components derived from the 2-D fits are represented by color-coded circles with sizes scaled by the logarithm of the flux density and colors corresponding to particular velocity bins. The total velocity range and velocity binning is the same for each transition for each star. The flux density scale in the upper panels and the right ascension and declination offsets in the lower panels are adjusted to provide the best plot filling factor in each transition. Also plotted in the upper panels of each figure, are solid lines which represent the vector-averaged, cross-power, spectrum averaged over all VLA antennas for comparison.
Comparing the upper panels in Figures 8–14 we notice that the spectra for the two SiO transitions toward each star are quite different. Aside from the obvious flux density differences, the spectra vary in number of peaks, center velocities of the peaks, and total velocity dispersion in the transition. In Table 3 we list some of the relevant spectral parameters derived from the fits to the image data. Both the figures and the table show that for majority of the stars, Cyg being the one exception, the peak flux densities in the two transitions do not coincide in velocity to within 1 km s-1. Additionally, the velocity dispersions ( in Table 3) between the two transitions vary for each star. In 4 of the 7 stars is larger for the transition than for the line. Two of the stars, IRC+10011 and RX Boo, have larger dispersions in the transition, although RX Boo is not masing in this transition, and one star, NML Cyg, has velocity dispersions which are roughly equivalent.
Plotted in the lower panels of Figures 8–14 are the spatial distributions of the SiO emission in each transition for each star. As mentioned in Section 2, the VLA in C-configuration is insufficient to resolve multiple maser components within a spectral channel, thus we fit a single 2-D Gaussian to the emission peak within each channel. For the maser emission, the position errors reported by the AIPS task SAD for these fits range from 15 mas to less than 1 mas. For the weaker maser emission, position errors ranged from 70 mas to 1 mas. For the thermal emission toward RX Boo, errors ranged from 100 mas to 30 mas. These reported errors are based on the size of the beam divided by twice the signal-to-noise ratio (SNR) in the channel image and are considered more realistic than the formal errors of the Gaussian fit. Nevertheless, the reported errors are still a very small fraction (0.1–0.002) of the synthesized beam and some may question their reliability. Because of this and the fact that there is probably some component blending occurring in the images, the spatial distributions mapped in Figures 8–14 are discussed only in a qualitative sense. A true quantitative comparison of the spatial distributions of the two masing transitions will have to wait for higher-resolution interferometric observations.
With this in mind, we note that for all of the stars observed, the spatial extent of the SiO emission is several times larger than that of the corresponding maser emission. In addition, we find that the masers form compact distributions ranging from 30–90 mas consistent with typical SiO maser shell sizes as measured by VLBI. Especially enticing are the maps for NML Cyg (see Figure 13) in which we find that the maser distribution agrees with previous VLBI results from Boboltz & Marvel (2000). Additionally, the ground-state masers appear to be resolved into a definite ring-like structure with a radius of about 50 mas. Using the Berkeley Infrared Spatial Interferometer (ISI), Danchi et al. (2001) determined the radius of the inner dust shell of NML Cyg to be 80–100 mas. This would place the masers in a region roughly half the radial distance between the masers and the inner circumstellar dust shell for NML Cyg. Assuming a stellar size of approximately 9 mas (Boboltz & Marvel, 2000), the kinetic temperature of the SiO in the region is 750 K based on Equation 2.
4 DISCUSSION
Ground-state, 28SiO maser emission is rarely addressed in the literature in which numerical models for the generation of SiO masers are presented. This may be due to the fact that to date there has been very little evidence for the existence of masers in this transition. In an early paper, Kwan & Scoville (1974) commented that population inversions in the states are possible under certain conditions. They stated that the percentage of the inversion is small due to the fact that the collision rate among the levels is comparable to the rate of radiative depopulation. In one model consisting of strictly radiative excitation,Kwan & Scoville (1974) found an inversion of the line which occurs at a distance of cm (9–69 ) with an emission rate down by a factor of 100 from the line.
More recent investigations addressing the excitation of the SiO masers through overlaps with optical (Rausch et al., 1996) and infrared (Herpin & Baudry, 2000) lines, demonstrated possible mechanisms for the generation of , 28SiO masers. In the case of optical pumping, Rausch et al. (1996) found the ground-state emission to be thermal for the and transitions of 28SiO, but that maser emission was generated for the state in their simulations. The infrared pumping mechanism of Herpin & Baudry (2000) was used to resolve some of the previously unexplained detections of certain SiO maser transitions and to predict some possible new SiO masers. In addition, their numerical model also demonstrated that 28SiO could be generated. In both the optical and infrared pumping cases, the masers are generated in regions of the CSE where the SiO abundances are lower than for the typical excited-state masers. Since the SiO abundance decreases with distance from the star as SiO condenses onto dust grains, then the masers are naturally formed at distances beyond that of the vibrationally excited masers in these models.
Our qualitative comparison of the spatial distributions supports the idea that the SiO masers occur at distances greater than maser shell. In this case the maser distribution is several times the diameter of the corresponding masers. This contradicts the speculation by Jewell et al. (1991) that the correlation between the intensities of the and lines suggests that emission from the two transitions is spatially coincident. Baudry, Herpin & Lucas (1998), in their interferometric observations of the 29SiO and the 28SiO masers toward Orion IRc2, determined that the ground-state and excited-state masers were not co-spatial. They state that this is a consequence of all collisional/radiative pumping models which predict that various vibrational state masers should peak in different spatial regions of the CSE.
5 SUMMARY
Interferometric observations using the VLA have allowed us to definitively detect ground-state 28SiO masers toward six long-period variable stars, IRS+10011 (WX Psc), Ceti, W Hya, NML Cyg, R Cas, and Cyg. Thermal emission was detected for the only other the star in our sample, RX Boo. Peak brightness temperatures for the ground-state masers ranged from 10000 K to 108800 K at the time of our observations. Of the six ground-state maser stars, four exhibited multiple maser peaks, a phenomenon not previously observed.
Comparing the transition with the simultaneously observed maser emission, we find that the ground-state masers are weaker with spectra different than the corresponding first excited-state masers. In general the peak in the spectrum for a given star occurs at a different velocity from that of the maser peak. Additionally, the dispersions in velocity are not the same.
We were able to make low-resolution image cubes of both transitions for each star from our VLA C-configuration data. From these images we created spot maps of the emission. Although the resolution of our observations was insufficient to provide a quantitative comparison of the spatial morphologies of the two transitions, we can say that the ground-state SiO masers appear to be distributed over a larger region of the CSE than their counterparts. Future higher-resolution observations should enable us to clearly resolve the spatial distribution of ground-state masers toward these long-period variables. The precise placement of these masers in the circumstellar envelope relative to the masers and to the circumstellar dust shell has important implications for circumstellar chemistry and maser pumping mechanisms.
References
- Alcolea & Bujarrabal (1992) Alcolea, J. & Bujarrabal, V. 1992, A&A, 253, 475
- Baudry, Herpin & Lucas (1998) Baudry, A., Herpin, F. & Lucas, R. 1998, A&A, 335, 654
- Boboltz & Marvel (2000) Boboltz, D. A. & Marvel, K. B. 2000, ApJ, 545, L149
- Buhl et al. (1975) Buhl, D., Snyder, L. E., Lovas, F. J. & Johnson, D. R. 1975, ApJ, 201, L29
- Bujarrabal, et al. (1986) Bujarrabal, V., Planesas, P., Gómez-González, J., Martín-Pintado, J. & del Romero, A. 1986, A&A, 162, 157
- Carilli & Holdaway (1997) Carilli, C. L. & Holdaway, M. A. 1997, VLA Scientific Memo, 173, 1
- Chandler & DePree (1995) Chandler, C. J. & DePree, C. G. 1995, ApJ, 455, L67
- Cho, Kaifu & Ukita (1996) Cho, S., Kaifu, N., & Ukita, N. 1996, AJ, 111, 1987
- Danchi et al. (2001) Danchi, W. C., Green, W. H., Hale, D. D. S., McElroy, K., Monnier, J. D., Tuthill, P. G. & Townes, C. H. 2001, 555, 405
- Herpin & Baudry (2000) Herpin, F. & Baudry, A. 2000, A&A, 359, 1117
- Jewell et al. (1985) Jewell, P. R., Walmsley, C. M., Wilson, T. L. & Snyder, L. E. 1985, ApJ, 298, L55
- Jewell et al. (1991) Jewell, P. R., Snyder, L. E., Walmsley, C. M., Wilson, T. L. & Gensheimer, P. D. 1991, A&A, 242, 211
- Kwan & Scoville (1974) Kwan, J. & Scoville, N. 1974, ApJ, 194, L27
- Langer & Watson (1984) Langer, S. H. & Watson, W. D. 1984, ApJ, 284, 751
- Lucas et al. (1992) Lucas, R., Bujarrabal, V., Guilloteau, S., Bachiller, R., Baudry, A., Cernicharo, J., Delannoy, J., Forveille, T., Guélin, M. & Radford, S. J. E. 1992, A&A, 262, 491
- Rausch et al. (1996) Rausch, E., Kegel, W.H., Tsuji, T. & Piehler, G. 1996, A&A, 315, 533
- Sahai & Bieging (1993) Sahai, R. & Bieging, J. H. 1993, AJ, 105, 595
- Wright et al. (1995) Wright, M. C. H., Plambeck, R. L., Mundy, L. G. & Looney, L. W. 1995, ApJ, 455, L185
| (J2000) | (J2000) | ||
|---|---|---|---|
| Source | (km s-1) | (h m s) | (∘ ′ ′′) |
| IRC+10011 | 10.7 | 01 06 25.9886 0.00004 (0.0006′′) | 12 35 53.0373 0.0006 |
| Ceti | 44.3 | 02 19 20.7909 0.00003 (0.0004′′) | 02 58 39.8577 0.0005 |
| W Hya | 40.7 | ||
| RX Boo | 0.3 | ||
| Cyg | 9.7 | 19 50 33.9177 0.00022 (0.0028′′) | 32 54 50.5987 0.0021 |
| NML Cyg | 15.2 | 20 46 25.5430 0.00007 (0.0008′′) | 40 06 59.4177 0.0010 |
| R Cas | 25.4 | 23 58 24.8805 0.00015 (0.0014′′) | 51 23 19.7645 0.0014 |
| Peak Flux | Angular | Brightness | ||
|---|---|---|---|---|
| Density | Velocity | Size | Temp. | |
| Source | (Jy) | (km s-1) | (′′) | (K) |
| IRC+10011 | 2.90 0.02 | 8.0 | 0.16 | 108800 |
| Ceti | 1.68 0.02 | 46.4 | 0.26 | 23400 |
| W Hya | 3.74 0.05 | 36.0 | 0.42 | 19900 |
| RX Boo | 1.81 0.05 | 3.7 | 2.34 | 200 |
| Cyg | 1.24 0.02 | 9.0 | 0.34 | 10000 |
| NML Cyg | 4.18 0.03 | 1.0 | 0.19 | 105900 |
| R Cas | 4.54 0.04 | 30.8 | 0.20 | 107600 |
| Peak Flux | Peak Flux | |||||
|---|---|---|---|---|---|---|
| Density | Density | |||||
| Source | (km s-1) | (km s-1) | (Jy) | (km s-1) | (km s-1) | (Jy) |
| IRC+10011 | 15.5 | 8.0 | 2.90 0.02 | 12.2 | 10.7 | 298.0 0.6 |
| Ceti | 7.4 | 46.4 | 1.68 0.02 | 16.3 | 44.3 | 617.6 0.9 |
| W Hya | 11.5 | 36.0 | 3.74 0.05 | 17.7 | 40.7 | 551.1 4.4 |
| RX Boo | 16.2 | 3.7 | 1.18 0.05 | 11.5 | 0.3 | 20.1 0.2 |
| Cyg | 12.8 | 9.0 | 1.24 0.02 | 15.6 | 9.7 | 19.25 0.05 |
| NML Cyg | 35.1 | 1.0 | 4.18 0.03 | 36.0 | 15.2 | 12.25 0.04 |
| R Cas | 12.8 | 30.8 | 4.54 0.04 | 17.0 | 25.4 | 475.9 1.9 |