The EUV Emission in the Coma Cluster of Galaxies and the Underlying Source of this Radiation
Abstract
Observations with the Extreme Ultraviolet Explorer (EUVE) have shown the Coma Cluster to
be a source of EUV emission in excess of that
produced
by X-ray gas in the cluster. We have re-examined the
EUVE
data on this cluster in an attempt to obtain clues as
to the origin of this emission. We find two important
new results. First, the ratio between the azimuthally
averaged EUV excess emission and the ROSAT hard X-ray flux is
constant as a function of distance from the cluster center outward.
Second, a correlation analysis
between
the EUV excess emission and the X-ray emission shows that
on a detailed level
the
EUV excess is spatially closely related to the
X-ray
emission. These findings contradict
previous
suggestions as to the underlying source of the
diffuse
EUV emission in Coma and provide important information in regards to the
true source of this emission. We propose a new explanation for the source of this
emission: inverse Compton scattering of microwave background photons by
secondary electrons and positrons.
We explore this possibility in some detail
and show that
it is consistent with all of the available observational evidence.
The parent cosmic ray protons may
have been produced by any of a number of sources, including supernovae, active
galaxies, galactic winds, and
cluster formation shocks, but we believe that the most likely source is
cluster formation shocks.
If the EUV emission
in the Coma Cluster is, in fact, the result of secondary electrons, this may be
the
only direct
evidence for secondary electrons in the intracluster medium of a
cluster of galaxies, since recent work suggests that secondary
electrons may not be the cause of radio halos.
1 Introduction
Observations with the Extreme Ultraviolet Explorer (EUVE) provided evidence that a number of clusters of galaxies emit excess EUV emission in the cores of the clusters. The first clusters reported to have EUV excesses were the Virgo cluster (Lieu et al. 1996a; Bowyer et al. 1996) and the Coma Cluster (Lieu et al. 1996b). Thereafter EUV emission was reported for Abell 1795 (Mittaz, Lieu & Lockman, 1998) and Abell 2199 (Lieu et al. 1999a). These early works employed a variety of data analysis schemes that were later found to be incorrect (Bowyer, Berghöfer, & Korpela, 1999), primarily because incorrect methods were used to account for the sensitivity profile, or exposure map, of the telescope. The only clusters that have been determined to have an EUV excess using uncontested data analysis procedures are the Virgo cluster (Berghöfer et al. 2000) and the Coma Cluster (Bowyer et al. 1999).
Subsequent to the analysis of Bowyer et al. (1999) additional EUV data on the Coma Cluster were obtained with EUVE. In this paper we re-examine the excess EUV emission in the Coma Cluster using all the EUVE data available on this cluster. We obtain important new information on the character of the EUV emission in this cluster. Given these new results, we provide strong evidence that the EUV emission is produced by secondary electrons and positrons in the intracluster medium (ICM). This finding may well be the only secure evidence of the presence of secondary electrons and positrons in an intracluster medium.
2 Data and Data Analysis
All of the data employed were obtained with the Deep Survey (DS) telescope of EUVE (Bowyer & Malina 1991). In Table 1 we provide an observing log of the observations. The total observing time was 390 ks.
| Date | Duration (ks) |
|---|---|
| 12/25/95-12/28/95 | 50 |
| 06/11/96-06/12/96 | 39 |
| 01/12/99-01/14/99 | 53 |
| 02/04/99-02/07/99 | 76 |
| 03/15/99-03/21/99 | 172 |
Various authors have used a number of data reduction procedures in searches for EUV emission from clusters. Because of the misconceptions created by the use of incorrect analysis procedures, we describe the data reduction approach used here in some detail. These procedures were developed and documented in Bowyer et al. 1999. The validity of this approach was examined and tested by Berghöfer, Bowyer, & Korpela 2000 and its appropriateness verified.
First, the Coma data sets were screened to exclude noisy data. The pulse height distribution of each set was then examined and low energy counts produced by random noise were excluded by rejecting counts below a low energy threshold. Since a low energy threshold is applied to the data by the onboard satellite data processing system, this step was not crucial. Indeed, Berghöfer et al. 2000 have shown that changing the low energy threshold by as much as a factor of two has no effect on the end result. Nonetheless, this approach can improve the quality of the data set in at least some cases. Cosmic rays interacting with the spacecraft and the detector produce a few high energy counts in the data which we removed by upper level thresholding. These counts are only a small fraction of the total data set and ignoring this step does not significantly affect the end result. Nonetheless, these counts were easy to remove and we did so. Corrections were then made to account for telemetry limitations and detector dead time effects on the total observing time; these were .
The next step in our analysis is quite important. A background was obtained from regions of the detector that do not view photons from the sky. This background arises from energetic charged particles interacting with the satellite; these produce charged particles within the instrument that trigger counts in the detector. This background varies over time scales of weeks to months and depends upon geophysical conditions. Berghöfer et al. 2000 have shown that this background differs by only a factor of two over the course of the EUVE mission, but given the low counting rates from clusters of galaxies it is important that this background level be identified in order to establish the zero level for each particular observation. Accordingly, we established this background independently for each of the data sets we employed.
Most importantly, the correct telescope sensitivity profile, or exposure map, was used in connection with the analysis of the data. We note similar corrections for the instrument sensitivity over the field of view are routinely applied in the reduction of most observations of diffuse X-ray emission. For example, observations of diffuse sources with the ROSAT PSPC are routinely corrected using an effective area exposure map (Snowden et al. 1994). Bowyer et al. 1999 have provided a map of the EUVE DS sensitivity profile using 363 ks of data from a variety of blank fields. The use of a sensitivity profile composed of a large number of individual blank field data sets could, in principle, be questioned. Indeed, Lieu et al. 1999a claimed the EUVE DS sensitivity profile varies with time, but no analysis validating this claim was provided. Berghöfer et al. 2000 carried out a detailed investigation of this possibility. They compared the 363 ks data set referred to above with an assemblage of 425 ks of data from a different set of blank fields obtained at different times. The two data sets were correlated at the 97% level, consistent with the statistical uncertainties in the counts in the individual cells in the two data sets. This demonstrated the stability of the EUVE DS telescope’s sensitivity profile over time scales of years. In our work on the Coma Cluster we used a sensitivity profile composed of 788 ks of data obtained by combining the two blank field data sets described above.
Because of the different orientations of each of the different Coma observations, it was necessary to carry out the above steps on each of the individual data sets separately. The results of each observation were then summed. This required a knowledge of the absolute pointing of the spacecraft. Because there are no obvious point sources that are present in all of the EUV images, it is non-trivial to confirm the pointing coordinates provided by the satellite. A comparison of the location of the maximum of the cluster emission in the images shows the relative pointing error in the nominal spacecraft pointing to be . Since this uncertainty is the estimated point spread function of the telescope, we simply added the images using the nominal spacecraft pointing. We note, however, that any conclusions based on the EUVE data will be uncertain at this, or smaller, scales.
Next, the effects of absorption by the Galactic interstellar medium (ISM) on the EUV flux were determined. There are a number of programs available to determine the effects of the ISM on the X-ray flux from Galactic and extragalactic sources and any of these will provide a result that is essentially valid in the X-ray regime. However in the EUV, the situation is entirely different. In this band absorption is due only to hydrogen, neutral helium, and singly ionized helium. Metals can be ignored because they produce insignificant absorption in comparison to these species, and the reduction of He I and He II due to the presence of He III can be ignored because there is virtually no He III in the ISM (Heiles et al. 1996). The appropriate EUV cross sections must be used for H I, He I, and He II, and equally importantly, correct columns are needed for each of these components. In particular, the amount of H II in the line of sight must be established in order to determine the true He I and He II columns. A full discussion of these issues and a comparison of the differing outcomes with the use of different compilations of cross-sections are provided in Bowyer et al. 1999. In this case we used a hydrogen column of cm-2 (Dickey & Lockman 1990) with ionization fractions and cross sections for Galactic ISM absorption as described in detail in Bowyer et al. 1999. We note that Bregman et al. 2003 have shown that small scale variations in the Galactic ISM can be as large as factor of 3 in some 1 degree fields containing clusters of galaxies and this can affect the magnitude of the EUV excess in these cases. However, this is not a factor in regard to the Coma Cluster where there is near spatial uniformity of the Galactic Hi column as manifested in the NRAO map of this region with a spatial resolution of 21′, and the finer scale IRAS 100 m map.
We then derived the EUV emission produced by the high temperature X-ray emitting gas using Coma ROSAT PSPC archival data. We used a temperature of 9 keV (Briel et al. 1992). We note that a variety of temperatures, typically varying from 8 to 9 keV have been reported for the thermal gas in Coma by various authors. This variation has only a small effect on the ratio of the X-ray to EUV flux. This ratio for an 8 keV plasma is within 10% of that for a 9 keV plasma. We used a factor of 128 to convert counts in the 0.5-2.4 keV band of the ROSAT PSPC to the EUVE DS-band counts. The PSPC conversion factor was derived from the MEKAL plasma code with abundances of 0.3 solar and a temperature of 9 keV. We corrected for the Galactic ISM as described above.
The next task was to align the X-ray and EUV images. A source well away from the cluster center was detected at the same sky location in both the EUVE DS image and the ROSAT soft X-ray image. In both of these images the source was the point- spread functions of the respective detectors. A UV source, A 2305, is located within the central portion of the point-spread functions in both the EUVE and the ROSAT images. A QSO would typically produce a UV, EUV, and soft X-ray signature of this character. With this source as a fiducial, the images were aligned to . We note that any comparisons between the EUV and X-ray data are uncertain at, or less than, scales of 0′.43. We then subtracted the EUV emission due to the X-ray gas from the total EUV emission detected by EUVE.


The identification of diffuse emission in a sky map is difficult because of the low signal to noise ratio of data in individual cells of the map. This problem was identified early in the study of diffuse X-ray emission in clusters of galaxies. A solution univerally employed in studies of diffuse emission in clusters is to construct the azimuthally averaged radial intensity profile of the flux. We derived this profile for the EUV emission in the Coma Cluster. The results are shown in Fig. 1. There is a substantial EUV excess out to and marginal evidence for emission to . The dominant uncertainty in the determination of the overall excess is uncertainty in the determination of the ratio between the EUVE and ROSAT count rates due to the X-ray plasma. Including this uncertainty, the overall EUV excess is significant at greater than the 12 level.
In order to obtain a value for the total EUV excess in physical rather than instrumental units, we summed the excess counts shown in Figure 1 and computed the unabsorbed count rate by correcting for Galactic interstellar absorption as described above. We then divided by the EUV instrument effective area to obtain results in physical units. The unabsorbed EUV excess in the band from 68 to 92 Å (the approximate bandpass of the observation as defined by the telescope high energy cutoff and the low energy cutoff produced by Galactic absorption) is . Assuming a distance of 100 Mpc, this corresponds to a total energy output between 68 and 92 Å of . In this calculation we assumed spectral indices between 1 and 1.6 which are appropriate given the source mechanism identified for the emission as discussed below. This result is relatively insensitive to the spectral index, with a variation in the flux of only a few percent for the index range listed. It is of interest to compare this energy output with the energy output of the X-ray plasma which is about ergs/s, based upon a central density of , a core radius of 10′.5, a of 0.75, a temperature of 9 keV, and the cooling function of Sutherland and Dopita 1993. If the EUV excess were due to a thermal plasma at 106 K, the bolometric luminosity of this plasma would be erg/s, which is comparable to the energy output of the X-ray plasma.
The value we obtain for the EUV excess, , is about a factor of two smaller than the number reported by Sarazin and Lieu 1998 after correcting for a difference in the assumed distance to the Coma Cluster. Although it is impossible to conclusively identify the reason for this difference, we note that if we were to inappropriately compute the energy output using the full bandpass of this instrument rather than the effective bandpass, we would obtain a value similar to that reported by Sarazin and Lieu.
3 The Relationship between the EUV Excess and the X-ray Emission

We first derived the ratio between the azimuthally averaged EUV flux (0.13 - 0.18 keV) and the azimuthally averaged X-ray flux derived from the ROSAT 0.5-2.4 keV X-ray band. We show this ratio as a function of increasing distance from the cluster center in Figure 2. As can be seen this ratio is essentially flat. The error bars increase at larger radii because of the limited EUV excess flux at these larger radii.
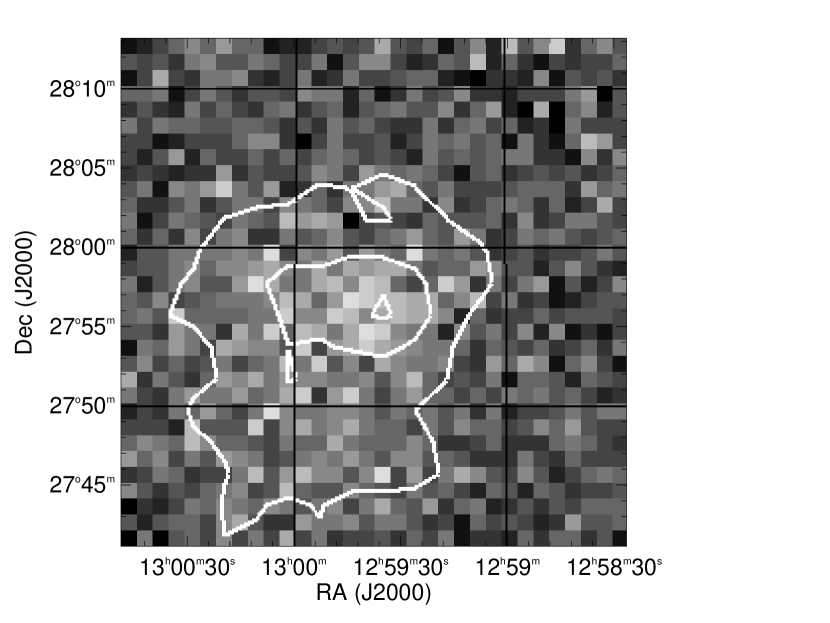
An azimuthally averaged radial intensity profile is quite sensitive to the presence of diffuse emission. However, by its very nature this process eliminates any possibility of examining details of the spatial distribution of the emission other than its average radial distribution. A direct study of the details of the EUV emission in this bandpass can only be achieved with a very substantial data set, which is now unobtainable. As an alternative, we considered ways to investigate aspects of the spatial distribution which might prove to be useful. We first considered the number of EUV excess counts in individual cells in the sky map. The telemetered cell size of EUVE data is . We summed these data into larger blocks. The minimum appropriate cell size is because the registration of the EUV images are uncertain at this level. In addition, the use of a cell size smaller than the intrinsic resolution of the telescope could potentially provide misleading results. The response of the telescope is closely replicated by a Gaussian with a 90% included energy width of 1′ and one possibility would be to convolve the data with a Gaussian of this size. However, we summed the counts in a 1 min square box since Hardcastle 2000 has pointed out that the use of a smoothing function adds considerable uncertainty to the significance levels of the resultant data set. We then computed isophotes of the EUV excess. The results are shown in Figure 3. The EUV excess appears to be more extended to the southeast although this is a region of low counts per bin.

In Figure 4 we show the X-ray emission in the Coma Cluster derived from archival ROSAT PSPC data. A comparison of Figure 4 with Figure 3 shows that the EUV emission is only detectable in the central portion of the X-ray image. This may be because the EUV emission is only present in the core, but it could simply be a sensitivity issue, and the lower intensity wings extend further out. We then carried out a standard linear correlation analysis between the EUV excess dataset shown in Figure 3 and the corresponding X-ray data shown in Figure 4.
An immediate problem in carrying out a correlation analysis between the EUVE excess and the X-ray emission is that a correlation analysis will compare the number of counts in a given cell in one image with the number of counts in an identical cell in the other image without accounting for any statistical fluctuations in these values. Hence with an image with a small number of counts in individual cells, a false statement of a lack of correlation will be provided simply because of the statistical fluctuations of the data in the cells.
To assess this effect for the EUV excess, we carried out a correlation between two independent data sets of the EUV excess in the Coma Cluster as we summed the counts in individual cells into larger sized bins. The results are shown in Fig. 5 as diamonds. As expected, the correlation between the two independent data sets of the EUV excess is quite poor with smaller bin sizes, but increases rapidly as the bin sizes are increased and more counts are registered in each bin.
We note that the determination of the confidence levels of the correlation measures shown in Fig. 5 are inherently complicated by three statistical properties of correlation estimates: (a) they are inherently non-Gaussian, being mathematically bounded to the interval -1 to +1; (b) they are asymmetrical; (c) their confidence intervals depend on the true population correlation value, which is unknown. This situation prompted Fisher 1935 to create a nonlinear transformation of the correlation statistic into a Gaussian normal variate with uniform variance, namely Fisher’s transformation which depends only on the observed correlation value and the number of independent data points , both of which are known. In use, one simply converts the observed into Fisher’s (which is Gaussian) and then converts the desired confidence interval in back into an interval for . Using this method we obtain the error bars shown in Figure 5. We confirmed these error values by performing multiple Monte Carlo simulations of uncorrelated data. The standard deviation of the correlation coefficients of these uncorrelated simulations in Fisher -space was equivalent to the error values calculated using the number of independent points.
We expected that there were sufficient counts in the deep ROSAT X-ray image that uncertainties in the photon statistics in the X-ray data would be inconsequential in comparison with the uncertainties due to the limited data in the EUVE data set. A self-correlation of the X-ray data verified this conclusion.

We then carried out a correlation of the EUV excess image with the X-ray image as a function of increasing cell size. The results are shown in Figure 5 as triangles. Up to a scale of 4.0 arcmin2 the EUV self correlation and the EUV/ X-ray correlation both rise reflecting the limited quantity of EUV data. At larger scales the EUV self correlation is better than the EUV/X-ray correlation allowing us to make several definitive statements. First, there is a substantial, but not exact, spatial similarity between the EUV and the X-ray emission. This similarity peaks at scales of arcmin2 at a value of 0.86. There is an indication that the correlation falls off at larger scales, though this decrease is not significant at the three sigma level. We can also conclude that at scale sizes smaller than arcmin2 the correlation is no better than 0.80 since a correlation cannot be improved by simply reducing larger image pixels to smaller pixels.
In summary, we can state that at scales greater than arcmin2 the spatial distributions of the EUV and the X-ray emission have substantial, but not exact, similarities. The correlation peaks at a value of 0.86 at a scale size of arcmin2 with a suggestion that the correlation decreases at a larger scale. At scales less than arcmin2 the correlation is no better than 0.80.
4 Discussion
In view of these new findings, it is useful to reconsider suggestions for the underlying source mechanism for the EUV excess in clusters of galaxies. One proposal was that this emission was thermal emission from a “warm” (106 K) gas (Lieu et al. 1996a; 1996b; 1999a,b; Mittaz et al. 1998; Bonamente et al. 2001). Buote 2000a,b carried out extensive analyses of ROSAT PSPC data and also claimed to have found evidence for gas at this temperature in the core of several clusters.
The EUV emission in the Coma Cluster is almost spherical and could conceivably be the product of a gravitationally bound gas. However, the maintenance of a warm intracluster gas is quite difficult to understand since gas at this temperature is at the peak of its cooling curve and would typically cool in less than 0.5 Gyr (Landini & Monsignori Fossi 1990). This has resulted in a fair level of skepticism in regard to a thermal origin for the EUV excess. A variety of observational studies have been carried out in an attempt to discover evidence for a warm K thermal gas. Initial studies with XMM-Newton showed no lines from a K gas in any of the clusters examined (Peterson et al. 2001). However the Coma Cluster was not examined in these studies, which raised at least the possibility that Coma is uniquely different and that the EUV excess in this cluster is indeed thermal in origin. Dixon et al. 2001 obtained long Far Ultraviolet Spectroscopic Explorer (FUSE) observations centered on the Coma cluster in search of Ovi 1032, 1038 emission which would be produced by a 106K thermal gas. Although this emission was detected, the high resolution of FUSE showed that all of this emission was Galactic and that none was red-shifted Ovi from material in the cluster. However, the presence of thermal gas could not be completely ruled out since a large depletion of oxygen in the cluster would render these lines unobservable.
Additional information on this topic has been obtained by Arnaud et al. 2001 and by Vikhlinin et al. 2001. Both of these groups studied the core of the Coma cluster in detail. Arnaud et al. analyzed XMM-Newton data and determined temperatures in 3.5 regions in the core of the cluster. The temperatures in these regions ranged from 7 to 8.5 keV (with a few outliers) with no evidence for lower temperature gas. Vikhlinin et al. used Chandra observations to search for lower temperature gas in very small regions in the core of the cluster. They found 1 to 2 keV gas within a 7 radius of NGC 4874 and NGC 4889 which they attributed to emission from the halos of these individual galaxies. However, immediately outside of these small regions they found only high temperature (9 keV) gas.
Finoguenov et al. 2003 used XMM-Newton data in diameter bins and detected Ovii and Oviii emission off-center from the core of the cluster. These lines would be produced by a 0.2 keV (or K) gas. They showed that this emission came from a filament in front of the Coma Cluster which was seen in projection against the cluster. The key difference between these measurements and the measurements of Vikhlinin et al. and Arnaud et al. was the fields of view involved. Only with the larger field of view is the line emission from the low temperature gas detected. Finoguenov et al. found that the oxygen line emission was 1/30th of the X-ray emission of the 9 keV gas in the cluster center. Even if Finoguenov et al. were incorrect in their interpretation that this emission was from a filament in front of the cluster and was, instead, associated with K gas in the core of the cluster, its EUV emission would have been so faint as to be unobservable with EUVE and could not have been responsible for the excess reported here.
Kaastra, Lieu et al. 2003 claimed to have found “warm” thermal emission within the central 12 of the Coma Cluster with XMM-Newton. However, their claim is based on the (marginal) detection of a diffuse soft X-ray excess in the cluster and not on the detection of oxygen lines and it is contradicted by the work of Arnaud et al. 2001 and Vihklinin et al. 2001. The Kaastra, Lieu et al. 2003 results could equally well be interpreted as non-thermal emission.
Since the EUV flux is not thermal in origin, we have examined non-thermal processes as the source of this emission. Inverse Compton (IC) scattering of the 2.7 K cosmic microwave background (CMB) photons by energetic electrons (Hwang 1997; Bowyer & Berghöfer 1998; Enßlin & Biermann 1998; Sarazin & Lieu 1998) was suggested early on, and it is still the only suitable candidate non-thermal mechanism (Blasi & Colafrancesco 1999; Atoyan & Völk 2000; Brunetti et al. 2001a; Petrosian 2001; Tsay et al. 2002).
Enßlin, Lieu & Biermann 1999 suggested cluster starlight radiation as the background photon field. The energy density in starlight photons is about two orders of magnitude less than that in the CMB in the core of Coma, so the starlight-IC model requires a number density of MeV electrons which is comparable to the thermal electron density (Enßlin et al. 1999). These particles then provide the dominant pressure in the cluster. This condition seems implausible both to establish and to maintain. If such low energy electrons were mixed with the thermal plasma, they would transfer their energy on timescales of a few hundred million years by way of Coulomb collisions which would result in excessive heating, even ignoring heating by likely associated non-thermal protons. Magnetic fields strong enough to separate these non-thermal particles from the thermal plasma would lead to magnetic pressures exceeding the thermal gas pressure, which is similarly unlikely. If the posited 5 MeV electrons were relics of a much more energetic population, their original energy content would have been much greater than that already required for the starlight-IC model itself, making these problems worse. Thus, we reject this hypothesis as an untenable explanation for the EUV excess in Coma.
A number of authors have suggested specific IC-CMB models for the production of the EUV excess. Atoyan & Völk 2000 posited a population of “relic” electrons driven into the intracluster medium by galactic winds during intervals of galactic starbursts and then reaccelerated by strong merger shocks. To avoid excessive radio emissions from the assumed hard energy spectrum of the EUV electrons () with multi-Gauss magnetic fields, their model included an ad hoc electron energy cutoff near 250 MeV. Brunetti et al. 2001b proposed a model for EUV IC-CMB emissions based on turbulent reacceleration of non-thermal electrons recently injected by the head-tail radio galaxy NGC 4869, which is several arcminutes west of the cluster center. This was an extension of a model that would explain the radio emission and the 40 KeV X-ray emission in the Coma Cluster (Brunetti et al. 2001a). Important constraints imposed were that this population should not produce (an unobserved) -ray emission, and it should produce the observed spectral steepening of the radio emission with increasing distance from the cluster core. This model included an initial cosmic ray population produced 2Gyr ago, reacceleration 1Gyr ago by shocks from mergers, and a recent injection of low energy cosmic rays that is responsible for the EUV emission. Their model assumed a relatively hard electron spectrum for the EUV electrons (hereafter, EUVe) with , and a magnetic field Gauss, and required a cutoff near 500 MeV to avoid emissions conflicting with observations in other bands. The relative complexity of the full model illustrates the difficulty in finding a unified model for non-thermal emissions in Coma.
Sarazin & Lieu 1998 proposed a model for EUV emission in clusters in which relic low energy electrons accumulated from various origins would be distributed similarly to the thermal plasma, that is . That distribution predicted an azimuthally averaged ratio, , increasing substantially with distance outside the cluster core. Berghöfer et al. 2000 derived this ratio for the Virgo cluster as a test of this model. They found that the ratio was flat with increasing distance from the center of the cluster in contradiction to the prediction of this model. We have derived this ratio for the Coma Cluster, and, as shown in Figure 2, it is essentially constant. Using a beta model for Coma (Briel et al. 1992) with , , and assuming one finds that should have increased by about a factor of two from the cluster center to a distance of 10′.5 and by a factor of six at 21′. All of these outcomes are clearly inconsistent with the data.
Three previous studies considered secondary emission in connection with the EUV excess. Blasi & Colafrancesco 1999 considered secondary emission as part of a unified model for non-thermal emissions in Coma. They found their model had multiple problems. The spatial distribution of the radio emission was not correct, and too much gamma radiation was produced. Finally, the EUV emission produced was too low. Blasi 2001 modeled emission from secondaries as part of a treatment of nonthermal emission in cluster mergers, including Coma. He assumed that a strong merger shock would inject primary electrons and protons with a density distribution proportional to the thermal plasma. With the parameters he employed, the associated EUV emission would be dominated by primary electrons, so the resultant EUV spatial distribution would take the same form as that proposed by Sarazin and Lieu (1998), and would be incompatible with the observational results reported here. Miniati et al. 2001b estimated the EUV flux from secondary emission in clusters as part of a larger study of cluster formation. Their EUV luminosity vs cluster temperature relations underestimated the observed EUV flux in Coma by about an order of magnitude. Consequently, Miniati et al. did not pursue the idea that IC-CMB emission from secondary electrons could be the underlying source mechanism for the EUV excess. In retrospect, their luminosity estimates were artificially low because of the effects of finite numerical resolution in their simulations. This significantly reduced the central gas densities in clusters which resulted in an underestimate of the secondary emission flux.
No existing models produce an EUV intensity distribution that is highly correlated with the thermal X-rays as shown in Figure 5, and simultaneously produce a constant ratio between the azimuthally averaged EUV and X-ray intensities as illustrated in Figure 2. Therefore, we have searched for a new model that would naturally produce these outcomes.
4.1 General Constraints
Before introducing a specific model that will yield these observational findings, we first establish some general constraints on the emitting particles and their environment that would apply to any successful model. In the IC-CMB scenario, the EUV excess is produced by electrons of characteristic energy MeV (), where is the EUV photon energy, normalized to 150eV ().
The magnitude and distribution of the magnetic field in the cluster are important constraints in any model for non-thermal emissions in Coma. Extensive work has been carried out in efforts to determine the magnetic field strength. Recent summaries of the observational situation and possibility of reconciling the (apparently) contradictory results have been provided by Kronberg 2003; Clarke 2003; and Brunetti 2003. Different approaches yield different results. One approach is to calculate the field based on the assumption of equipartition between the energy density of the relativistic particles associated with the radio emission and the magnetic field. A recent and especially detailed result for the Coma Cluster using this approach has been obtained by Thierbach et al. 2003 who find an equipartition field of Gauss if electrons are the relativistic gas, or Gauss if the proton-to- electron energy density ratio in the relativistic gas is the same as that in the ISM. Faraday rotation measures of radio sources in clusters have been extensively studied as a means of determining cluster magnetic fields. Very high fields have been obtained using sources embedded in the cores of clusters with cooling centers (Eilek 1999; Taylor et al. 1999). Rotation measures of radio sources behind clusters have been measured by a number of groups (Kim et al. 1990; Feretti et al. 1995). The most extensive results using this approach have been obtained by Clarke et al. 2001. They find fields that are typically in the range of 5 to 10 Gauss.
Fields in the range of 0.1 to 5 Gauss are required if the EUV excess is the product of IC-CMB in a uniform magnetic field (e.g. Hwang 1997; Atoyan & Völk 2000; Brunetti et al. 2001b; our discussion below), but the higher values in this range can only be realized if a rather arbitrary high energy cutoff is imposed upon the underlying cosmic ray spectrum, or if the cosmic ray spectrum is very steep. A less extreme explanation for the lower fields required in IC-CMB models for the EUV is that the magnetic fields are not homogeneous and that the EUV excess originates in low-field regions while high-field regions produce the higher Faraday rotation measures (Petrosian 2001; Newman et al. 2002; Beck et al. 2002). Tregillis et al. 2003 studied synthetic radio and X-ray images derived from high resolution three-dimensional MHD radio galaxy simulations to compare average field estimates with actual magnetic field properties in the simulated objects. They found that the estimated fields roughly corresponded to actual rms fields, but scattered around the physical rms value by a factor of 2-3. In light of the above discussion, we assume a field of about 1 Gauss in the ICM of the Coma Cluster in the following.
Energy loss timescales provide an important general constraint on models for the EUVe. For conditions in the X-ray core of Coma, approximately coinciding with the EUV excess (thermal electron density, , Briel et al. 1992), IC-CMB and Coulomb energy losses are currently roughly comparable at 200 MeV (e.g. Sarazin 1999; Petrosian 2001). However, since synchrotron energy losses compare to IC losses by the ratio and , this ratio was probably smaller in the past. With a magnetic field of about 1 Gauss, synchrotron losses can be neglected. Using standard relations (e.g. Sarazin 1999; Petrosian 2001) and correcting the IC-CMB loss rate for the Hubble expansion with , but assuming was not greater in the past, it is simple to demonstrate that IC-CMB losses were dominant over Coulomb losses at these energies, and that the characteristic IC-CMB energy-loss lifetime for EUVe is Gyr.
Another key point is that electrons at these energies diffuse very slowly in the intracluster medium (Schlickeiser et al. 1987; Völk et al. 1996) For Bohm diffusion in a Gauss field, 200 MeV electrons would diffuse only about 10 pc during their lifetimes. In almost any plausible cluster field and turbulence model the EUVe are effectively tied to the local plasma. Mixing of the cluster plasma will take place on timescales of Gigayears in response to stirring in the cluster (e.g. Markevitch, Vikhlinin & Mazzotta 2001) caused by mergers and AGN activity. But since the EUVe electrons are tied to the cluster medium, the spatial distribution of both of these species will be similar, though not identical. In clusters with current active energy deposition such as Virgo or Hydra, fresh particle populations will not become mixed immediately, as illustrated by the X-ray holes seen in such clusters (e.g. Nulsen et al. 2002). On Gigayear timescales, however, the nonthermal particles will become mixed throughout the cluster.
We next explore spectral constraints on the EUVe population that can be derived by requiring that it does not produce emission in other bands that exceeds those observed. The EUVe population directly includes only energies near 200 MeV, but is likely to continue to higher energies following a normal power-law spectrum. In particular, we see no reason to introduce an artificial cutoff at higher energies. Clearly an important constraint is that the high energy extension of the EUVe population does not produce IC-CMB in excess of the observed non-thermal high energy excess (hereafter HRX). Both BeppoSax (Fusco-Femiano et al. 1999) and RXTE (Rephaeli & Gruber 2002) gave results that can be expressed in terms of a flux near 40 keV of inside a radius degree. If the EUVe population includes electron energies approaching 4 GeV, its IC-CMB spectrum will reach into this band. Our measured EUV flux corresponds to at 150 eV. A simple power-law extension of the IC-CMB spectrum from 150 eV to 40 keV with a spectral index, , (, corresponding to an electron energy distribution , where ) would fall below the observed excess 40 keV flux if , or . Since the HRX field is substantially larger than the EUV source, the extended spectrum could be steeper, so is a conservative limit above MeV.
Similarly, extension of the EUVe population to higher energies could contribute detectable radio emission. This constrains both the form of the electron spectrum and the effective magnetic field strength, as discussed previously. The lowest frequency synchrotron flux measured for Coma C is 49 Jy at 30.9 MHz (Giovannini et al. 1993). The radiating electrons would have characteristic energies 1.4 GeV , where is the sky-plane component of the source magnetic field expressed in Gauss. For Gauss, these electrons would be roughly an order of magnitude more energetic than those producing the EUV emission. The requirement that the observed radio flux exceed any synchrotron flux, , produced by a high energy extension of the EUVe population can be conveniently expressed by the constraint , where is the observed IC-CMB flux in the EUV.
Assuming a power-law electron energy distribution over the relevant range, and that the EUV emission is IC-CMB, the ratio of the associated radio synchrotron flux to the EUV flux in a uniform magnetic field is easily shown to be (Jones et al. 1974)
| (1) |
where MHz and PHz are the observed frequencies for synchrotron and IC-CMB emission, and are constants tabulated in Jones et al. 1974, GHz, Gauss is a fiducial field strength whose energy density matches the CMB, and Hz.
A range of values for the integrated Coma C radio spectrum is viable; the appropriate choice depends on the (unknown) underlying source model (Thierbach et al. 2003). Reasonable values for the spectral index range from to 0.83. For consistency, values of near the observed limit would require model spectra at least as steep. The associated magnetic field constraint from equation 1 depends on the spectrum chosen. For example, it would range from Gauss for () to Gauss for (). If the magnetic field is isotropically oriented, these values of should be increased by roughly 20% to arrive at an estimate of the magnetic field.
4.2 Secondary Electrons as the Source of the EUV Flux in Coma
We now propose a specific model that produces the observational results presented here, and then demonstrate that this model does not violate the general constraints derived above. The observed correspondences between the EUV and thermal X-rays strongly suggest that the low energy EUV emitting particles and the thermal intracluster medium have a physical interdependence. As pointed out by Sarazin and Lieu 1998, the intuitively obvious relation between cosmic rays and thermal plasma is one in which the cosmic ray particles are relatively well mixed with the thermal plasma, i.e. in which . This would be a natural expectation if the cosmic rays were accumulated over much of the formation of the cluster, and its various constituent components mixed following mergers. A scenario that incorporates this expectation and leads to the required observational outcome of is that the EUV emission is the result of secondary electrons and positrons (hereafter SEP) produced as byproducts of inelastic collisions between well-mixed primary cosmic ray protons and the thermal intracluster plasma. The production rate for SEP scales as , where is the density of cosmic ray protons. Then if the SEP energy losses are independent of cluster position, as they would be for IC-CMB-dominated losses, the consequent distribution of EUVe is the required .
A variety of primary cosmic ray source mechanisms such as supernovae, active galaxies, and terminal galactic wind shocks might lead to the needed spatial distribution for this explanation of the EUV excess, so long as their contributions were spread over enough time and were spatially distributed into the various components.
However, another source seems to us to be the most likely candidate for these particles: cosmic rays accelerated at the large scale “structure shocks” that accompany cluster formation. These include what are usually termed merger and accretion shocks, although recent cosmology simulations demonstrate a more complex and richer shock pattern than those labels suggest (Miniati et al. 2000; Ryu et al. 2003). In a cosmic structure simulation that included shock-accelerated cosmic rays Miniati et al. 2001a indeed found that the cosmic ray proton distribution in the central regions of their clusters scaled roughly with the thermal gas although the two distributions did show differences from cosmic rays associated with recent shocks, especially outside the cluster core region.
A more detailed evaluation of our model requires that we estimate the population of cosmic rays responsible for the SEP. Inelastic collisions between cosmic ray protons with kinetic energies above about 300 MeV and the thermal intracluster medium produce mainly charged and neutral pions. The charged pions decay into muons and neutrinos, and the muons into the SEP that are responsible for the EUV emission. We express the cosmic ray proton density distribution as a power-law of the form
| (2) |
where is the proton energy.
The approximate formalism given in Mannheim and Schlickeiser 1994 gives us a simple expression for the net omnidirectional SEP production rate, , with energies MeV from p-p collisions. In particular, for a power law proton energy distribution we have
| (3) |
where , , and . At low energies this expression overestimates SEP production, so we have compared it with a numerical calculation for based on the more accurate pion production described in association with equation 5 (following) and the SEP distribution given by Moskalenko & Strong 1998. For electron energies of 150 MeV the two results agree to better than about 50% so in what follows we use the simpler expression in equation 3. We argued above that the lifetimes of the EUVe at MeV SEP are determined by their energy losses against IC-CMB. We can reasonably assume that the SEP density is set by a balance between p-p production and IC-CMB losses. Since the EUV emission is the same IC-CMB, it is straightforward to derive the expected omnidirectional EUV volume emissivity directly in terms of the cosmic ray proton density. The result using equation 3 is
| (4) |
where , and were identified in relation to equation 1, is the spectral index of the steady-state SEP energy distibution, and, once again, . With a constant cosmic ray density fraction, = , the EUV emissivity scales with , as required by the EUVE data for Coma.
Using this result we can integrate over the cluster to compute an EUV luminosity, which can then be compared with the observational result. The result will depend on an assumed cosmic ray energy spectral index as well as on the intracluster medium density distribution. If the cosmic ray proton flux is due to structure formation shocks, the cosmic ray spectrum represents an average from the shocks dissipated in the local gas over cosmic time. In the test particle limit for diffusive shock acceleration, which is a reasonable approximation for relatively weak shocks, the standard relation is , where is the shock Mach number. Strictly speaking, this index applies to the momentum spectrum, , of cosmic ray protons accelerated at shocks, rather than the energy spectrum, , that we defined in equation 2 in order to apply analytic expressions for our simple model estimates. The two spectra compare as . At relativistic energies the two forms converge; at the threshold for pion production, , , which roughly compensates for the overestimate in SEP production from equation 3.
In a recent detailed analysis of shocks formed in a high resolution cosmic structure formation simulation, Ryu et al. 2003 found that the most important shocks for cosmic ray acceleration were those with , corresponding to . To be specific in our estimates below we choose , which leads to and which will be consistent with the radio halo and HXR constraints. Then assuming a beta law distribution for the intracluster medium, , with , , (Briel et al. 1992) and kpc (corresponding to 10′.5 at 100 Mpc), we compute the spatially integrated EUV flux to be . Comparing this result to the observed , we obtain .
A test of the reasonableness of this result can be made by determining its consistency with upper limits on the -ray flux in the Coma cluster. In addition to charged pions, inelastic p-p collisions will produce neutral pions, which will quickly decay to -rays. The resultant -ray spectrum peaks near 70 MeV, but extends to higher energies and, in particular, into the MeV EGRET band.
The -ray emissivity due to a power-law cosmic ray spectrum approaches a power-law at high energies, making it relatively straightforward to compute an analytical estimate of the high energy flux. However, the EGRET band is too close to the 70 MeV peak for that approximation to be adequate for our needs. Fortunately, semi-empirical relations for our range of interest are available in the literature. We have followed the formulation laid out conveniently in Schlickeiser 2002. The omnidirectional -ray emissivity can be written as
| (5) |
where is the neutral pion production rate. That rate asymptotes to a power-law at high energies with spectral index , just as for the SEP, but drops sharply as the pions become nonrelativistic. Using the full expressions given by Schlickeiser, assuming and integrating equation 5 over photon energy, we obtain . From the values established above for Coma, including the required cosmic ray density fraction, , we obtain an estimated -ray flux . Sreekumar et al. 1996 give a 2 upper flux limit in this band of for the Coma cluster. This is well above the -ray flux produced by our required SEP population.
Simulations such as those of Miniati et al. 2000, 2001a,b and Ryu et al. 2003 have suggested that structure formation shocks might lead to cosmic ray energy pressures approaching as much as 1/3 the total intracluster medium pressure. Accordingly, we have estimated the cosmic ray energy density in the core of Coma that would be necessary under the SEP model we have proposed. For the proton spectra of immediate interest (), most of the kinetic energy resides in mildly relativistic particles, independent of whether we use the energy power law of equation 2 or the analogous momentum power law. We can write approximately , which gives for the nonrelativistic cosmic ray proton distribution. This compares to the thermal energy density, . This rough estimate can be compared to estimates from cosmology simulations which range upwards of tens of percent (e.g. Miniati et al. 2001a; Ryu et al. 2003).
We can summarize the constraints on our model as follows. The electron energy spectrum must have a power law slope steeper than , in order to avoid excess inverse-Compton hard X-ray emission. Constraints set by the observed radio synchrotron flux depend on the spectral index of the radio emission and the cluster magnetic field. An electron spectrum with , requires the cluster magnetic field be Gauss. If the cluster field must be Gauss. These outcomes are shown graphically in Figure 6.

5 Conclusions
We have analyzed archival data obtained with EUVE on the core of the Coma cluster. We find the ratio of the azimuthally averaged EUV and X-ray intensities is essentially constant with increasing cluster radius. In addition, a correlation of the diffuse EUV emission with the diffuse X-ray emission shows that the detailed spatial distributions of these emissions are quite similar, but not identical.
XMM-Newton and Chandra observations show that there is no intracluster 106 K gas in the core of the cluster and hence that the EUV emission must be non-thermal. The only viable non-thermal source for the EUV excess is photons inverse Compton scattered by 200 MeV electrons from the cosmic microwave background. To account for the observed EUV intensity distribution, the scattering electrons must be distributed with a spatial density roughly in proportion to the square of the thermal plasma density. A scenario that naturally produces these results is that the EUV emitting particles are electron/positron secondaries produced by inelastic collisions between primary cosmic ray protons and thermal protons with similar spatial distributions. This type of distribution would be a natural outcome if the cosmic rays had been produced over the past several Gyr and had become well-mixed with the intracluster medium.
This model accounts naturally for the average spatial distribution of the EUV emission in relation to the X-ray emission. It accounts for the similar, but imperfect, pixel-to-pixel correspondence of the EUV and X-ray emission. Finally, it accomplishes this without violating observational limits in other bands of the spectrum. We have demonstrated that the required underlying cosmic rays could reasonably have been produced in large scale structure shocks accompanying the cluster formation.
Secondary electrons as the source of the emission in radio halos were first suggested by Dennison 1980 and have since been discussed by a large number of authors. However, observational evidence for the presence of these particles has been lacking. There is, in fact, a growing body of evidence that, in general, these particles may not be the underlying source of the emission in radio halos (Brunetti 2003; Kuo et al. 2003). Hence the EUV emission in the Coma cluster may be the only direct evidence for secondary electrons in an intracluster medium.
References
- (1) Arnaud, M., Aghanim, N., Gastand, R., Neumann, D., Lumb, D., et al. 2001, A&A, 365, L67
- (2) Atoyan, A., & Völk, H. 2000, ApJ, 535, 45
- (3) Beck, R., Shukurov, A., Sokoloff, D., & Wielebinski, R. 2003, astro-ph/0307330
- (4) Berghöfer, T., Bowyer, S., & Korpela, E. 2000, ApJ, 535, 615
- (5) Blasi, P. & Colafrancesco, S. 1999, APh, 12, 169
- (6) Bowyer, S., Lampton, M., & Lieu, R. 1996, Science, 274, 1338
- (7) Bowyer, S., & Berghöfer, T. 1998, ApJ, 506, 502
- (8) Bowyer, S., Berghöfer, T., & Korpela, E. 1999, ApJ, 526, 592
- (9) Bowyer, S., & Malina, R. 1991, in Extreme Ultraviolet Astronomy, ed. R. Malina & S. Bowyer (New York: Pergamon), 397
- (10) Bonamente, M., Lieu, R., & Mittaz, P. 2001, ApJ, 547, L7
- (11) Bregman, J., Novicki, M., Krick, J., & Arabadjis, J. 2003, ApJ, 597, in press.
- (12) Briel, U., Henry, J. P., & Böhringer, H. 1992, A&A, 259, L31
- (13) Brunetti, G., Setti, G., Feretti, L., & Giovannini, G. 2001a, MNRAS, 320, 365
- (14) Brunetti, G., Setti, G., Feretti, L., & Giovannini, G. 2001b, New Astronomy 6, 1
- (15) Brunetti, G. 2003, in ASP Conf. Ser. 301, Matter and Energy in Clusters of Galaxies, ed. S. Bowyer & C.-Y. Hwang (San Francisco: ASP), 349
- (16) Buote, D. 2000a, ApJ, 532, L113
- (17) Buote, D. 2000b, ApJ, 544, 242
- Clarke, Kronberg, & Böhringer (2001) Clarke, T. E., Kronberg, P. P., & Böhringer, H. 2001, ApJ, 547, L111
- (19) Clarke, T. E. 2003, in ASP Conf. Ser. 301, Matter and Energy in Clusters of Galaxies, ed. S. Bowyer & C.-Y. Hwang (San Francisco: ASP), 185
- (20) Dennison, B. 1980, ApJ, 239, 93
- (21) Dixon, W., Sallmen, S., Hurwitz, M., & Lieu, R. 2001, ApJ, 552, L69
- Dickey & Lockman (1990) Dickey, J. M., & Lockman, F. J. 1990, ARA&A, 28, 215
- (23) Dolag, K., & Enßlin, T. 2000, A&A, 362, 151
- Eilek (1999) Eilek, J. 1999, in Proceedings of Diffuse Thermal and Relativistic Plasma in Galaxy Clusters, ed. H. B hringer, L. Feretti, & P. Schuecker (Garching: MPE Report 271), 71
- (25) Enßlin, T. & Biermann, P. 1998, A&A, 330, 90
- (26) Enßlin, T., Lieu, R., & Biermann, P. 1999, A&A, 344, 409
- Feretti, Dallacasa, Giovannini, & Tagliani (1995) Feretti, L., Dallacasa, D., Giovannini, G., & Tagliani, A. 1995, A&A, 302, 680
- (28) Finoguenov, A., Briel, U. G., & Henry, J. P. 2003, submitted to A&A, astro-ph/0309019.
- (29) Fisher, R. A. 1935 in “Statistical Methods for Research Workers,” (Oliver & Boyd: Edinburgh)
- (30) Fusco-Femiano, R., dal Fiume, D., Feretti, L., Giovannini, G., Grandi, P., et al. 1999, ApJ, 513, 21
- (31) Giovannini, G., Feretti, L., Venturi, T., Kim, K.-T., & Kronberg, P. 1993, ApJ, 406, 399.
- (32) Govoni, F. Enßlin, T., Feretti, L., & Giovannini, G. 2001, A&A, 369, 441
- (33) Hardcastle, M. J. 2000, A & A, 357, 884
- (34) Hwang, C.-Y. 1997, Science, 278, 1971
- (35) Heiles, C., Koo, B. C., Levenson, N., & Reach, W. 1996, ApJ, 462, 326
- (36) Jones, T. W., O’Dell, L. S., & Stein, W. A. 1974, ApJ, 188, 353
- (37) Kaastra, J. S., Lieu, R., Tamura, T., Paerels, F., & den Herder, J. W. 2003, A&A, 397, 445
- (38) Kang, H., Jones, T. W., & Gieseler, U. D. J. 2002, ApJ, 579, 337
- (39) Kim, K.-T., Kronberg, P. P., Dewdney, P. E., & Landecker, T. L. 1990, ApJ, 355, 29
- (40) Kronberg, P. P. 2003 in ASP Conf. Ser. 301, Matter and Energy in Clusters of Galaxies, ed. S. Bowyer & C.-Y. Hwang (San Francisco: ASP), 169
- (41) Kuo, P.-H., Hwang, C.-Y., & Ip, W.-H. 2004, ApJ, in press
- Landini & Monsignori Fossi (1990) Landini, M., & Monsignori Fossi, B. C. 1990, A&AS, 82, 229.
- (43) Lieu, R., Ip, W.-H., Axford, W.-I., & Bonamente, M. 1999, ApJ, 510, L25
- (44) Lieu, R., Mittaz, J., Bowyer, S., Lockman, F., Hwang, C.-Y., & Schmitt, J. 1996a, ApJ, 458, L5
- (45) Lieu, R., Mittaz, J., Bowyer, S., Breen, J., Lockman, F., Murphy, E, & Hwang, C.-Y. 1996b, Science, 274, 1335
- (46) Lieu, R., Bonamente, M., & Mittaz, J. 1999a, ApJ, 517, L91
- (47) Lieu, R., Bonamente, M., Mittaz, J., Durret, F., Santos, S., & Kaastra, J. 1999b, ApJ, 527, L77
- (48) Lieu, R., Ip, W.-H., Axford, W. I., & Bonamente, M. 1999c, ApJ, 510, L25
- (49) Mannheim, K., & Schlickeiser, R. 1994, A&A, 286, 983
- (50) Markevitch, M., Vikhlinin, A., & Mazzotta, P. 2001, ApJ, 562, L153
- (51) Miniati, F., Ryu, D., Kang, H., Jones, T. W., Cen, R., & Ostriker, J. P. 2000, ApJ, 542, 608
- (52) Miniati, F., Ryu, D., Kang, H., & Jones, T. W. 2001a, ApJ, 559, 59
- (53) Miniati, F., Jones, T. W., Kang, H., & Ryu, D., 2001b, ApJ, 562, 233
- (54) Mittaz, J., Lieu, R., & Lockman, F. 1998, ApJ, 498, L17
- (55) Moskalenko, I. V. & Strong, A. W. 1998, ApJ, 493, 694
- (56) Newman, W. I., Newman, A. L., & Rephaeli, Y. 2002, ApJ, 575, 755
- (57) Nulsen, P. E. J., David, L. P., McNamara, B. R., Jones, C., Forman, W. R., & Wise, M. 2002, ApJ, 568, 163
- (58) Peterson, J.R., Paerels, F.B.S., Kaastra, J.S., et al. 2001, A&A, 365, L104
- (59) Petrosian, V. 2001, ApJ, 557, 560.
- (60) Rephaeli, Y. & Gruber, D. 2002, ApJ, 579, 587
- (61) Ryu, D., Kang, H., Hallman, E., & Jones, T. W. 2003, ApJ, in press
- (62) Sarazin, C., & Lieu, R. 1998, ApJ, 494, L177
- (63) Sarazin, C. L. 1999, ApJ, 520, 529
- (64) Snowden, S., McCammon, D., Burrows, D., & Mendenhall, J. 1994, ApJ, 424, 714
- (65) Schlickeiser, R., Sievers, A., and Thieman, H. 1987, A&A, 182, 21
- (66) Schlickeiser, R. 2002, Cosmic Ray Astrophysics (Springer-Verlag, Berlin), Ch 5.
- (67) Sreekumar, P., Bertsch, D. L., Dingus, B. L. et al. 1996, ApJ, 464, 628
- Sutherland & Dopita (1993) Sutherland, R. S. & Dopita, M. A. 1993, ApJS, 88, 253
- Taylor, Allen, & Fabian (1999) Taylor, G. B., Allen, S. W., & Fabian, A. C. 1999, in Proceedings of Diffuse Thermal and Relativistic Plasma in Galaxy Clusters, ed. H. B hringer, L. Feretti, & P. Schuecker (Garching: MPE Report 271), 77
- Tregillis, Jones, & Ryu (2003) Tregillis, I. L., Jones, T. W., & Ryu, D. 2003, ApJ, submitted, astro-ph/10719
- Thierbach, Klein, & Wielebinski (2003) Thierbach, M., Klein, U., & Wielebinski, R. 2003, A&A, 397, 53
- (72) Tsay, M., Hwang, C.-Y., & Bowyer, S. 2002, ApJ, 566, 794.
- (73) Vikhlinin, A., Markevitch, M., Forman, W., & Jones, C. 2001, ApJ, 555, L87
- (74) Volk, H., Aharonian, F. & Breitschwerdt, D. 1996 SSR 75, 279
Note added in proof.- Miniati has recently remodeled the nonthermal emission from clusters with an improved treatment (F. Miniati, MNRAS, 342, 1009 [2003]). In his published work, he shows results only above 10 keV. However, he has now extended his work to lower energies and has calculated the EUV flux with the specific parameters of the Coma Cluster (F. Miniati, 2004, private communication). He finds that the IC EUV emission from SEPs is consistent at the 20% nominal level with the measured EUV flux reported here. Further the spatial distribution for this emission is concentrated in the inner Mpc of the cluster. These results provide additional support for the ideas presented here.