The host of GRB 030323 at =3.372: a very high column density DLA system with a low metallicity††thanks: Based on observations collected at the European Southern Observatory, Chile, by GRACE (Gamma-Ray Burst Afterglow Collaboration at ESO), under program ID 70.D-0523(B), and with NASA’s Hubble Space Telescope.
We present photometry and spectroscopy of the afterglow of GRB 030323. VLT spectra of the afterglow show damped Ly (DLA) absorption and low- and high-ionization lines at a redshift =3.37180.0005. The inferred neutral hydrogen column density, log N(H i)=21.900.07, is larger than any (GRB- or QSO-) DLA H i column density inferred directly from Ly in absorption. From the afterglow photometry, we derive a conservative upper limit to the host-galaxy extinction: AV0.5 mag. The iron abundance is [Fe/H]=–1.470.11, while the metallicity of the gas as measured from sulphur is [S/H]=–1.260.20. We derive an upper limit on the H2 molecular fraction of 2(H2)/(2(H2)+(H i))10-6. In the Ly trough, a Ly emission line is detected, which corresponds to a star-formation rate (not corrected for dust extinction) of roughly 1 M⊙ yr-1. All these results are consistent with the host galaxy of GRB 030323 consisting of a low metallicity gas with a low dust content. We detect fine-structure lines of silicon, Si ii*, which have never been clearly detected in QSO-DLAs; this suggests that these lines are produced in the vicinity of the GRB explosion site. Under the assumption that these fine-structure levels are populated by particle collisions, we estimate the H i volume density to be n cm-3. HST/ACS imaging 4 months after the burst shows an extended AB(F606W)=28.00.3 mag object at a distance of 014 (1kpc) from the early afterglow location, which presumably is the host galaxy of GRB 030323.
Key Words.:
gamma rays: bursts – galaxies: distances and redshifts – quasars: absorption lines – dust, extinction1 Introduction
Damped Ly (DLA) absorbers, conventionally detected in Quasi-Stellar Object (QSO) spectra, are absorption-line systems that have a column density of N(H i) 2 atoms cm-2, as determined from the damping wings of the Ly line (e.g. Wolfe et al. 1986; Turnshek et al. 1989). DLA systems are believed to contain the bulk of the neutral hydrogen at high redshift and to be the gas reservoir from which the stars at the present epoch are produced (e.g. Wolfe 1987; Lanzetta et al. 1991). Numerous high-resolution spectroscopic studies have extracted detailed information about the metallicity (e.g. Prochaska et al. 2003a), the kinematics (Prochaska & Wolfe 1997; Ledoux et al. 1998), and the dust and H2 contents (Petitjean et al. 2000; Ledoux et al. 2003) of DLA systems as a function of redshift. Despite intensive searches, only a handful of DLA counterparts have been detected so far (see Møller et al. 2002b); linking DLA systems with galaxy types has therefore proven difficult: some advocate large, disk-forming galaxies (e.g. Wolfe et al. 1995; Prochaska & Wolfe 1997), others suggest they are faint, gas-rich dwarfs (Haehnelt et al. 1998).
Gamma-ray burst (GRB) afterglows are, just as QSOs, bright and distant sources. For instance, the spectacular GRB 990123 was detected at the 9th visual magnitude (Akerlof et al. 1999) while it was located at =1.6 (Kulkarni et al. 1999; Andersen et al. 1999). However, the afterglow brightness in general fades very rapidly in time (roughly flux time-1). The current afterglow redshifts range from =0.169 (Greiner et al. 2003) to =4.5 (Andersen et al. 2000). Moreover, GRBs are associated with massive-star formation: the discovery of a supernova (SN) spectrum similar to that of SN1998 bw (Galama et al. 1998b) superimposed on the GRB 030329 afterglow spectrum (Stanek et al. 2003; Hjorth et al. 2003b) provided strong evidence that at least some of the long-duration ( 2s) GRBs are caused by the core collapse of massive stars (Woosley 1993; MacFadyen & Woosley 1999).
The discovery of a damped Ly (DLA) absorption line at the burst redshift in the spectra of several GRB afterglows (Jensen et al. 2001; Fynbo et al. 2001; Hjorth et al. 2003a) is consistent with the massive-star progenitor scenario: they indicate a high neutral hydrogen column density origin in the host galaxy, presumably a star-forming region. However, the signal-to-noise ratio at the location of the DLA absorption line in the spectra is fairly low in these cases, much lower than for typical QSO-DLAs. We here present afterglow spectra of the high-redshift GRB 030323, which unambiguously demonstrate a GRB-DLA, with a column density exceeding that of any (QSO- or GRB-) DLA measured so far using Ly in absorption. These spectra allow us to measure the metallicity of the host environment and obtain an upper limit on the molecular fraction, i.e. measurements that are routinely performed for QSO-DLAs, but that are still unique for GRB hosts. Although the GRB-DLA sample is still very small, we compare them with QSO-DLAs in two aspects: their H i column density and their metallicity.
GRB 030323 was detected on 23 March 2003 at 21:57 UT by HETE (Graziani et al. 2003) with a fluence of 1.110-6 ergs cm-2 (30-400 keV), and a duration of 26 seconds. Following the HETE localization, the optical counterpart was discovered 7.6 hours after the burst at R.A. 11h06m0938, Decl. –21∘46′133 (J2000) by Gilmore et al. (2003), with a brightness of R=18.7. Our team reported a preliminary redshift of =3.372 (Vreeswijk et al. 2003), which is currently the third highest redshift for a GRB (Kulkarni et al. 1998; Andersen et al. 2000).
This paper is organized as follows: in Sect. 2, we describe the data reduction of both the spectroscopic and imaging observations. In Sect. 3, we present the light curves and infer an upper limit on the rest-frame optical extinction. We measure the equivalent widths of the absorption lines and determine the burst redshift in Sect. 4. An H i column density model is fitted to the damped Ly line in Sect. 5, and we analyze the spectra in more detail in Sect. 6 to derive the metallicity and an upper limit on the molecular hydrogen (H2) fraction. The detection of Ly in emission is presented in Sect. 7, and we report on the detection of the probable host galaxy of GRB 030323 in HST/ACS imaging data in Sect. 8. In the final section, we close with a general discussion of all these results.
-
a
The magnitudes have not been corrected for Galactic extinction, and the errors do not include the uncertainty in the absolute calibration (see text).
-
b
Combinations of telescopes and instruments: USNO Flagstaff Station 1.0m with 2k2k Tek CCD, 068/pixel; Calar Alto 2.2m and CAFOS with 1k1k SITe CCD, 029/pixel; ESO/Danish 1.54m and DFOSC with 2k4k EEV CCD, binned to 078/pixel; Yepun and FORS2 with two MIT CCDs of 4k2k, binned to 025/pixel; Yepun and NACO with the Aladdin InSb 1k1k detector and S54 camera, 0054/pixel; SARA 0.9m and Apogee Ap7 CCD camera with 512512 array, 07/pixel; UKIRT and UFTI with a 1k1k HgCdTe array, 0091/pixel; Gemini South and acquisition camera with 1K1K EEV CCD, binned to 023/pixel; HST/ACS and WFC detector with two 2k4k SITe CCDs, 005/pixel.
2 Observations and data reduction
The spectroscopic observations of GRB 030323 were performed with the Focal Reducer Low Dispersion Spectrograph 2 (FORS2) at unit 4 (Yepun) of the Very Large Telescope (VLT) at the European Southern Observatory (ESO) at Paranal, Chile. The imaging observations were performed with a variety of telescopes and instruments. Tables 1 and 2 show the spectroscopy and imaging observation logs.
The images and 2-D spectra were bias-subtracted and flat-fielded in the usual manner, mostly within IRAF111IRAF is distributed by the National Optical Astronomy Observatories, which are operated by the Association of Universities for Research in Astronomy, Inc., under cooperative agreement with the National Science Foundation.. Following this, the spectra were cosmic-ray cleaned using the L.A. Cosmic program written by Van Dokkum (2001). Each spectrum was extracted separately, and wavelength-calibrated using an HeNeAr lamp. The error in the wavelength solution was of the order of 0.1Å for the low resolution 300V and 300I grisms (with / of 440 and 660, respectively), and 0.03Å for the intermediate resolution grisms 1400V and 1200R (with / 2100).
Flux calibration was performed using the standard LTT3864, and the slit losses were determined for each grism by fitting a Gaussian along the spatial direction of the summed 2-D spectra, every 4 pixels across the entire dispersion axis (i.e. summing 4 columns before performing the fit). The resulting Gaussian full width at half maximum (FWHM) was then compared to the slit width to obtain the slit loss (i.e. the fraction of the surface underneath the Gaussian fit that is outside the slit width) along the dispersion axis. The slit loss profile was then fitted with a polynomial to correct the spectra. All GRB spectra were taken with a 1″ slit, and slit losses were as high as 60% for the blue part of the 300V grism, while around 15% for the other grisms. The standards were observed with 5″ slits, and therefore do not suffer from slit losses. We note that Yepun/FORS2 contains a linear atmospheric dispersion compensator (LADC) in the light path, which minimizes any colour-differential slit losses up to a zenith distance of 45°. However, the last three 1200R spectra were taken at an airmass above this limit, and are therefore affected.
Finally, the first night’s 300V+300I and second night’s 1400V+1200R spectra were combined into two full spectra and corrected for Galactic extinction (Schlegel et al. 1998). The scaling between the blue and red parts in the combining of the 300V with 300I spectra, and 1400V with 1200R, was determined from an overlapping region free of lines, and amounted to 3.5% of the continuum level between 300V and 300I, and 2% for 1400V and 1200R, which can be explained by the fading of the afterglow between the epochs at which the spectra were taken.
Comparison between the spectroscopy and imaging absolute calibration shows that the spectroscopic flux is roughly 30% below the BVRI photometric measurements (i.e. not colour dependent) that were taken around the same epoch. We have not corrected the spectrum in Fig. 3 for this difference.

3 Photometry
The magnitudes of the afterglow (see Table 2) were determined through aperture photometry, relative to a set of reference stars. The aperture radius was set to the average FWHM of the point spread function of stars on the image (column 5 in Table 2). The early July upper limits are 3, and also for an aperture radius the size of the seeing disk. The reference stars in the optical were tied to the absolute calibration provided by Henden (2003). This was found to be consistent with our own calibration on two different nights, but during which only one standard field was observed. For the near-infrared filters we used the calibration provided by the 2MASS222see http://www.ipac.caltech.edu/2mass/, as none of the nights on which the near-infrared data were taken were photometric. The magnitude errors listed in Table 2 are a combination of the Poisson error of the afterglow measurement and the scatter in the reference star magnitudes; they do not include the error in the absolute calibration. For the optical bandpasses, we determined this absolute error by calculating the average difference of two calibrations on two different nights provided by Henden (2003) for several stars; we find the following magnitude errors: 0.02 (B), 0.03 (V), 0.02 (R), and 0.12 (I). For the infrared filters the absolute calibration error is provided by Cohen et al. (2003), which amount to 0.02 mag for J, H and K. No correction has been attempted for the fact that the observations were taken with filters from different systems. The magnitudes listed in Table 2 have not yet been corrected for the Galactic foreground absorption.
Fig. 1 shows the light curves of GRB 030323 in several wavelengths. The light curves can be fit neither with a single power law, nor with a broken power law. This is clear from performing simple power law fits to the early epochs in the optical bands, and extrapolating these to later times. These fits are shown by the dashed lines in Fig. 1. The V band light curve shows the clearest deviation in between day 2 and 3 after the burst. However, after day 3 the observations are fairly well described again by the extrapolation of the early slope, even the R band measurement around day 10. The V band extrapolation underestimates the late-time HST point by roughly a magnitude, which suggests that the afterglow has become fainter than its host galaxy at this epoch.
Several afterglows have displayed deviations from the common smooth power law decay, such as GRB 970508 (e.g. Galama et al. 1998a), GRB 000301C (e.g. Masetti et al. 2000), GRB 021004 (e.g. Holland et al. 2003), and GRB 030329 (e.g. Price et al. 2003). Garnavich et al. (2000) have suggested that a microlensing event caused the deviations in GRB 000301C. In the context of the fireball model, the deviations in the case of GRB 021004 are interpreted as due to a variable external density (Lazzati et al. 2002b), and for GRB 030329 they are interpreted as due to refreshed shocks from the inner engine (Granot et al. 2003). We note that the cannonball model offers an alternative explanation for these observations (Dado et al. 2002, 2003a, 2003b). For GRB 030323, we only study the global properties of the light curve, and compare them to the light curve decay and spectral slope values as predicted by the fireball model (e.g. Sari et al. 1998, 1999), with the aim of constraining the host-galaxy extinction.
As the late-time afterglow behaviour is not clear, we only use the simple power law fits to the early optical data. The inferred optical temporal decay indices are consistent with one another, with an average decay of =–1.560.03 (using the convention: Fν(t) t). The near-infrared slopes have similar values as the optical ones: = –1.810.39, = –1.420.14 and = –1.460.31. However, these may be affected by the “bump” in between day 2 and 3, if it is achromatic.
At several epochs after the burst, observations in at least two filters were performed around the same epoch. This allows us to construct broad-band spectral energy distributions (SEDs) and fit them to obtain the optical to near-infrared spectral slopes at these epochs. Note that we discard the B and V bands, as these are attenuated by the Ly line and forest absorption. For day after burst 0.40, 1.18, 2.17, 2.44, 3.27, and 4.50, we obtain: = –1.050.64 (=0), = –0.830.61 (=0), =–1.090.07 (=4.5), =–0.800.05 (=1.7), =–1.21.0 (=0), and =–0.820.12 (=4.5). For the epochs with =0, observations in only two filters are available. Except for the fit value at day 2.17, these values are consistent with being constant, and the weighted mean and its error is = –0.890.04.
We now compare these observed spectral slopes with the ones predicted by the fireball model to obtain an estimate of the host-galaxy extinction. An important assumption that we make in estimating the optical extinction is that the intrinsic afterglow spectrum is a power law, which is a consequence of the fireball theory for GRB afterglows. The fireball theory has been quite successful in explaining the observations (but see Dado et al. 2002). The predicted spectral slope depends on the assumed circumburst density profile being either constant or that of a stellar wind (see Li & Chevalier 2001), whether the light curve is in the jet regime or not (see Sari et al. 1999), and whether the cooling break (see Sari et al. 1998) has already passed the optical wavebands (cooling regime) or not. Considering all these possibilities, the predicted spectral slope ranges from =(+1)/2=–0.280.01 (wind or constant density medium, post jet-break and non-cooling regime) to =(2–1)/3=–1.370.01 (wind or constant density, pre jet-break and cooling regime), with =–1.560.03. We have assumed that these relations between and are also valid for a power law index of the electron energy distribution, (but see Dai & Cheng 2001).
All intrinsic spectral slopes shallower than the observed slope of –0.890.04 leave some room for host-galaxy extinction (see Ramaprakash et al. 1998), as any host-galaxy extinction results in a steepening of the intrinsic slope. We conservatively take –0.280.01 to be the actual slope, to obtain an upper limit on the host-galaxy extinction. Using the extinction-curve fits of Pei (1992) for the Milky Way (MW), and the Large- and Small Magellanic Clouds (LMC and SMC), we iteratively find AV that fits best with the expected spectral slope of –0.28 (held fixed in the fit) for the energy distribution at 2.44 days after the burst. We find AV(MW)=0.50 mag (=1.5), AV(LMC)=0.25 mag (=1.8) and AV(SMC)=0.16 mag (=2.3). These fits are shown in Fig. 2. We note that if we would have assumed that the light-curve break occurred after day 1.4, which is likely, then the expected spectral slope would be =(2+1)/3=–0.71, and the extinction values would decrease to AV(MW)=0.09 mag (=1.3), AV(LMC)=0.04 mag (=1.4) and AV(SMC)=0.02 mag (=1.4). When we do not fix the intrinsic slope at a particular value (but still assume that the intrinsic spectrum is a power law), we find spectral slopes ranging from –0.80 to –0.67, and AV from 0 to 0.12 mag. Therefore, a very conservative upper limit on the host galaxy extinction is: AV0.50 mag.


4 Absorption-line measurements and redshift
The combined 1400V+1200R spectrum of GRB 030323, corrected for Galactic extinction, is shown in Fig. 3. The most obvious feature is the very broad absorption line around 5300Å, which can be identified as Ly. Redward of Ly several metal absorption lines are detected, and to the blue the intervening Ly forest is present. We also show the 1 Poisson error spectrum.
After normalization of the spectrum with a high-order (25) polynomial, we measured all possible lines with splot in IRAF, summing the equivalent width (EW) of the individual pixels, and determined the line center. In case two lines were clearly blended, we used splot to deblend, using Gaussian line shapes, and forcing a single FWHM for both lines. The EWs and centers of the lines above 5 significance are tabulated in Table 3 for both the low- (lr) and high-resolution (hr) spectrum, along with the error in the EW, the line identification and the line redshift. These line redshifts are determined from the high-resolution spectrum, unless the line is not covered by this spectrum (i.e. above 7310Å and below 4560Å – see Table 1). The error in the EW is determined by: , where the error spectrum () is normalized by the high-order polynomial continuum fit of the object spectrum, and is summed over the same pixels (i) that were used to measure the line EW. is the number of Å per pixel, which is 3.2 and 0.64 Å/pixel for the combined 300V+I and 1400V+1200R spectra, respectively.
Using all lines that are detected above 5 significance and that could be identified, we find (lr)=3.37280.0011 and (hr)=3.37160.0005, for the low- (lr) and high-resolution (hr) spectrum, respectively. We adopt the weighted mean of these values as the redshift of GRB 030323: =3.37180.0005. There is no doubt that this is the redshift of GRB 030323 and not that of a chance foreground galaxy, since otherwise Ly forest lines redward of the DLA line would have been detected. We find that the strongest lines in the red part of the high-resolution spectrum, C iv1548, 1550, are split into separate components (see the inset of Fig. 3) with a velocity difference of 13060 km s-1 (where the error on the wavelength determination of the lines in the blend is 1Å). Such a velocity spread is consistent with the absorption taking place in separate regions in the host galaxy.
Several lines that are detected above 5 can not be identified, some of which correspond to significant lines in the standard star spectra. Most of these are imprinted on the spectrum by the Earth’s atmosphere. Several lines not belonging to the GRB host galaxy can in principle be identified with Fe ii 2344.2, 2600.1 (although an atmospheric line is detected at the latter wavelength) and Mg ii 2796.3, 2803.5, all around =1.41. However, the oscillator strength of Fe ii 2382 is three times larger than that of the detected Fe ii 2344, but this line is not detected. Moreover, both Fe ii lines are stronger than Mg ii, which is usually not observed (e.g. Boissé & Bergeron 1985; Steidel & Sargent 1992). Therefore, we consider the existence of this foreground absorption system to be highly uncertain.
The optical/UV flash of the GRB is expected to alter its immediate environment, possibly leading to a change in absorption-line strengths as a function of time (see Perna & Loeb 1998; Vreeswijk et al. 2001; Perna et al. 2003). Comparing the low- and high-resolution equivalent widths in Table 3 shows that none of the lines detected in both spectra are significantly varying (3).
-
a
Ly is located in the Ly forest, which causes it to be blended with forest lines, and the continuum placement is highly uncertain, resulting in a large EW error.
-
b
The lines at 5652.0, 6278.0, 6743.0, and 6754.2 can in principle be identified with Fe ii and Mg ii at =1.41; however, strong absorption is then expected from Fe ii 2382, which is not detected.
-
c
The lines for which significant absorption was also detected in the standard star spectrum are marked with a .
5 H i column density
We have fitted a power law continuum to the high-resolution spectrum over the wavelength range 5870–7000 Å and determined a power law slope (in ) of –0.760.09 (fitting only the first 1200R spectrum, as the other 1200R spectra suffer from colour-dependent slit losses). This value is in agreement with the red slope of the 300I spectrum and with the slope of the photometry measurements (see Sect. 3). We used an extrapolation of this power law to blue wavelengths in order to normalize the entire spectrum. The resulting average flux decrement in the Ly forest between Ly and Ly: (Oke & Korycansky 1982), that we obtain is =0.44 0.04. This decrement, which is due to intervening hydrogen systems, is consistent with that observed in QSO lines of sight at the redshift of GRB 030323 (Cristiani et al. 1993).

A fit to the strong Ly absorption (using the DIPSO package within Starlink) yields log N(H i)=21.900.07. This fit is shown in the inset of Fig. 3. This is the 7th GRB for which a neutral hydrogen column has been determined from the afterglow spectrum, and GRB 030323 happens to have the highest H i column density measured so far. Fig. 4 shows a comparison of the H i column density distribution of QSO-DLAs (taken from the compilation of Curran et al. 2002) and GRB-DLAs (Jensen et al. 2001; Fynbo et al. 2001; Hjorth et al. 2003a, Jakobsson et al. 2004, in prep., and this paper). For completeness, we also show the two GRBs for which Ly was detected but which do not qualify as a DLA system: GRB 011211 (Vreeswijk et al. 2004, in prep.) and GRB 021004 (Møller et al. 2002a). It is quite striking that out of 7 GRB afterglows for which Ly was red-shifted into the observable spectrum, 5 show evidence for a high column density DLA system. This clearly demonstrates that GRBs explode in either galaxies, or regions within galaxies with high neutral hydrogen column densities. The H i gas responsible for these large columns could be related to the site of the GRB explosion, e.g. part of the massive-star forming region in which the GRB occurred, but could also be gas that is not associated with the GRB, further away in the host galaxy. We performed a Kolgomorov-Smirnov (KS) test (e.g. Press et al. 1992) to estimate that the probability that both samples are drawn from the same parent distribution is 0.0006. Moreover, in this comparison with QSO-DLAs, the GRB-DLA H i column densities are in fact lower limits as the GRB itself occurs within the galaxy that is associated with the DLA system; if the GRB sightlines would have been probed with background QSOs, their column densities would have been on average a factor of two larger, which would shift the GRB column densities in Fig. 4 by 0.3 dex upward. However, GRB 011211 would then move into the GRB-DLA sample resulting in a only a slight decrease in the above-mentioned KS probability.
6 Metallicity and H2 content
Although there are many metal lines observed in the spectrum of this GRB, most of them are saturated in the intermediate resolution spectrum. We have identified only 2 sets of lines as potentially unsaturated, based on their small (Å) rest-frame equivalent widths (EWs). These are the S ii triplet and Fe ii . Two of the S ii lines () show signs of blending, evidenced by a weak component that broadens the line in its blue wing, and a strong interloper redward of the line. S ii appears as an unresolved single component. We measured the observed EWs of S ii and Fe ii to be 1.25Å and 0.72Å (EWrest= 0.29Å and 0.16Å), respectively. In the optically thin limit, these correspond to the column densities: log N(S ii)=15.3 and log N(Fe ii)=15.7, and abundances [S/H]=–1.8 and [Fe/H]=–1.7. In this conversion from column density to abundance, we assumed the Solar values from Grevesse & Sauval (1998), and no correction for ionization; i.e. we assumed that the column densities of S ii and Fe ii are equal to the total column densities of S and Fe, as the singly ionized state of both of these elements should be the dominant one in a region with such a high H i column density. This has been motivated theoretically for QSO-DLAs (Viegas 1995; Vladilo et al. 2001); we here assume that ionization corrections are also negligible in GRB-DLAs.
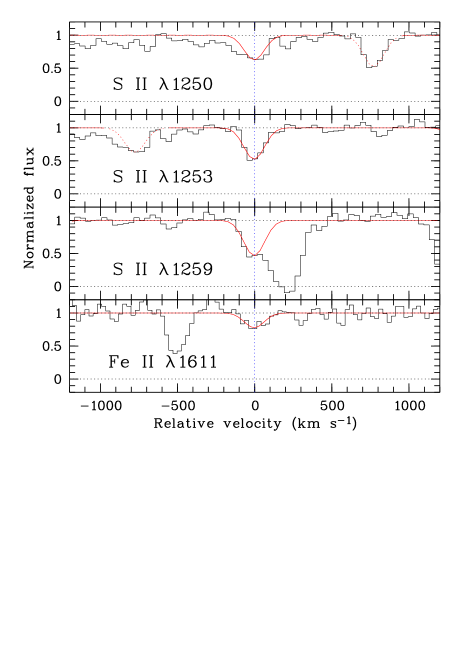
In a second step, we performed a simultaneous one-component fit to the lines S ii and Fe ii , taking into account line blending and a range of broadening parameters. Fig. 5 shows the resulting fits. We find log N(S ii)=15.840.19 and log N(Fe ii)=15.930.08, together with a (turbulent) broadening parameter b=3510 km s-1. Comparing these column densities with those from the optically thin limit approximation shows that the S ii and Fe ii lines are slightly saturated. These measured column densities correspond to the abundances: [S/H]=–1.260.20 and [Fe/H]=–1.470.11. Therefore, although the N(Fe ii) is large (see also Savaglio et al. 2003), the [Fe/H] is only marginally higher than that of QSO-DLAs at this redshift: the mean [Fe/H] of 26 QSO-DLAs with 3.03.5 from Prochaska et al. (2003a) is –1.83, with a scatter of 0.35.
Since essentially all DLA systems observed toward QSOs have [S/Fe] greater than zero (see Lopez & Ellison 2003, for a recent compilation and discussion), our measurement of [S/Fe]=0.210.23 in GRB 030323 does not represent a very stringent constraint on a possible -element overabundance. Moreover, as iron is a known dust-depleted element, there could be a small correction to this ratio due to dust depletion. Interestingly, a tendency toward high values of [Si/Fe]333Observationally, [S/Si]=0 in gaseous absorbers when there is neither dust depletion nor ionization effects. has been found in other GRBs (Savaglio et al. 2003), as expected in cases where massive-star formation has recently deposited metals into the ISM.
We have examined the GRB 030323 spectra for presence of H2 absorption lines, but these are not detected (for a list of lines and their oscillator strengths, see Morton & Dinerstein 1976). The location of possible H2 lines at zabs=3.3716 is actually observed for the L=0 to 3 Lyman bands of H2. Of these, only the expected location of the L=2 band is clear of blending with Ly forest lines. Because of the low resolution of the spectra, two ranges of possible broadening parameters b (with b bmetals) were considered to perform trials of Voigt-profile fitting of both the J=0 and 1 lines (namely: H2 L2-0 R(0), L2-0 R(1) and L2-0 P(1)). We find the following upper limits: (1) for the range 10 km s-1 b 50 km s-1: log N(J=0)14.5 and log N(J=1)15.5, and (2) for the range 1 km s b 10 km s-1: log N(J=0)14 and log N(J=1)18. Therefore, strictly speaking the derived upper limit on the mean molecular fraction of the system (i.e. GRB environment + host galaxy) is: f 2N(H2)/(2N(H2)+N(H i)) 21018/(21018+7.91021) = 2.510-4 with N(H i)=7.91021 cm-2 (i.e. the above case 2). However, under the assumption that N(J=1)10N(J=0), as observed in H2-detected QSO-DLAs (Ledoux et al. 2003) and in the Magellanic Clouds (Tumlinson et al. 2002), i.e. taking log N(J=0)=14.5 and log N(J=1)=15.5 (which is actually the above case 1), f should be less than or of the order of 10-6. Although our spectra have a lower spectral resolution than those normally used to study DLA systems along QSO lines of sight, the large H i column density in GRB 030323 allowed us to obtain an upper limit which is similar to the limits found in QSO-DLAs. We also examined the GRB 030323 spectra for presence of absorption lines from vibrationally excited molecular hydrogen predicted by Draine & Hao (2002), but these are also not detected.
As shown by Ledoux et al. (2003), the lack of H2 molecules in DLA systems is mainly due to the low metallicity of the gas in addition to its particular physical conditions (density, temperature, UV flux). In particular, H2 is usually not detected whenever the metallicity [X/H]–1. In GRB 030323, the sulphur metallicity, [S/H]=–1.260.20, is low enough to explain the lack of H2. An alternative explanation is that H2 close to the GRB has been dissociated by the strong UV/X-ray emission; however such an emission would also ionize a large fraction of the gas with which H2 molecules are associated (see Draine & Hao 2002).

A dust depletion factor (i.e. the abundance difference between a dust-depleted element such as Fe or Cr and a non-depleted element such as Zn or S) of 0.2 dex at a metallicity of –1.26 (cf. [Fe/H]=–1.470.11) is also consistent with measurements in QSO-DLAs (see Fig. 12 of Ledoux et al. 2003). However, this result is different from the analysis of three GRB host galaxies by Savaglio et al. (2003), who find that the GRB host dust depletion is much larger than it is in QSO-DLAs.
In Fig. 6, we compare the metallicities (from Zn, S or Si) of a sample of QSO-DLAs taken from Prochaska et al. (2003a), with the GRB-DLAs for which a metallicity has been determined: GRB 000926 and GRB 030323 (this paper). For GRB 000926, we have adopted the value [Zn/H]=–0.25 of Castro et al. (2003), which is consistent with the curve-of-growth analysis value – [Zn/H]=–0.13 – of Savaglio et al. (2003). Since the neutral hydrogen column density determination for GRB 000926 is not secure (Fynbo et al. 2001), we assume an error of 0.3 dex. Although only two GRBs have measured metallicities, Fig. 6 suggests that GRB host galaxies are more metal rich than QSO-DLAs. Savaglio et al. (2003) already pointed out large Zn column densities in three GRB host galaxies (for which only GRB 000926 has a measured H i column density) with respect to QSO-DLAs, while they found the Fe column densities to be similar to those of QSO-DLAs. Hence, [Zn/Fe], a measure of the amount of dust depletion, is very large in their sample of GRB hosts with respect to QSO-DLAs, suggestive of a high dust content. Although we do not have an estimate of the Zn column density, the quantity [S/Fe] is a similar measure. For GRB 030323, we find [S/Fe]=0.2, while Prochaska et al. (2003b) find [S/Fe]=0.4 (based on three systems in their sample for which this quantity is not an upper or lower limit).
Using the measured metallicity and H i column density, we can check the low optical extinction that we inferred from the afterglow photometry. Following Prochaska & Wolfe (2002), we assume that AV=R N(H i)host/4.91021, where RAV/E(B-V) is the total-to-selective extinction; RV(MW)=3.1, RV(LMC)=3.2, and RV(SMC)=2.9 (see Pei 1992). The dust-to-gas ratio, =10[X/H](1-10[Fe/X]), corresponds to the dust-to-gas ratio of the dust responsible for the extinction. The value (4.90.3)1021 cm-2 mag-1 corresponds to the Galactic value for N(H i)/E(B-V) (Diplas & Savage 1994); for the LMC and SMC, we assume the values (2.00.5)1022 cm-2 mag-1 (Koornneef 1982) and (4.40.7)1022 cm-2 mag-1 (Bouchet et al. 1985), respectively. With [S/H]=–1.26 and [Fe/S]=–0.21, we find =0.02, and AV(MW)=0.08 mag, AV(LMC)=0.02 mag, and AV(SMC)=0.01 mag. These values are all consistent with the upper limits derived from the afterglow photometry (see Sect. 3).
As can be seen in Fig. 3, fine-structure lines of both C ii* and Si ii* are detected. The Si ii* lines have never been clearly detected in QSO-DLAs, which suggests that their origin is associated with GRB 030323, or that they can be found only in regions with very high neutral gas densities. Si ii* 1264 has also been observed along the GRB 010222 sightline (I. Salamanca, private communication). The population of the fine-structure levels is a function of the density of the absorbing medium and the ambient photon-flux intensity (Bahcall & Wolf 1968). Using the calculations of Silva & Viegas (2002), we can make a rough estimate of the H i volume density using the two un-saturated Si ii* lines 1309,1533 (the C ii* and Si ii* 1264 lines are saturated), for which we measure log N(Si ii*)14.5. Assuming that [Si ii/H]=[S ii/H], i.e. Si is undepleted onto dust grains, we obtain log N(Si ii)16.2 (as log N(S ii)=15.84 and the Solar abundance difference between S and Si is 0.34) and n3/2/n –1.7. This ratio corresponds to a volume density of n 100 cm-3 when the free electron density (ne) is assumed to be 10% of that of the H i density (n), and n cm-3 when n n (see Fig. 8 of Silva & Viegas 2002). If these fine-structure lines originate in the same region as the neutral hydrogen, then the Si ii* medium is mostly neutral and the free electrons will mainly come from ionization of neutral atoms with an ionization potential lower than 13.6 eV, whose solar abundance relative to hydrogen is typically 10-4 (see Silva & Viegas 2002). This would result in an expected ratio n n. We have assumed that the fine-structure levels are populated by collisions between particles, and not through direct excitation by infra-red photons (although this mechanism is probably not important in the case of Si ii*), or fluorescence (Silva & Viegas 2002). Under this assumption, we can divide the column density by the volume density to obtain an order of magnitude estimate of the size (diameter) of the absorbing region: 5pc (taking n cm-3). As a comparison, Galactic molecular cloud sizes range from roughly 0.5pc to 50pc (Solomon et al. 1987). Following Silva & Viegas (2002), we can also estimate the mass of the Si ii* absorbing cloud, (where is the proton mass and is the diameter of the Si ii* absorbing region) to be M⊙. However, the size and mass estimates would be upper limits if the Si ii* ions are only partly associated with the entire H i column and/or Si ii column. For instance, if half of the Si ii absorption would not be related to the Si ii* absorbing region, the actual volume density would be roughly twice as large, the corresponding cloud size twice as small and the mass a factor of four smaller. If, on the other hand, fluorescence plays a non-negligible role, the size and mass estimates above would be lower limits.
7 Ly in emission
As can be seen in Fig. 3, in the Ly trough Ly in emission is detected. Using splot within IRAF, we measured the center of the line at 5316.90.7Å, corresponding to =3.37360.0006, with a FWHM of 237 km s-1. The velocity offset with respect to the metal-absorption lines is +15146 km s-1, i.e. the Ly emitting region is red-shifted with respect to the material responsible for the absorption lines. We measured a Ly flux of F = (1.20.1)10-17 erg cm-2 s-1 in the 1400V spectrum. The emission line is also detected, albeit barely, in the lower resolution 300V spectrum with F = (1.00.3)10-17 erg cm-2 s-1. Assuming , = 0.3 and = 0.7, =3.372 corresponds to a luminosity distance of dL=91028 cm. This transforms the observed flux into a Ly luminosity of LLyα = (1.20.1)1042 erg s-1.
Adopting a relation between measured Ly luminosity and star-formation rate of L/SFR = 1042 erg s-1 per 1 M⊙ (Kennicutt 1998; Cowie & Hu 1998), the Ly star-formation rate in the GRB 030323 host galaxy is roughly 1.2 M⊙ yr-1. This value has not been corrected for extinction and hence is a lower limit. The Ly luminosity is roughly twice as large as the one obtained for the host of GRB 971214 at =3.42: (0.660.07)1042 erg s-1 (Kulkarni et al. 1998) but is at the low end of a sample of 10 Ly emitters found at by Cowie & Hu (1998) in and around the HDF and Hawaii deep field SSA 22 (with LLyα ranging from 1.2 to 81042 erg s-1). However, a deeper survey by Fynbo et al. (2003b) has resulted in 42 confirmed Ly emitting galaxies at , with most luminosities ranging from 0.4-21042 erg s-1.
Ly emission has also been observed in the troughs of half a dozen of QSO-DLAs (e.g. Møller & Warren 1993; Pettini et al. 1995; Djorgovski et al. 1996; Møller et al. 1998; Fynbo et al. 1999; Møller et al. 2002b). It is believed that this emission originates in the DLA host galaxy itself, and not in QSO photo-ionized regions when . In the GRB 030323 case, it is clear that the emission is produced by photo-ionization by massive stars (not necessarily related to the GRB) in the host galaxy. An origin in the immediate environment of the GRB is not possible, as this emission would be absorbed equally well as the afterglow continuum emission around Ly by the high neutral hydrogen column density along this sightline.
8 HST imaging of the host galaxy
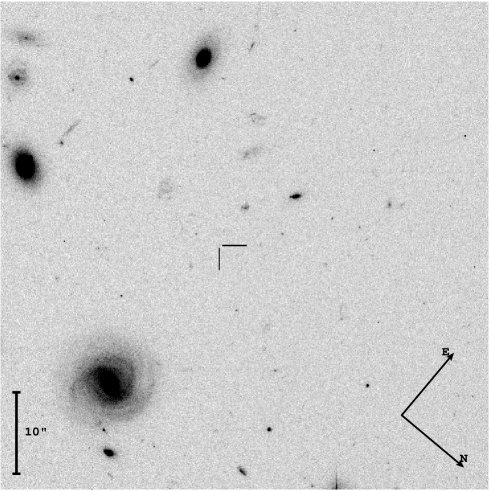
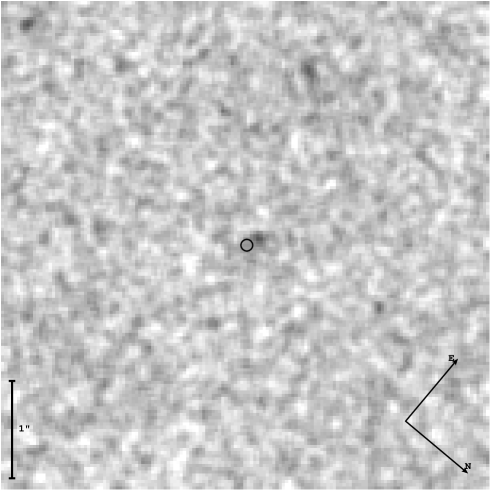
The field of GRB 030323 was observed for 4480s with HST/ACS in the F606W filter on July 20, 2003, starting at 23:00 UT. The dithered exposures were drizzled with the multidrizzle routine444see http://stsdas.stsci.edu/pydrizzle/multidrizzle to produce an output image with a scale of 0033 per pixel. Fig. 7 shows the 1′1′ field of GRB 030323 on the left panel, and on the right panel the central 5″5″ region. The close-up image has been convolved with a median filter of 3 by 3 pixels, excluding the central pixel of the kernel in the median calculation. The position of the early afterglow has been projected onto the HST image using the 3min FORS2 V-band image of March 26.35 (see Table 2); 8 objects were used to perform the transformation, with a resulting positional accuracy of 006. This error circle is shown on the zoomed image.
At 4.3 pixels, or 014, an extended object is detected, which can be identified as the probable host of GRB 030323. The Gaussian FWHM of the point spread function of this object (5.0 pixels) is significantly greater than that of stars in the field (2.8 pixels), and SExtractor (Bertin & Arnouts 1996) classifies it as a galaxy, with the star-galaxy classification flag equal to 0.03 (which normally is 0 for a definite galaxy and 1 for a definite star). Adopting H0=70 km s-1 Mpc-1, =0.3 and =0.7, 014 at corresponds to an angular diameter distance of 1 kpc (see Hogg 1999).
For the host galaxy, we measured a magnitude AB(F606W)=28.150.11 mag using SExtractor’s isophotal flux estimate (Bertin & Arnouts 1996), while we obtain AB(F606W)=28.10.2 mag with aperture photometry using an aperture radius of 5 pixels. With a 10-pixel aperture radius, the magnitude increases to AB(F606W)=27.8 mag. We adopted a zeropoint of 26.51 mag for the conversion of counts to AB magnitudes. The error estimates given above only include the Poisson errors. Assuming that the host galaxy has a flat spectrum in AB (i.e. =0 in F), the AB magnitude that we finally adopt: AB(F606W)=28.00.3 mag, is the same when converting it to the Johnson V band.
From the UV continuum emission of the host galaxy we can obtain another crude estimate of the star-formation rate, independent of the SFR inferred from Ly in emission (see Sect. 7). The magnitude AB(F606W)=28 mag corresponds to a flux Fν=2.3 erg s-1 cm-2 Hz-1, which at the luminosity distance of GRB 030323, dL=91028 cm, results in Lν=5.4 erg s-1 Hz-1. Using the SFR-Lν(1500-2800Å) relation of Kennicutt (1998), this transforms to a SFR(UV) of 0.7 M⊙ yr-1. We note that we have neglected Ly forest absorption at the blue end of the F606W filter (4700-7200Å, while Ly is at 5317Å), which would increase the SFR estimate by roughly 25% to around 0.9 M⊙ yr-1, which is very similar to the estimate from the Ly emission line (1.2 M⊙ yr-1).
9 Discussion
Our observations show that GRB 030323 occurred behind a very high H i column density, in an environment (immediate and host-galaxy combined) having a low molecular hydrogen fraction (f10-6), a low metallicity ([S/H]=–1.260.20) and a low dust content (=0.02). For the DLA host of GRB 020124, Hjorth et al. (2003a) also find evidence for a large H i column density with a low reddening. The inferred low dust content may be interpreted as a selection bias: GRBs that would occur in a dusty host galaxy would be harder to detect because they would then be fainter. However, in this case one would expect to observe many GRB afterglows with considerable extinction in the optical, for which there is no clear evidence (Galama & Wijers 2001; Lazzati et al. 2002a). In apparent contradiction with this is the detection of several host galaxies in the radio and sub-mm (e.g. Frail et al. 2002; Barnard et al. 2003; Berger et al. 2003), suggesting that at least some GRB hosts are dusty, as expected when most of the star formation in the universe occurs in submm-bright galaxies (see Ramirez-Ruiz et al. 2002). Dust destruction (e.g. Fruchter et al. 2001; Draine & Hao 2002; Perna et al. 2003), which has been proposed to account for the apparent discrepancy between the low optical extinction and large (X-ray) gas column densities (Galama & Wijers 2001), could play a role, but is not required by our data: the reduced metallicity and hence the low dust-to-gas ratio in the host of GRB 030323 is sufficient to explain the combination of a large H i column density with a low optical extinction (see also Hjorth et al. 2003a).
Ly in emission is detected for GRB 030323, and we inferred a star-formation rate of about 1 M⊙ yr-1, which is in good agreement with the SFR value that we obtained from the UV continuum emission of the host galaxy. Fynbo et al. (2003a) note that Ly is commonly observed in all GRB host galaxies at high redshift for which it could be detected. In contrast, only 25% of the Lyman-break galaxies are Ly emitters with an equivalent width EW 20 Å (Shapley et al. 2003). Fynbo et al. (2003a) suggest that this difference is due to GRB hosts having a low metallicity and a low dust content, consistent with our observations of GRB 030323 and with those of GRB 020124 (Hjorth et al. 2003a). We note that QSO-DLAs also have a low metallicity and a low dust content, but they rarely show Ly in emission. However, since most galaxy counterparts of QSO-DLAs are very faint, Ly in emission is not expected to be detected in most cases with the current detection limits (see Fynbo et al. 1999). The low-dust inference for GRB 020124 (Hjorth et al. 2003a) and GRB 030323 is different from the results of Savaglio et al. (2003), who find evidence for a high dust content in three GRB host galaxies.
From the fine-structure lines Si ii* 1309,1533 , we estimated the H i volume density of the gas producing this absorption: n cm-3, under the assumption that these fine-structure levels are populated by collisions, and not through direct excitation by infra-red photons (which is not an important excitation mechanism in the case of Si ii*), or fluorescence (see Silva & Viegas 2002). This volume density is higher than inferred for QSO-DLA environments (Silva & Viegas 2002), but typical of Galactic molecular clouds (e.g. Blitz & Williams 1999; Reichart & Price 2002). As these lines has never been clearly detected up to now in QSO-DLAs, the detection of these Siii* lines in the GRB 030323 spectrum suggests an origin in the vicinity of the GRB place of birth (e.g. the star-forming region in which it exploded). Combining the measured H i column density with the order of magnitude estimate of the H i volume density, we obtain a size (diameter) of 5pc (taking n cm-3) and a mass of 2103 M⊙ for the Si ii* absorbing region.
With the volume density so high, one would expect hydrogen molecules to be present, which, surprisingly, we do not detect. We obtain a rather strong upper limit on the mean molecular fraction of the gas in the GRB environment and the host galaxy: f2(H2)/(2(H2)+(H i))10-6. This could be explained by the low metallicity of the gas (see Ledoux et al. 2003), but it may also be that the molecules in the GRB environment have been dissociated by the strong GRB UV/X-ray emission (e.g. Draine & Hao 2002). In the latter case, however, the UV/X-ray flash would also ionize the neutral gas in the GRB vicinity (see Draine & Hao 2002), which would make the high H i column density detection improbable. Therefore, a large fraction of the H i column density may not be located close to the GRB explosion site, but elsewhere in the host galaxy, while the high volume density Si ii* region (and the expected molecular hydrogen), is located in the vicinity of the burst. In this case, the disks of GRB host galaxies need to be much denser than the Galactic disk, as 7 random sight lines through the disk toward the location of the Earth would not result in 5 H i column densities above 1021 cm-2 (see Fig. 5 of Dickey & Lockman 1990), as is observed for GRB sightlines (see Fig. 4). Finally, the population of the Si ii* levels may have been partly caused by fluorescence of photons from the GRB itself, in which case the volume density estimate above is a strict upper limit.
The H i column density that we inferred toward GRB 030323 is higher than that of any (QSO- or GRB-) DLA measured using Ly in absorption. It is generally assumed that the apparent H i column density limit of N(H i)1022 atoms cm-2 for QSO-DLAs is due to an observational bias against the detection of such high-column density systems, as these would obscure the background QSO if they contain some dust (e.g. Ostriker & Heisler 1984; Fall & Pei 1993). However, a radio-selected QSO survey for DLA systems by Ellison et al. (2001) did not uncover a previously unrecognized population of N(H i) cm-2 DLA systems in front of faint QSOs. An alternative scenario was proposed by Schaye (2001): the lack of high H i column density systems could be due to the conversion of H i to H2 as the neutral gas density increases. This picture is consistent with observations of Galactic molecular clouds (e.g. Blitz & Williams 1999). In GRB 030323, however, we do not find any evidence for the presence of H2 in addition to H i to support this scenario. Future GRBs with possibly even larger H i column densities than that toward GRB 030323 could provide further constraints to the existence of a rapid conversion of H i to H2 at high H i column densities.
We compared the metallicities and H i column densities of the (still very small) sample of GRB-DLAs with QSO-DLAs, and we found both quantities to be higher in GRB-DLAs than in QSO-DLAs. This is not surprising, as GRBs are now known to probe massive-star forming regions (Stanek et al. 2003; Hjorth et al. 2003b) where the gas density and the metallicity are higher than along random QSO sight lines through foreground galaxies. A KS test applied to the column densities shows that the probability that the GRB- and QSO-DLA samples are drawn from the same parent distribution is very low (0.0006). On the other hand, two GRB afterglows have very low column densities. A large sample of high-resolution spectra of GRB afterglows could provide statistical information about the distribution of the gas in high-redshift star-forming regions, in addition to the evolution of the metallicity and dust and H2 contents of GRB host galaxies. Such a sample can be created in the years to come thanks to rapid and accurate GRB localizations from future satellite missions such as Swift555see http://swift.gsfc.nasa.gov/ and EXIST666see http://exist.gsfc.nasa.gov/.
Acknowledgements.
We thank Sylvio Klose, Jochen Greiner and Martin Zwaan for helpful comments, and the referee, Sandra Savaglio, for an excellent report. We acknowledge benefits from collaboration within the Research Training Network ”Gamma-Ray Bursts: An Enigma and a Tool”, funded by the EU under contract HPRN-CT-2002-00294. ER acknowledges support from NWO grant nr. 614-51-003. JPUF gratefully acknowledges support from the Carlsberg Foundation. This work was supported by the Danish Natural Science Research Council (SNF). JMCC acknowledges the receipt of a FPI doctoral fellowship from Spain’s Ministerio de Ciencia y Tecnología. This publication makes use of data products from the Two Micron All Sky Survey, which is a joint project of the University of Massachusetts and the Infrared Processing and Analysis Center/California Institute of Technology, funded by the National Aeronautics and Space Administration and the National Science Foundation.References
- Akerlof et al. (1999) Akerlof, C., Balsano, R., Barthelemy, S., et al. 1999, Nature, 398, 400
- Andersen et al. (1999) Andersen, M. I., Castro-Tirado, A. J., Hjorth, J., et al. 1999, Science, 283, 2075
- Andersen et al. (2000) Andersen, M. I., Hjorth, J., Pedersen, H., et al. 2000, A&A, 364, L54
- Bahcall & Wolf (1968) Bahcall, J. N. & Wolf, R. A. 1968, ApJ, 152, 701
- Barnard et al. (2003) Barnard, V. E., Blain, A. W., Tanvir, N. R., et al. 2003, MNRAS, 338, 1
- Berger et al. (2003) Berger, E., Cowie, L. L., Kulkarni, S. R., et al. 2003, ApJ, 588, 99
- Bertin & Arnouts (1996) Bertin, E. & Arnouts, S. 1996, A&AS, 117, 393
- Blitz & Williams (1999) Blitz, L. & Williams, J. P. 1999, in NATO ASIC Proc. 540: The Origin of Stars and Planetary Systems, 3
- Boissé & Bergeron (1985) Boissé, P. & Bergeron, J. 1985, A&A, 145, 59
- Bouchet et al. (1985) Bouchet, P., Lequeux, J., Maurice, E., Prévot, L., & Prévot-Burnichon, M. L. 1985, A&A, 149, 330
- Castro et al. (2003) Castro, S., Galama, T. J., Harrison, F. A., et al. 2003, ApJ, 586, 128
- Cohen et al. (2003) Cohen, M., Wheaton, W. A., & Megeath, S. T. 2003, AJ, 126, 1090
- Cowie & Hu (1998) Cowie, L. L. & Hu, E. M. 1998, AJ, 115, 1319
- Cristiani et al. (1993) Cristiani, S., Giallongo, E., Buson, L. M., Gouiffes, C., & La Franca, F. 1993, A&A, 268, 86
- Curran et al. (2002) Curran, S. J., Webb, J. K., Murphy, M. T., et al. 2002, Publications of the Astronomical Society of Australia, 19, 455
- Dado et al. (2002) Dado, S., Dar, A., & De Rújula, A. 2002, A&A, 388, 1079
- Dado et al. (2003a) Dado, S., Dar, A., & De Rújula, A. 2003a, ApJ, 585, L15
- Dado et al. (2003b) Dado, S., Dar, A., & De Rújula, A. 2003b, ApJ, 594, L89
- Dai & Cheng (2001) Dai, Z. G. & Cheng, K. S. 2001, ApJ, 558, L109
- Dickey & Lockman (1990) Dickey, J. M. & Lockman, F. J. 1990, ARA&A, 28, 215
- Diplas & Savage (1994) Diplas, A. & Savage, B. D. 1994, ApJ, 427, 274
- Djorgovski et al. (1996) Djorgovski, S. G., Pahre, M. A., Bechtold, J., & Elston, R. 1996, Nature, 382, 234
- Draine & Hao (2002) Draine, B. T. & Hao, L. 2002, ApJ, 569, 780
- Ellison et al. (2001) Ellison, S. L., Yan, L., Hook, I. M., et al. 2001, A&A, 379, 393
- Fall & Pei (1993) Fall, S. M. & Pei, Y. C. 1993, ApJ, 402, 479
- Frail et al. (2002) Frail, D. A., Bertoldi, F., Moriarty-Schieven, G. H., et al. 2002, ApJ, 565, 829
- Fruchter et al. (2001) Fruchter, A., Krolik, J. H., & Rhoads, J. E. 2001, ApJ, 563, 597
- Fynbo et al. (2001) Fynbo, J. P. U., Gorosabel, J., Møller, P., et al. 2001, in Lighthouses of the Universe: The Most Luminous Celestial Objects and Their Use for Cosmology, Proc. of the MPA/ESO/MPE/USM Joint Astronomy Conf., eds. M. Gilfanov, R. Sunyaev, & E. Churazov (Garching: Springer), p.187; preprint astro-ph/0110603
- Fynbo et al. (2003a) Fynbo, J. P. U., Jakobsson, P., Møller, P., et al. 2003a, A&A, 406, L63
- Fynbo et al. (2003b) Fynbo, J. P. U., Ledoux, C., Møller, P., Thomsen, B., & Burud, I. 2003b, A&A, 407, 147
- Fynbo et al. (1999) Fynbo, J. P. U., Møller, P., & Warren, S. J. 1999, MNRAS, 305, 849
- Galama et al. (1998a) Galama, T. J., Groot, P. J., Van Paradijs, J., et al. 1998a, ApJ, 497, L13
- Galama et al. (1998b) Galama, T. J., Vreeswijk, P. M., Van Paradijs, J., et al. 1998b, Nature, 395, 670
- Galama & Wijers (2001) Galama, T. J. & Wijers, R. A. M. J. 2001, ApJ, 549, L209
- Garnavich et al. (2000) Garnavich, P. M., Loeb, A., & Stanek, K. Z. 2000, ApJ, 544, L11
- Gilmore et al. (2003) Gilmore, A., Kilmartin, P., & Henden, A. 2003, GRB Circular Network, 1949
- Granot et al. (2003) Granot, J., Nakar, E., & Piran, T. 2003, Nature, 426, 138
- Graziani et al. (2003) Graziani, C., Shirasaki, Y., Matsuoka, M., et al. 2003, GRB Circular Network, 1956
- Greiner et al. (2003) Greiner, J., Peimbert, M., Estaban, C., et al. 2003, GRB Circular Network, 2020
- Grevesse & Sauval (1998) Grevesse, N. & Sauval, A. J. 1998, Space Science Reviews, 85, 161
- Haehnelt et al. (1998) Haehnelt, M. G., Steinmetz, M., & Rauch, M. 1998, ApJ, 495, 647
- Henden (2003) Henden, A. 2003, GRB Circular Network, 1948
- Hjorth et al. (2003a) Hjorth, J., Møller, P., Gorosabel, J., et al. 2003a, ApJ, 597, 699
- Hjorth et al. (2003b) Hjorth, J., Sollerman, J., Møller, P., et al. 2003b, Nature, 423, 847
- Hogg (1999) Hogg, D. W. 1999, astro-ph/9905116
- Holland et al. (2003) Holland, S. T., Weidinger, M., Fynbo, J. P. U., et al. 2003, AJ, 125, 2291
- Jensen et al. (2001) Jensen, B. L., Fynbo, J. P. U., Gorosabel, J., et al. 2001, A&A, 370, 909
- Kennicutt (1998) Kennicutt, R. C. 1998, ARA&A, 36, 189
- Koornneef (1982) Koornneef, J. 1982, A&A, 107, 247
- Kulkarni et al. (1998) Kulkarni, S. R., Djorgoski, S. G., Ramaprakash, A. N., et al. 1998, Nature, 393, 35
- Kulkarni et al. (1999) Kulkarni, S. R., Djorgovski, S. G., Odewahn, S. C., et al. 1999, Nature, 398, 389
- Lanzetta et al. (1991) Lanzetta, K. M., McMahon, R. G., Wolfe, A. M., et al. 1991, ApJS, 77, 1
- Lazzati et al. (2002a) Lazzati, D., Covino, S., & Ghisellini, G. 2002a, MNRAS, 330, 583
- Lazzati et al. (2002b) Lazzati, D., Rossi, E., Covino, S., Ghisellini, G., & Malesani, D. 2002b, A&A, 396, L5
- Ledoux et al. (1998) Ledoux, C., Petitjean, P., Bergeron, J., Wampler, E. J., & Srianand, R. 1998, A&A, 337, 51
- Ledoux et al. (2003) Ledoux, C., Petitjean, P., & Srianand, R. 2003, MNRAS, 346, 209
- Li & Chevalier (2001) Li, Z. & Chevalier, R. A. 2001, ApJ, 551, 940
- Lopez & Ellison (2003) Lopez, S. & Ellison, S. L. 2003, A&A, 403, 573
- MacFadyen & Woosley (1999) MacFadyen, A. I. & Woosley, S. E. 1999, ApJ, 524, 262
- Masetti et al. (2000) Masetti, N., Bartolini, C., Bernabei, S., et al. 2000, A&A, 359, L23
- Møller et al. (2002a) Møller, P., Fynbo, J. P. U., Hjorth, J., et al. 2002a, A&A, 396, L21
- Møller & Warren (1993) Møller, P. & Warren, S. J. 1993, A&A, 270, 43
- Møller et al. (2002b) Møller, P., Warren, S. J., Fall, S. M., Fynbo, J. P. U., & Jakobsen, P. 2002b, ApJ, 574, 51
- Møller et al. (1998) Møller, P., Warren, S. J., & Fynbo, J. P. U. 1998, A&A, 330, 19
- Morton & Dinerstein (1976) Morton, D. C. & Dinerstein, H. L. 1976, ApJ, 204, 1
- Oke & Korycansky (1982) Oke, J. B. & Korycansky, D. G. 1982, ApJ, 255, 11
- Ostriker & Heisler (1984) Ostriker, J. P. & Heisler, J. 1984, ApJ, 278, 1
- Pei (1992) Pei, Y. C. 1992, ApJ, 395, 130
- Perna et al. (2003) Perna, R., Lazzati, D., & Fiore, F. 2003, ApJ, 585, 775
- Perna & Loeb (1998) Perna, R. & Loeb, A. 1998, ApJ, 503, L135
- Petitjean et al. (2000) Petitjean, P., Srianand, R., & Ledoux, C. 2000, A&A, 364, L26
- Pettini et al. (1995) Pettini, M., Hunstead, R. W., King, D. L., & Smith, L. J. 1995, in QSO Absorption Lines, Proceedings of the ESO Workshop Held at Garching, Germany, 21 - 24 November 1994, edited by Georges Meylan. Springer-Verlag Berlin Heidelberg New York. Also ESO Astrophysics Symposia, 1995., p.55
- Press et al. (1992) Press, W. H., Teukolsky, S. A., Vetterling, W. T., & Flannery, B. P. 1992, Numerical recipes in FORTRAN. The art of scientific computing (Cambridge: University Press, —c1992, 2nd ed.)
- Price et al. (2003) Price, P. A., Fox, D. W., Kulkarni, S. R., et al. 2003, Nature, 423, 844
- Prochaska et al. (2003a) Prochaska, J. X., Gawiser, E., Wolfe, A. M., Castro, S., & Djorgovski, S. G. 2003a, ApJ, 595, L9
- Prochaska et al. (2003b) Prochaska, J. X., Gawiser, E., Wolfe, A. M., Cooke, J., & Gelino, D. 2003b, ApJS, 147, 227
- Prochaska & Wolfe (1997) Prochaska, J. X. & Wolfe, A. M. 1997, ApJ, 487, 73
- Prochaska & Wolfe (2002) Prochaska, J. X. & Wolfe, A. M. 2002, ApJ, 566, 68
- Ramaprakash et al. (1998) Ramaprakash, A. N., Kulkarni, S. R., Frail, D. A., et al. 1998, Nature, 393, 43
- Ramirez-Ruiz et al. (2002) Ramirez-Ruiz, E., Trentham, N., & Blain, A. W. 2002, MNRAS, 329, 465
- Reichart & Price (2002) Reichart, D. E. & Price, P. A. 2002, ApJ, 565, 174
- Sari et al. (1999) Sari, R., Piran, T., & Halpern, J. P. 1999, ApJ, 519, L17
- Sari et al. (1998) Sari, R., Piran, T., & Narayan, R. 1998, ApJ, 497, L17
- Savaglio et al. (2003) Savaglio, S., Fall, S. M., & Fiore, F. 2003, ApJ, 585, 638
- Schaye (2001) Schaye, J. 2001, ApJ, 562, L95
- Schlegel et al. (1998) Schlegel, D. J., Finkbeiner, D. P., & Davis, M. 1998, ApJ, 500, 525
- Shapley et al. (2003) Shapley, A. E., Steidel, C. C., Pettini, M., & Adelberger, K. L. 2003, ApJ, 588, 65
- Silva & Viegas (2002) Silva, A. I. & Viegas, S. M. 2002, MNRAS, 329, 135
- Solomon et al. (1987) Solomon, P. M., Rivolo, A. R., Barrett, J., & Yahil, A. 1987, ApJ, 319, 730
- Stanek et al. (2003) Stanek, K. Z., Matheson, T., Garnavich, P. M., et al. 2003, ApJ, 591, L17
- Steidel & Sargent (1992) Steidel, C. C. & Sargent, W. L. W. 1992, ApJS, 80, 1
- Tumlinson et al. (2002) Tumlinson, J., Shull, J. M., Rachford, B. L., et al. 2002, ApJ, 566, 857
- Turnshek et al. (1989) Turnshek, D. A., Wolfe, A. M., Lanzetta, K. M., et al. 1989, ApJ, 344, 567
- Van Dokkum (2001) Van Dokkum, P. G. 2001, PASP, 113, 1420
- Viegas (1995) Viegas, S. M. 1995, MNRAS, 276, 268
- Vladilo et al. (2001) Vladilo, G., Centurión, M., Bonifacio, P., & Howk, J. C. 2001, ApJ, 557, 1007
- Vreeswijk et al. (2003) Vreeswijk, P., Wijers, R., Rol, E., & Hjorth, J. 2003, GRB Circular Network, 1953
- Vreeswijk et al. (2001) Vreeswijk, P. M., Fruchter, A., Kaper, L., et al. 2001, ApJ, 546, 672
- Wolfe (1987) Wolfe, A. M. 1987, in 13th Texas Symposium on Relativistic Astrophysics, 309–313
- Wolfe et al. (1995) Wolfe, A. M., Lanzetta, K. M., Foltz, C. B., & Chaffee, F. H. 1995, ApJ, 454, 698
- Wolfe et al. (1986) Wolfe, A. M., Turnshek, D. A., Smith, H. E., & Cohen, R. D. 1986, ApJS, 61, 249
- Woosley (1993) Woosley, S. E. 1993, ApJ, 405, 273