Multiresolution approach for period determination on unevenly sampled data
Abstract
In this paper we present a multiresolution-based method for period determination that is able to deal with unevenly sampled data. This method allows us to detect superimposed periodic signals with lower signal-to-noise ratios than in classical methods. This multiresolution-based method is a generalization of the wavelet-based method for period detection that is unable to deal with unevenly sampled data, presented by the authors in Otazu et al. (2002). This new method is a useful tool for the analysis of real data and, in particular, for the analysis of astronomical data.
keywords:
methods: data analysis – methods: numerical – stars: variables: other – X-rays: binaries.1 Introduction
The detection of periodic signals in astronomical data has been usually addressed by classical Fourier-based or epoch folding methods. These methods have different problems when dealing with non-sinusoidal periodic signals or with very low signal-to-noise ratios. When the analysed data set contains several periodic signals, the behavior of classical period determination methods highly depends on intrinsic signal characteristics (see, for example, Lafler & Kinman 1965; Jurkevich 1971; Stellingwerf 1978; Lomb 1976; Scargle 1982, 1989; Roberts, Lehár & Dreher 1987; Press & Rybicky 1989). The reader is referred to the introduction of Otazu et al. (2002) (hereafter Paper I) for a general discussion. To avoid this problem, we presented there, as a preliminary step, a wavelet-based approach that only works with evenly time sampled data.
In astronomy, however, this is not a usual situation, since data are mostly acquired on irregular intervals of time. In such a case there are two possibilities: resample the data into a new evenly sampled data set, or use a method able to deal with the original unevenly sampled data set. In the first case we are forced to modify the original data, which necessarily implies a loss of information. Moreover, this is not always possible if the temporal gaps are larger than some of the periods present in the data. In order to avoid these problems, a technique capable to deal with unevenly sampled data is needed.
The present paper is a natural extension of Paper I that allows to work on unevenly time sampled data. We show how the methodology of multiresolution decomposition (similar to the wavelet decomposition philosophy) is very well suited to this problem, since it is completely oriented towards decomposing functions into several frequential characteristics.
As in Paper I, the main objective is to isolate every signal present in our data and to analyse them separately, avoiding their mutual influences. In Section 2 we outline some concepts in multiresolution analysis and their similarities with wavelet theory that are relevant to the stated problem. In Section 3 we propose an algorithm to detect each of the periodic signals present in a data set by combining multiresolution analysis decomposition with classical period determination methods. In Sections 4 and 5 we present some examples of synthetic data we used to test the algorithm and the results we obtained. We summarise our conclusions in Section 6.
2 Multiresolution analysis
Multiresolution decomposition introduces the concept of the presence of details between successive levels of resolution. Many wavelet decomposition algorithms are based on multiresolution analysis schemes (Chui 1992; Daubechies 1992; Meyer 1993; Kaiser 1994; Vetterli & Kovacevic 1995; Mallat 1999; Starck & Murtagh 2002), and some astronomical applications using wavelets for timing analysis have been reported (Szatmáry, Vinkó & Gál 1994; Foster 1996; Ribó et al. 2001; Polygiannakis, Preka-Papadema & Moussas 2003). In fact, all these methods use the same philosophy and the obtained results can be interpreted in the same way. However, wavelet theory presents some constraints on mathematical functions. These constraints are not respected in all multiresolution decomposition schemes. Therefore, when we are using a certain multiresolution decomposition algorithm that fulfills the wavelet constraints, we are obtaining a wavelet decomposition. In contrast, when a given multiresolution decomposition algorithm violates these wavelet constraints, we are obtaining a result similar to, but which is not, a wavelet decomposition.
As discussed in Paper I, we note that there are wavelet approaches that are based on approximations of a continuous wavelet transform and on the subsequent study of wavelet space coefficients (see, e.g., Szatmáry et al. 1994), which are able to deal with unevenly sampled data sets. However, these algorithms present a non-direct inverse wavelet transform, in the sense that the search for periodicities is based on the fit between the wavelet base function profile and the signal one, and therefore on the values of the wavelet transform coefficients, which highly depend on the wavelet base used. Moreover, the period analysis has to be performed on the wavelet coefficients space but, since it is usually decimated, accurate period detection is a difficult task. The multiresolution decomposition scheme we use in this work performs the decomposition on the temporal space, which allows to find accurate values for periodicities.
2.1 A multiresolution analysis algorithm
In order to obtain a multiresolution decomposition for signals, an algorithm to decompose the signal into frequency planes can be defined as follows. Given a signal we construct the sequence of approximations:
| (1) |
performing successive convolutions with Gaussian filters .
It is important to note the difference between this sequence of convolutions and the one used in Paper I. In the latter we were dealing with a discrete convolution mask, and hence forced to work with evenly spaced data. In contrast, the continuous nature of the convolution functions used in the present paper, allows us to work with unevenly sampled data.
Similarly to the wavelet planes, the multiresolution frequency planes are computed as the differences between two consecutive approximations and . Letting , in which , we can write the reconstruction formula:
| (2) |
In this representation, the signals are versions of the original signal at increasing scales (decreasing resolution levels), are the multiresolution frequency planes and is a residual signal (in fact , but we explicitly substitute by to clearly express the concept of ). In our case, we are using a dyadic decomposition scheme. This means that the standard deviation of the Gaussian function associated with the filter is . Thus, similarly to the wavelet approach, the original signal has double resolution compared to , and so on. All these signals have the same number of data points as the original signal .
Since depends on , a value for has to be carefully chosen for every data set. It has to be fixed considering a likely minimum value for the time-duration of the features and the characteristic time sampling of the data set, in order to include a significant number of points on which to perform the convolutions. Too small values do not accurately describe feature profiles, and suffer from poor or noisy data. In contrast, too large values reduce the noise effect by integrating a lot of data points, but may ignore interesting high frequency features. Hence, a first analysis of data has to be performed in order to obtain a useful initial value.
We have used the same notation as in the wavelet decomposition described in Paper I because, as explained above, the idea of these multiresolution planes is similar to the wavelet ones.
We note that this particular decomposition scheme that uses a Gaussian kernel can also be interpreted as a scale-space filtering (Baubaud et al. 1986, Sporring et al. 1997, Witkin 1994) or as a particular case of more general image diffusion approaches (Lindeberg 1990, Perona & Malik 1990). Smoothed data sets can be interpreted as diffused scale-space images, and the difference between them as the details at different scales.
3 Period detection algorithm
We propose to apply this multiresolution analysis algorithm to solve our initially stated problem: to isolate each of the periodic signals contained in a set of unevenly sampled data and study them separately.
In order to do so, we proceed as in Paper I, and the period detection algorithm we propose is as follows:
-
1.
choose values for and ; decompose the original signal into its multiresolution frequency planes .
-
2.
detect periods in each of the obtained frequency planes .
Phase Dispersion Minimization (PDM) (Stellingwerf, 1978) and CLEAN (Roberts et al., 1987) methods are used to detect periods in the original data and in every multiresolution frequency plane. In Paper I we described several undesirable effects of PDM and CLEAN methods on data with superimposed signals, as well as the advantages of using multiresolution-based methods over the classical ones.
Hereafter, and for notational convenience, the multiresolution-based PDM and CLEAN methods will be called MRPDM and MRCLEAN, respectively.
4 Simulated data
In order to check the benefit of applying MRPDM versus PDM, or MRCLEAN versus CLEAN, we proceeded similarly as in Paper I by generating and analysing several sets of simulated data containing two superimposed periodic signals. Each data set is composed of a high-amplitude primary sinusoidal function and a secondary low-amplitude Gaussian one. Finally, we added a white-Gaussian noise to this combination of signals. We increased the value of the noise standard deviation, , up to the value where detection of periodic signals became statistically insignificant in both the classical and the multiresolution-based methods.
The primary signal is intended to simulate variable sources with a pure sinusoidal intensity profile (like precession of accretion discs), and the secondary, burst-like events (like pulses or eclipses) superimposed to it. We note that in Paper I we also studied the superposition of two sinusoidal functions, the so called sine+sine case. However, here we have directly focused on the more realistic situation of the so called sine+Gaussian case, where the difference between the classical and the multiresolution-based methods is more critical (see Paper I).
The characteristics of the signals are:
-
1.
Each signal is generated as an unevenly spaced data set. Its time sampling has been taken from observations of the X-ray binary LMC X-1 by the All Sky Monitor onboard the RXTE satellite (Levine et al. 1996). We have used an observation period which has 8270 measurements during 679 days.
-
2.
The high-amplitude sinusoidal function has an amplitude equal to 1 and a period of 108.5 days.
-
3.
The amplitudes of the low-amplitude periodic Gaussian function are 0.1 and 0.5.
-
4.
The periods used for the secondary function are 13.13 and 23.11 days.
-
5.
We have used two values for the full width at half-maximum (FWHM) of the Gaussian signal, corresponding to 2 and 6 days, respectively.
In the first four columns of Table 1 we present the parameters used to generate each simulated data set.
5 Results
We recall that the simultaneous use of two independent methods, such as CLEAN and PDM, is usually applied to discriminate false period detections from the true ones. A similar procedure can be used with each one of the multiresolution planes in the MRPDM and MRCLEAN methods. Therefore, when comparing the behavior of these different methods, we have to compare the usual PDM-CLEAN method combination for period estimation prior to the new MRPDM-MRCLEAN combination.
Taking into account the characteristics of the simulated data we have chosen a day. As in Paper I, the primary period (108.5 days) is always detected by all methods, and does not appear in Table 1. In this table, the four last columns show the detected low-amplitude periods for each data set using PDM, CLEAN, MRPDM and MRCLEAN methods, respectively. A dash is shown when a period is not detected, and a question mark when the detection is difficult or doubtful. When a period is found in the multiresolution-based methods, we also show in parentheses the mutiresolution planes where it is detected.
| FWHM | Period | Amplitude | PDM | CLEAN | MRPDM | MRCLEAN | |
|---|---|---|---|---|---|---|---|
| 2 | 13.13 | 0.1 | 0.0 | - | 13.13 | 13.13 (1,2) | 13.13 (1,2) |
| 0.1 | - | 13.13 | 13.13 (1,2) | 13.13 (1,2) | |||
| 0.15 | - | 13.13 | 13.13 (1?,2) | 13.13 (1?,2) | |||
| 0.2 | - | 13.15? | 13.13 (1?,2) | 13.13 (2) | |||
| 0.25 | - | - | 13.14 (1?,2) | - | |||
| 0.3 | - | - | 13.14 (2) | - | |||
| 0.35 | - | - | 13.14 (2?) | - | |||
| 0.4 | - | - | - | - | |||
| 0.5 | 0.0 | - | 13.13 | 13.13 (1,2,3) | 13.13 (1,2,3) | ||
| 0.5 | - | 13.13 | 13.13 (1?,2,3) | 13.13 (1?,2,3) | |||
| 1.0 | - | 13.14? | 13.13 (2,3) | 13.13 (2,3) | |||
| 2.0 | - | - | 13.14 (2,3) | 13.14 (3?) | |||
| 2.25 | - | - | 13.14 (2?) | - | |||
| 2.5 | - | - | - | - | |||
| 23.11 | 0.1 | 0.0 | - | 23.13 | 23.11 (1,2?) | - | |
| 0.1 | - | 23.19 | 23.11 (2?) | - | |||
| 0.15 | - | - | - | - | |||
| 0.5 | 0.0 | - | 23.12 | 23.11 (2?,3,4) | 23.11 (3?) | ||
| 0.5 | - | 23.11? | 23.11 (2?,3,4) | - | |||
| 1.0 | - | - | 23.11 (2?,3,4) | - | |||
| 1.25 | - | - | 23.11 (2?,3,4) | - | |||
| 1.5 | - | - | - | - | |||
| 6 | 13.13 | 0.1 | 0.0 | - | 13.13 | 13.13 (1,2,3) | 13.13 (1,2,3) |
| 0.1 | - | 13.14 | 13.13 (1,2,3) | 13.13 (1,2,3) | |||
| 0.2 | - | 13.14 | 13.13 (1?,2,3) | 13.13 (1?,2,3) | |||
| 0.3 | - | 13.14 | 13.13 (2,3) | 13.13 (2,3) | |||
| 0.4 | - | 13.15? | 13.14 (2,3) | 13.14 (3) | |||
| 0.6 | - | - | 13.14 (2,3) | 13.14 (3?) | |||
| 0.8 | - | - | 13.15 (3) | 13.15 (3?) | |||
| 0.9 | - | - | - | - | |||
| 0.5 | 0.0 | 13.13 | 13.13 | 13.13 (1,2,3) | 13.13 (1,2,3) | ||
| 0.5 | 13.13 | 13.12 | 13.13 (1,2,3) | 13.13 (1,2,3) | |||
| 1.0 | 13.13 | 13.14 | 13.13 (1?,2,3) | 13.13 (1?,2,3) | |||
| 2.0 | 13.13 | 13.13 | 13.13 (2,3) | 13.13 (2,3) | |||
| 3.0 | 13.13? | 13.11? | 13.13 (2?,3) | 13.13 (3) | |||
| 4.0 | - | - | - | - | |||
| 23.11 | 0.1 | 0.0 | - | 23.12 | 23.11 (2,3) | 23.11 (2,3) | |
| 0.1 | - | 23.12 | 23.11 (2,3) | 23.11 (2,3) | |||
| 0.2 | - | 23.12 | 23.11 (2?,3) | 23.11 (2?,3) | |||
| 0.3 | - | 23.12 | 23.11 (3) | 23.11 (3) | |||
| 0.4 | - | 23.12? | 23.11 (3?) | 23.11 (3) | |||
| 0.5 | - | - | 23.11 (3?) | - | |||
| 0.6 | - | - | - | - | |||
| 0.5 | 0.0 | 23.11 | 23.11 | 23.11 (2?,3,4,5) | 23.11 (3?,4,5) | ||
| 0.5 | 23.11 | 23.11 | 23.11 (2?,3,4,5) | 23.11 (4,5) | |||
| 1.0 | 23.11 | 23.11 | 23.11 (3,4,5) | 23.11 (4,5?) | |||
| 2.0 | 23.11? | 23.12 | 23.11 (3?,4,5) | 23.11 (4,5?) | |||
| 2.5 | 23.11? | 23.12 | 23.11 (4,5?) | 23.11 (4,5?) | |||
| 3.0 | - | - | 23.12 (4) | 23.11 (4) | |||
| 3.5 | - | - | 23.12 (4?) | - | |||
| 4.0 | - | - | - | - |
We must note that the use of two different FWHM for the Gaussian, combined with two different periods (13.13 and 23.11 days), gives 4 different profiles. Hence, the phase duration of the burst-like event ranges from very low to relatively high values in the following order: FWHM=2 and period=23.11, FWHM=2 and period=13.13, FWHM=6 and period=23.11, and finally FWHM=6 and period=13.13.
In view of the results displayed in Table 1 we can make the following comments:
-
1.
In all methods, with high noise-to-signal ratios the detected periods are slightly different from the simulated ones.
-
2.
There is a better performance of CLEAN over PDM. We must note that when the FWHM is only 2 days, PDM never detects the secondary period. Only with FWHM=6 days and a relatively high amplitude (0.5), can PDM detect the low-amplitude periodic signals.
-
3.
As the noise increases, the detection starts to fail in the lower multiresolution planes (higher frequencies), and only the higher ones (lower frequencies) are noise-free enough to allow period detection.
-
4.
MRPDM and MRCLEAN perform better or similar than PDM and CLEAN methods (see exception below). When CLEAN marginally detects the secondary period, MRPDM and most of times MRCLEAN have no problems to detect it, and they work properly even with higher noise. In the MRPDM case, the results are always better than with PDM.
-
5.
In all cases with FWHM=2, the MRPDM performance is much better than MRCLEAN, because the signal is clearly non-sinusoidal. In the FWHM=6 cases, MRPDM is only slightly better than MRCLEAN, since the signals are closer to a sinusoidal profile.
-
6.
For a given amplitude of the Gaussian signal, the maximum noise-to-signal ratio achieved with MRPDM and MRCLEAN increases with the phase duration of the FWHM.
The only exception to 4 is for the most extreme of the simulated cases, i.e., the one with the lower amplitude, lower FWHM value and longer period. However, we note that the period detected by CLEAN is slightly different than the simulated one.
All these results are very similar to those shown in Table 2 of Paper I. Nevertheless the maximum noise-to-signal ratios achieved in the present cases are around 2.5 times higher. This can be explained because, although the time span of the data sets used here is around 1.5 times smaller, the number of points per unit time is around 12 times higher than in Paper I.
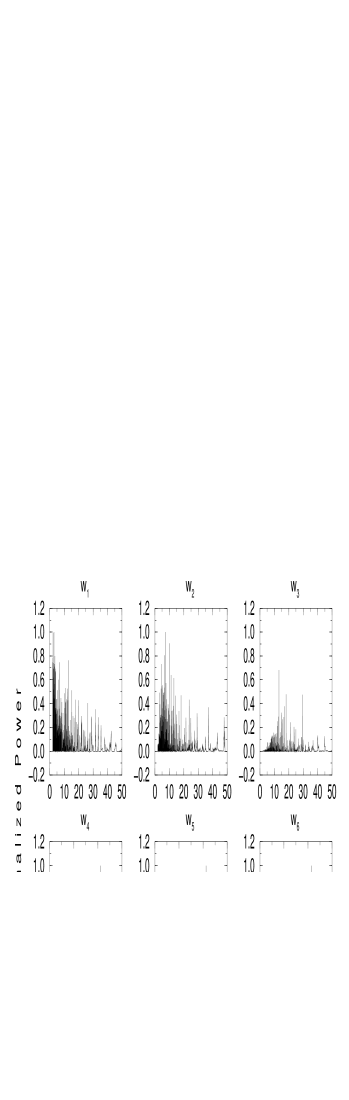
Finally, and for illustrative purposes, we show in Fig. 1 the simulated data set generated with the following: 13.13-day period, FWHM=6.0 days and amplitude=0.1 with . The outputs of PDM and CLEAN, are also shown. None of these methods is able to detect the 13.13-day period. We show in Fig. 2 the outputs from MRPDM. The simulated period is detected, with its corresponding subharmonics, in the multiresolution planes and . The MRCLEAN outputs, shown in Fig. 3, reveal a marginal detection of the 13.13-day period in multiresolution plane . We note that we would not consider this detection as a true one when taken alone. However, since the same period is clearly detected in two multiresolution planes of MRPDM, we can establish the existence of this period in the analysed data set.


6 Conclusions
In this paper we have presented a multiresolution-based method for period determination able to deal with unevenly sampled data. This constitutes a significant improvement with respect to the wavelet-based method presented in Paper I, which is unable to deal with unevenly sampled data. The overall performance of the present method is similar to the wavelet-based one, in the sense that it allows us to detect superimposed periodic signals with lower signal-to-noise ratios than in classical methods. We stress that one advantage of the present method over classical methods is the simultaneous detection of a period in more than one multiresolution plane, allowing to improve the confidence of a given detection. Moreover, since here we are not forced to lose or modify the information when averaging or interpolating the original data, we can reach higher noise-to-signal ratios than in the wavelet-based method described in Paper I.
We note that the multiresolution decomposition scheme that we have used can be interpreted as a particular case of scale-space filtering. In order to improve isolation of periodic features, more general approaches could be used to perform this decomposition. In this context, anisotropic diffusion schemes proposed by Perona & Malik (1990) could be useful if properly tuned.
Acknowledgments
We thank useful comments and suggestions from an anonymous referee. We acknowledge partial support by DGI of the Ministerio de Ciencia y Tecnología (Spain) under grant AYA2001-3092, as well as partial support by the European Regional Development Fund (ERDF/FEDER). This research has made use of facilities of CESCA and CEPBA, coordinated by C4 (Centre de Computació i Comunicacions de Catalunya). XO is a researcher of the programme Ramón y Cajal funded by the Spanish Ministery of Science and Technology and Centre de Visió per Computador. MR acknowledges support by a Marie Curie Fellowship of the European Community programme Improving Human Potential under contract number HPMF-CT-2002-02053. MP is a researcher of the programme Ramón y Cajal funded by the Spanish Ministery of Science and Technology and Universitat de Girona.
References
- Baubaud et al. (1986) Baubaud J., Witkin A., Baudin M., Duda R.O., 1986, IEEE Trans. Pattern Anal. Mach. Intell. PAMI-8, 26
- Chui (1992) Chui C.K., 1992, An Introduction to Wavelets, Boston Ac. Press, Boston
- Daubechies (1992) Daubechies I., 1992, Ten Lectures on Wavelets, SIAM Press, Philadelphia
- Foster (1996) Foster G., 1996, AJ, 112, 1709
- Jurkevich (1971) Jurkevich I., 1971, Ap&SS, 13, 154
- Kaiser (1994) Kaiser G., 1994, A Friendly Guide to Wavelets, Birkhäuser, Berlin
- Lafler & Kinman (1965) Lafler J., Kinman T.D., 1965, ApJS, 11, 216
- Levine et al. (1996) Levine A.M., Bradt H., Cui W., Jernigan J.G., Morgan E.H., Remillard R., Shirey R.E., Smith D.A., 1996, ApJ, 469, L33
- Lindeberg (1990) Lindeberg T., 1990, IEEE Trans. Pattern Anal. and Mach. Intell., 12, 234
- Lomb (1976) Lomb N.R., 1976, Ap&SS, 39, 447
- Mallat (1999) Mallat S., 1999, A Wavelet Tour of Signal Processing, 2nd ed., Academic Press, San Diego
- Meyer (1993) Meyer Y., 1993, Wavelets. Algorithm and Applications, SIAM Press, Philadelphia
- Otazu et al. (2002) Otazu X., Ribó M., Peracaula M., Paredes J.M., Núñez J., 2002, MNRAS, 333, 365 (Paper I)
- Perona & Malik (1990) Perona P., Malik J., 1990, IEEE Trans. Pattern Anal. and Mach. Intell., 12, 629
- Polygiannakis, Preka-Papadema & Moussas (2003) Polygiannakis J., Preka-Papadema P., Moussas X., 2003, MNRAS, 343, 725
- Press & Rybicky (1989) Press W.H., Rybicky G.B., 1989, ApJ, 338, 277
- Ribó et al. (2001) Ribó M., Peracaula M., Paredes J.M., Núñez J., Otazu X., 2001, in Giménez A., Reglero V., Winkler C., eds, Proc. Fourth INTEGRAL Workshop, Exploring the Gamma-Ray Universe. ESA Publications Division, Noordwijk, p. 333
- Roberts et al. (1987) Roberts D.H., Lehár J., Dreher J.W., 1987, AJ, 93, 968
- Scargle (1982) Scargle J.D., 1982, ApJ, 263, 835
- Scargle (1989) Scargle J.D., 1989, ApJ, 343, 874
- Sporring et al. (1997) Sporring J., Niselsen M., Florack L., Johansen P., 1997, Gaussian Scale-Space Theory, Kluwer Ac. Pub., Drodrecht
- Starck & Murtagh (2002) Starck J.L., Murtagh F., 2002, Astronomical Image and Data Analysis, Springer, Berlin
- Stellingwerf (1978) Stellingwerf R.F., 1978, ApJ, 224, 953
- Szatmáry et al. (1994) Szatmáry K., Vinkó J., Gál J., 1994, A&AS, 108, 377
- Vetterli & Kovacevic (1995) Vetterli M., Kovacevic J., 1995, Wavelets and Subband Coding, Prentice Hall, Englewood Cliffs, New Jersey
- Witkin (1994) Witkin A.P., 1984, Image Understanding 1984, Ullman and Richards editors, Norwood Ablex, New Jersey