The Nuclei of Late-type Spiral Galaxies
Abstract
We summarize some recent results from our observational campaign to study the central regions of spiral galaxies of late Hubble type (Scd - Sm). These disk-dominated, bulgeless galaxies have an apparently uneventful merger history. The evolution of their nuclei thus holds important constraints on the mechanisms that are responsible for bulge formation and nuclear activity in spiral galaxies. We discuss the structural properties, stellar populations, and dynamical masses of the compact, luminous star cluster that is found in the nuclei of most late-type spiral galaxies. Although preliminary, our results strongly indicate that many galaxies of our sample experience repeated periods of nuclear star formation. While the exact mechanism that leads to the required high gas densities in the galaxy nucleus remains unclear, results from our recent CO survey of late-type spirals demonstrate that in most cases, the central kpc contains enough molecular gas to support repetitive nuclear starbursts.
1European Space Agency (ESTEC), 2200 AG Noordwijk, Netherlands
2MPI für Astronomie, Königsstuhl 17, D-69117 Heidelberg, Germany
3University of Oxford, Keble Rd., Oxford OX1 3RH, U.K.
4STScI, 3700 San Martin Drive, Baltimore, MD 21218, U.S.A.
5Carnegie Observatories, 813 Santa Barbara Street, Pasadena, CA 91101-1292,
U.S.A.
6Ohio University, Dept. of Physics and Astronomy, Athens, OH 45701-2979,
U.S.A.
7IAA, Camino Bajo de Huetor 24, 18080 Granada, Spain
8Spitzer Science Center, CalTech, Pasadena, CA 91125, U.S.A.
1. Introduction: the Central Regions of Late-type Spirals
In most formation scenarios for spiral galaxies, the central bulge is the “trashbin of violent relaxation” where a dynamically hot stellar component has formed either through external potential perturbations such as early mergers of proto-galaxies (e.g. Carlberg 1992), or perhaps via internal effects such as violent bar instabilities (e.g. Norman, Sellwood, & Hasan 1996). The latest-type spirals, then, must have lived very sheltered and uneventful lives, since their central “trashbin” is virtually empty, i.e. they are devoid of prominent starburst events, have no discernible stellar bulges, and rarely show signs of nuclear activity. These galaxies often have gently rising rotation curves (e.g. Matthews & Gallagher 1997) that indicate a nearly homogeneous mass distribution on scales . On these scales, gravity therefore hardly provides a vector pointing at the center, and it is not obvious that the nucleus of these galaxies is well-defined and a unique environment.
see attached file fig1a.gif

Surprisingly, the photocenter of many late-type spiral galaxies is nevertheless occupied by a compact, luminous stellar cluster (Phillips et al. 1996; Carollo et al. 1998; Matthews et al. 1999; Böker et al. 2002, hereafter Paper I). Figure 1 shows HST/WFPC2 I-band images of three representative examples of such nuclear star clusters (NCs), together with their surface brightness profiles as measured from elliptical isophote fits to the WFPC2 data. The typical luminosities of NCs are in the range - (Paper I). Nuclear clusters are therefore much brighter than average stellar clusters in the disks of nearby spiral galaxies (e.g. Larsen 2002), and comparable to young “super star clusters” in luminous merger pairs (Whitmore et al. 1999) or circumnuclear starforming rings in spiral galaxies (e.g. Maoz et al. 2001).
Knowledge of the stellar populations and masses of NCs is essential in order to constrain the mechanism(s) that lead to their formation. The age(s) of the stellar population(s) can be determined from spectral synthesis methods applied to medium-resolution spectra of NCs. Measuring the stellar masses of NCs requires both accurate knowledge of the velocity dispersion (from high-resolution spectra) and the cluster light distribution (from HST imaging). This kind of analysis has been successfully applied to NCs (Böker et al. 1999) as well as young clusters in the disks of nearby galaxies (Smith & Gallagher 2001; Mengel et al. 2002, McCrady et al. 2003). In this paper, we summarize our ongoing study of the properties and formation mechanism(s) of NCs in late-type spirals.
2. The Sizes of Nuclear Clusters
Star clusters in all but the closest galaxies are marginally resolved sources, even with the excellent resolution of HST images. In this situation, conventional deconvolution methods are not reliable.
Recently, a number of authors (e.g. Kundu & Whitmore 1998, Larsen 1999, Carlson & Holtzman 2001) have independently developed techniques to determine more reliably the structure of stellar clusters in external galaxies. The various methods are conceptually similar in that they assume a parametric model for the intrinsic light distribution. A particular model is considered to be a good description of reality if - after convolution with the instrumental PSF - it matches the observations. The “best” model is the one that minimizes the -difference to the data.


For our analysis, which is described in detail in Böker et al (2004, hereafter paper II), we used the software package ISHAPE (Larsen 1999) in combination with synthetic PSFs created with the TinyTim software (Krist & Hook 2001). Unless the signal-to-noise ratio of the data is exceptionally high, such an analysis normally identifies a number of analytical models that are consistent with the data in a sense, and the exact shape of the cluster cannot be constrained further. However, the cluster size, as measured by the effective radius (i.e. the radius which includes half of the cluster light), is a rather robust quantity, i.e. different acceptable models yield very similar values for .
The results are summarized in Figure 2 which shows the luminosity and size distributions of the nuclear cluster sample, compared to the Milky Way globular clusters (MWGCs) from the online version of the Harris (1996) catalog. While NCs are on average four magnitudes brighter than MWGCs, they have very similar sizes, with typical values of in the range 2 - 5 pc. This is an interesting result because it provides support for theories which invoke galaxy cannibalism in the early universe to explain the properties of some unusual GC such as Omega Cen. Provided that the progenitor galaxies had NCs similar to ones observed in our sample, these very dense clusters would most likely have survived the merger and - being stripped of their parent galaxies - would passively age in the halo of the remnant. For this to be a viable scenario, one would have to postulate that the 4 magnitudes of luminosity difference mostly reflect a difference in the stellar population ages between present-day NCs and MWGCs. In principle, this is entirely possible: population synthesis models such as PEGASE (Fioc & Rocca-Volmerange 1997) or Starburst99 (Leitherer et al. 1999) predict a fading of 3-4 magnitudes in I-band for single age populations between and years.
In order to test whether NCs in present-day galaxies are indeed dominated by young stellar populations, we have begun a spectroscopic follow-up to determine their ages and dynamical masses.
3. Stellar Populations of Nuclear Clusters
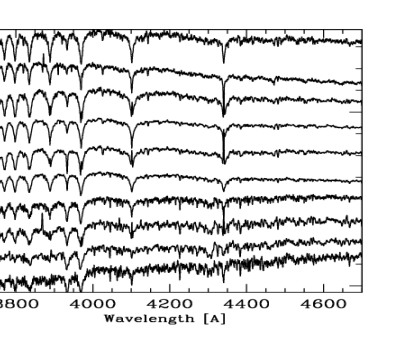
Figure 3 shows the ”blue arm” optical spectra of 10 nuclear clusters taken with VLT/UVES after subtraction of the emission from the galaxy disk underlying the cluster. The spectra have a resolution of but have been smoothed for plotting. The 10 clusters were sorted ”by eye” in an age sequence, starting at the top with the youngest objects that have the strongest Balmer series absorption lines, to the oldest objects with the strongest Ca H+K lines at the bottom.
It is clear even from this crude first order age-dating attempt that many clusters show strong Balmer absorption lines which occur only in stars of spectral type B or A. These stars must have formed rather recently, because they only live for less than 1 Gyr. Because it is unlikely that a large fraction of nuclear clusters experience a star formation event at the same time, one can already deduce from Figure 3 that nuclear starbursts are likely a repetitive event.
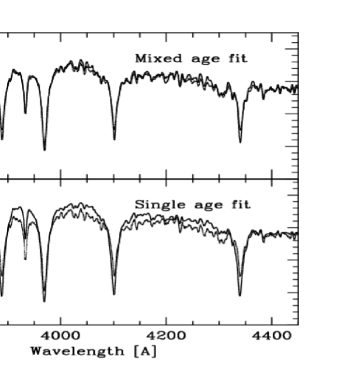
In fact, this notion is supported by a detailed analysis of the spectra in Figure 3 with population synthesis tools. While this work is currently ongoing, and results will be published in a forthcoming paper (Walcher et al. 2004), we show in Figure 4 the representative example of NGC 7793. The spectrum can not be well described with a single-age stellar population: additional older populations are required to explain the continuum shape and the presence of deep Ca H+K features in an otherwise ”young” spectrum.
4. Dynamical Masses of Nuclear Clusters
The “weighing” of stellar clusters from their stellar dynamics requires two observational ingredients: the stellar velocity dispersion and an accurate knowledge of the cluster light distribution (after correction for any instrumental broadening). For the latter, we use the results of the ISHAPE fitting described in § 2.
The stellar velocity dispersion can, in general, be measured from the comparison of absorption line profiles in the integrated cluster light with those of suitable template stars. To first order, any line broadening is assumed to be due to the Doppler shifts of stars moving in the gravitational potential of the cluster. Finding the potential that correctly predicts (via Jeans’ equation) and the cluster light profile yields the mass-to-light ratio, and hence the mass of the cluster.
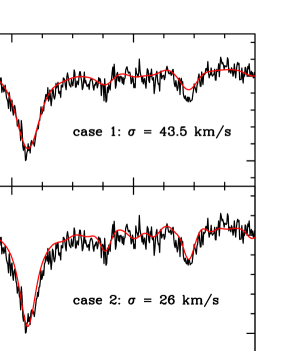
For our analysis, we have used the ”red arm” of the UVES spectra which contains the Calcium triplet (CaT) lines around 8500Å. Figure 5 shows a representative example spectrum which also demonstrates a systematic effect which complicates the simple approach outlined above, in particular if the cluster is dominated by a young stellar population which contains a significant number of supergiant stars. In this case, the correct mix of template stars is crucial, because the CaT lines in supergiant stars are strong enough to be systematically broadened due to their damping wings. If not properly reflected in the mix of template stars used for comparison to the cluster spectrum, this can lead to a significant overestimate of the velocity dispersion, and hence the cluster mass which scales with . While the population synthesis methods described in § 3 can provide important constraints on the correct template mix, it is often more reliable (provided the signal-to-noise of the data is high enough) to only use (much weaker) metal lines which originate in the photosphere of cool supergiants (with spectral type G-M). These lines are never strong enough for their profiles to be affected by damping, and have intrinsic widths that are small enough to allow measurement of the typical dispersion values in massive stellar clusters (of order 20-30 km/s) (or a full discussion of this issue, see Ho & Filippenko 1996a,b). Figure 5 indicates the range of values for that are derived by fitting the full spectral range (incl. the CaT lines, case 1) and the metal lines only (case 2).
While we will discuss the detailed methodology and error analysis in a forthcoming paper (Walcher et al. 2004), our preliminary results indicate that the typical masses of present-day NCs are a few . While this is significantly higher than the average globular cluster mass, it is not necessarily inconsistent with the notion that at least some GCs might once have been NCs, because gas inflow onto the cluster was presumably stopped when their host galaxy was disrupted. In any case, it is clear from the fact that the sizes of both cluster families are comparable (see § 2) that NCs must have a very high mass density.
5. Is there fuel for repetitive nuclear starbursts?
A natural question to ask is whether the latest-type spirals contain a sufficiently large reservoir of molecular gas in their central regions to support repetitive nuclear starbursts. To this end, we have surveyed 47 late-type spirals (most of them taken from the sample of paper 1) with the IRAM 30m-telescope to quantify the amount of CO in the central which corresponds to about 1.5 kpc at the median distance of our sample (16.7 Mpc). The results of this survey (Böker et al. 2003) can be summarized as follows:

1) For galaxies with CO detections, the median H2 mass within the central kpc is (assuming the standard Galactic conversion factor), an amount that can support a number of modest starburst events ( in stars). At least to first order, this is consistent with the scenario of a series of “delta-bursts” in the nucleus which explains the fact that the SED of most clusters is dominated by a young (less than a few 100 Myrs) population of stars.
2) The latest-type spirals closely follow correlations between molecular gas content and galaxy luminosity - both at optical and far-infrared wavelengths. These correlations, which have been established for more luminous, early- and intermediate-type spirals, are extended to lower luminosities by our sample (see Figure 6). This confirms the notion that the latest-type spirals are “normal” spiral galaxies which has already been inferred from their angular momenta and rotation velocities (Matthews & Gallagher 2002).
3) We find a strong separation between our CO detections and non-detections in central surface brightness of the stellar disk, . We detect 93% of galaxies with mags arcsec-2, but only 8% of galaxies with mags arcsec-2. While our observations are not sensitive enough to establish a direct correlation between the two quantities, our results fit in well with the detection rate of low-surface brightness (LSB) galaxies (O’Neil et al. 2003) which have even lower surface brightness disks than the galaxies in our sample. This suggests that the stellar mass distribution of the galaxy disk is an important indicator for the central accumulation of molecular gas.
4) In contrast to studies of earlier-type spirals (e.g. Sakamoto 1999), our observations provide little evidence for an enhanced molecular gas mass in the centers of barred galaxies relative to unbarred ones. It thus remains unclear what the mechanism for regulating the gas inflow into the central kpc is.
6. Summary
In ellipticals and “classical” spirals, phenomena that indicate nuclear activity such as AGN and massive black holes have received much attention over the past decades. Only recently, however, has it become evident that even in bulgeless, “pure” disk galaxies which are generally devoid of any obvious signs for nuclear activity, the galaxy center is a “special” location in that it is occupied by a massive, compact, and often young stellar cluster. These nuclear star clusters (NCs) have sizes and luminosities that are very similar to those of young super star clusters (SSCs) found in the disks of starburst galaxies. However, NCs most likely have a different, more complex, formation history, as can be inferred from population synthesis age-dating of their spectra as well as estimates of their masses from stellar dynamical modelling.
Unless one is willing to believe that we live in a special time, the fact that many nuclear star clusters are young suggests that they experience repetitive “rejuvenation”, most likely due to infall of molecular gas into the central few pc and associated star formation. This is not implausible, because bulgeless spirals are in many ways normal spirals. In particular, their molecular gas content follows the same scaling relation with galaxy luminosity as earlier-type spirals, and typical molecular gas masses in their central kpc are of the order .
While the “duty cycle” for nuclear starbursts still needs to be reliably established - which is one of the goals of our project - the possibility of repetitive nuclear cluster formation in late-type spirals has interesting consequences for galaxy evolution scenarios, both with respect to morphological classification (i.e. Hubble type) and nuclear activity (i.e. black hole growth).
References
- Böker et al. (1999) Böker, T., van der Marel, R.P., & Vacca, W.D. 1999, AJ, 118, 831
- Böker et al. (2002) Böker, T., Laine, S., van der Marel, R.P., Sarzi, M., Rix, H.-W., Ho, L.C., & Shields, J.C. 2002, AJ, 123, 1389
- Böker et al. (2003b) Böker, T., Lisenfeld, & U. Schinnerer, E. 2003, A&A, 406, 87
- Böker et al. (2004) Böker, T., Sarzi, M., McLaughlin, D.E., van der Marel, R.P., Rix, H.-W., Ho, L.C., & Shields, J.C. 2004, AJ, 127, 105
- Carlberg (1992) Carlberg, R. G. 1992, ApJ, 399, L21
- Carlson & Holtzman (2001) Carlson, M. N. & Holtzman, J. A. 2001, PASP, 113, 1522
- Carollo et al. (1998) Carollo, C.M., Stiavelli, M., & Mack, J. 1998, AJ, 116, 68
- Fioc & Rocca-Volmerange (1997) Fioc, M. & Rocca-Volmerange, B. 1997, A&A, 326, 950
- Harris (1996) Harris, W.E. 1996, AJ, 112, 1487
- Ho & Filippenko (1996a) Ho, L. C., & Filippenko, A. V. 1996a, ApJ, 466, 83
- Ho & Filippenko (1996b) Ho, L. C., & Filippenko, A. V. 1996b, ApJ, 472, 600
- Krist & Hook (2001) Krist, J. & Hook, R. 2001, The TinyTim User’s Guide, Version 6.0 (Baltimore:STScI)
- Kundu & Whitmore (1998) Kundu, A. & Whitmore, B.C. 1998, AJ, 116, 2841
- Larsen (1999) Larsen, S.S. 1999, A&AS, 139, 393
- Larsen (2002) Larsen, S.S. 2002, AJ, 124, 1393
- Leitherer et al. (1999) Leitherer, C., et al. 1999, ApJS, 123, 3
- Maoz et al. (2001) Maoz, D., Barth, A.J., Ho, L.C., Sternberg, A., & Filippenko, A.V. 2001, AJ, 121, 3048
- Matthews & Gallagher (1997) Matthews, L. D. & Gallagher, J. S., III 1997, AJ, 114, 1899
- Matthews et al. (1999) Matthews, L.D. et al. 1999, AJ, 118, 208
- Matthews & Gallagher (2002) Matthews, L.D. & Gallagher, J.S., III 2002, ApJS, 141, 429
- McCrady et al. (2003) McCrady, N., Gilbert, A.M., & Graham, J.R. 2003, ApJ, 596, 240
- Mengel et al. (2002) Mengel, S., Lehnert, M.D., Thatte, N., & Genzel, R. 2002, A&A, 383, 137
- Norman et al. (1996) Norman, C.A., Sellwood, J.A., Hasan, H. 1996, ApJ, 462, 114
- O’Neil et al. (2003) O’Neil, K., Schinnerer, E., Hofner, P. 2003, ApJ, 588, 230
- Phillips et al. (1996) Phillips, A.C., Illingworth, G.D., MacKenty, J.W., & Franx, M. 1996, AJ, 111, 1566
- Sakamoto et al. (1999) Sakamoto, K., Okumura, S.K., Ishizuki, S., et al. 1999, ApJ, 124, 403
- Smith & Gallagher (2001) Smith, L.J. & Gallagher, J.S. III 2001, MNRAS, 326, 1027
- Whitmore et al. (1999) Whitmore, B.C., Zhang, Q., Leitherer, C., Fall, S. M., Schweizer, F., & Miller, B.W. 1999, AJ, 118, 1551