A FAR-UV SPECTROSCOPIC ANALYSIS OF THE CENTRAL STAR OF THE PLANETARY NEBULA LONGMORE 1111Based on observations made with the NASA-CNES-CSA Far Ultraviolet Spectroscopic Explorer and data from the MAST archive. FUSE is operated for NASA by the Johns Hopkins University under NASA contract NAS5-32985.
Abstract
We have performed a non-LTE spectroscopic analysis using far-UV and UV data of the central star of the planetary nebula K1-26 (Longmore 1), and found kK, , and . The temperature is significantly hotter than previous results based on optical line analyses, highlighting the importance of analyzing the spectra of such hot objects at shorter wavelengths. The spectra show metal lines (from, e.g., carbon, oxygen, sulfur, and iron). The signatures of most elements can be fit adequately using solar abundances, confirming the classification of Lo 1 as a high gravity O(H) object. Adopting a distance of 800 pc, we derive , , and . This places the object on the white dwarf cooling sequence of the evolutionary tracks with an age of kyr.
1 INTRODUCTION
Longmore 1 (K1-26, PK 255-59 1, hereafter Lo 1) was originally discovered by Longmore (1977) as a PN having a notably large angular size (″). The spectra of its central star show both hydrogen and He II absorption features, with no evidence of a stellar wind in its UV or optical spectra (Patriarchi & Perinotto, 1991; Kaler & Lutz, 1985; Mèndez et al., 1985). Because of its high galactic latitude (), the reddening toward Lo 1 is thought to be minimal (Kaler & Lutz, 1985). Based on its optical spectrum, Mèndez et al. (1985) termed Lo 1 an “hgO(H)” star - a high gravity object with very broad Balmer absorptions. Such objects can lie on the white-dwarf cooling tracks, but can also be non-post-AGB objects. A distance of pc (Ishida & Weinberger, 1987) implies a nebular radius of pc, suggesting that Lo 1 is a quite evolved CSPN (most PN have radii pc — Cahn et al., 1992).
Hot central stars of planetary nebulae (CSPN) emit most of their observable flux in the Far-UV range. We have observed the central star of Lo 1 with the Far Ultraviolet Spectroscopic Explorer (FUSE) satellite in the 905—1187 Å range. Using this data as well as archive International Ultraviolet Explorer (IUE) data (1150—3300 Å), we determined the parameters of the central star through stellar modeling, and discuss evolutionary implications.
Parameters of Lo 1 compiled from previous literature are listed in Table 1.
2 OBSERVATIONS AND REDUCTION
Table 2 lists the spectra utilized in this paper. Lo 1 was observed as part of FUSE’s cycle 1 program P133 (Bianchi). The IUE data were retrieved from the MAST archive. The observed spectra will be presented in § 3.
FUSE covers the wavelength range of 905–1187 Å at a spectral resolution of 30,000. The flux calibration accuracy of FUSE is % (Sahnow et al., 2000). It is described by Moos et al. (2000) and its on-orbit performance is discussed by Sahnow et al. (2000). FUSE collects light concurrently in four different channels (LiF1, LiF2, SiC1, and SiC2). Each channel is recorded by two detectors, each divided into two segments (A & B) covering different subsets of the above range with some overlap.
The FUSE spectra were taken through the LWRS (30″30″) aperture. These data, taken in “time-tag” mode, have been calibrated using the most recent FUSE data reduction pipeline, efficiency curves and wavelength solutions (CALFUSE v2.2). We combined the data from different segments, weighted by detector sensitivity, and rebinning to a uniform dispersion of 0.05 Å (which is probably close to the actual resolution since the data were taken in the early part of the mission). Bad areas of the detectors, and those regimes affected by an instrumental artifact known as “the worm” (FUSE Data Handbook v1.1), were excluded. For part of the first observation, telescope alignment problems moved the target out of the LiF2/SiC2 aperture. This also appears to have happened with the SiC2 detector halfway through the second observation. We thus omitted data taken during these target drifts for the affected detectors.
Four IUE spectra of the central star of Lo 1 are available, however it appears that one (SWP20275) missed the central star. The only high-resolution spectrum (SWP39146) is under-exposed and was not used. The two remaining low resolution long wavelength and short wavelength spectra are in agreement in the region of overlap. The IUE spectra are relatively featureless and are mainly used to fit the continuum flux distribution.
3 MODELING
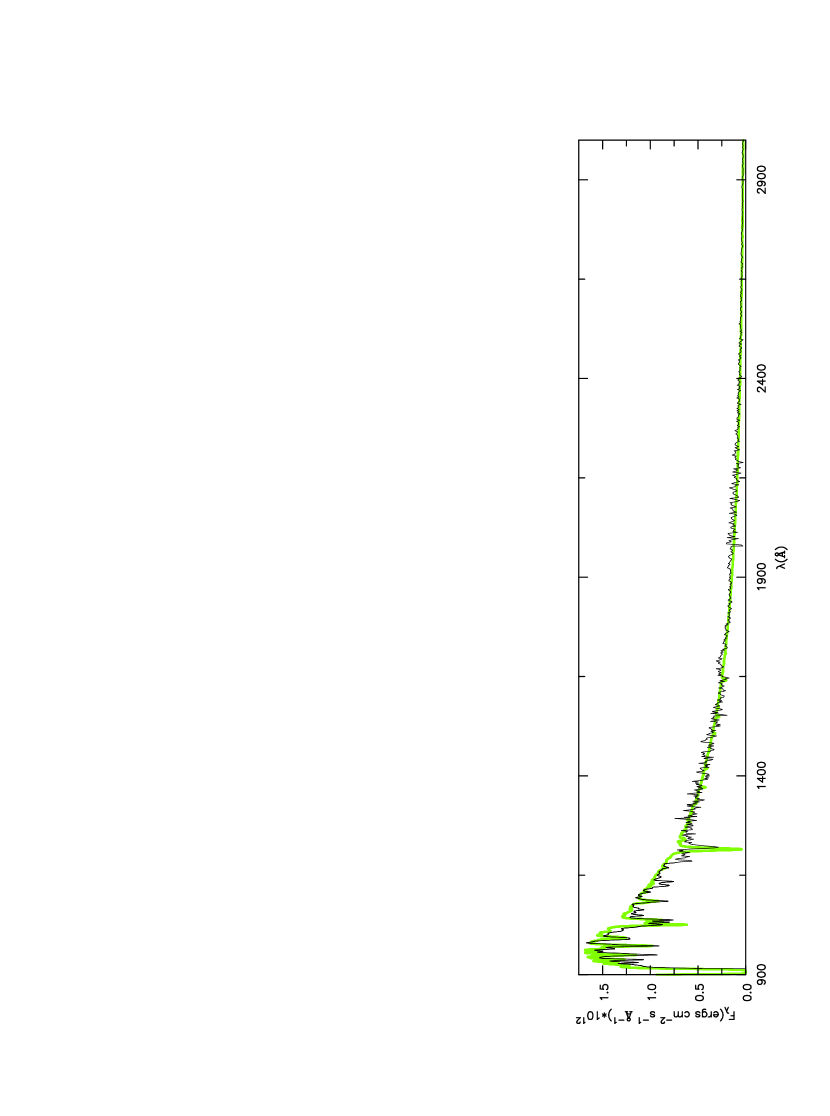
Modeling of Lo 1 consisted of two parts: modeling the hot central star, and modeling the sight-line hydrogen (atomic and molecular). We describe each in turn. A virtue of its location significantly outside the Galactic plane is a low reddening, which we determine, by fitting the continuum slope, to be (we use a value of throughout this paper). The data, as well as the model fits, are shown in Figs. 1 and 2. We determine the radial velocity of Lo 1 to be using stellar absorption line features in the long wavelength FUSE range ( Å) such as C IV 1169.0 and C IV 1107.6.
3.1 The Central Star Model
To model the white dwarf central star, we used the TLUSTY code to calculate the stellar atmosphere, and SYNSPEC to calculate the synthetic flux (Hubeny, 1988; Hubeny & Lanz, 1992; Hubeny et al., 1994; Hubeny & Lanz, 1995). TLUSTY calculates the atmospheric structure assuming radiative and hydrostatic equilibrium, and a plane-parallel geometry, in non-LTE (NLTE) conditions. In the case of hot ( 50 kK) white dwarfs, LTE calculations are not appropriate, and result in significant deviations from NLTE calculations (see, e.g., Dreizler & Werner, 1996; Werner, 1996; Werner et al., 1991; Napiwotzki, 1997). This is because in such hot objects, the populations of the ions are mainly determined by the intense radiation field despite the high gravities.
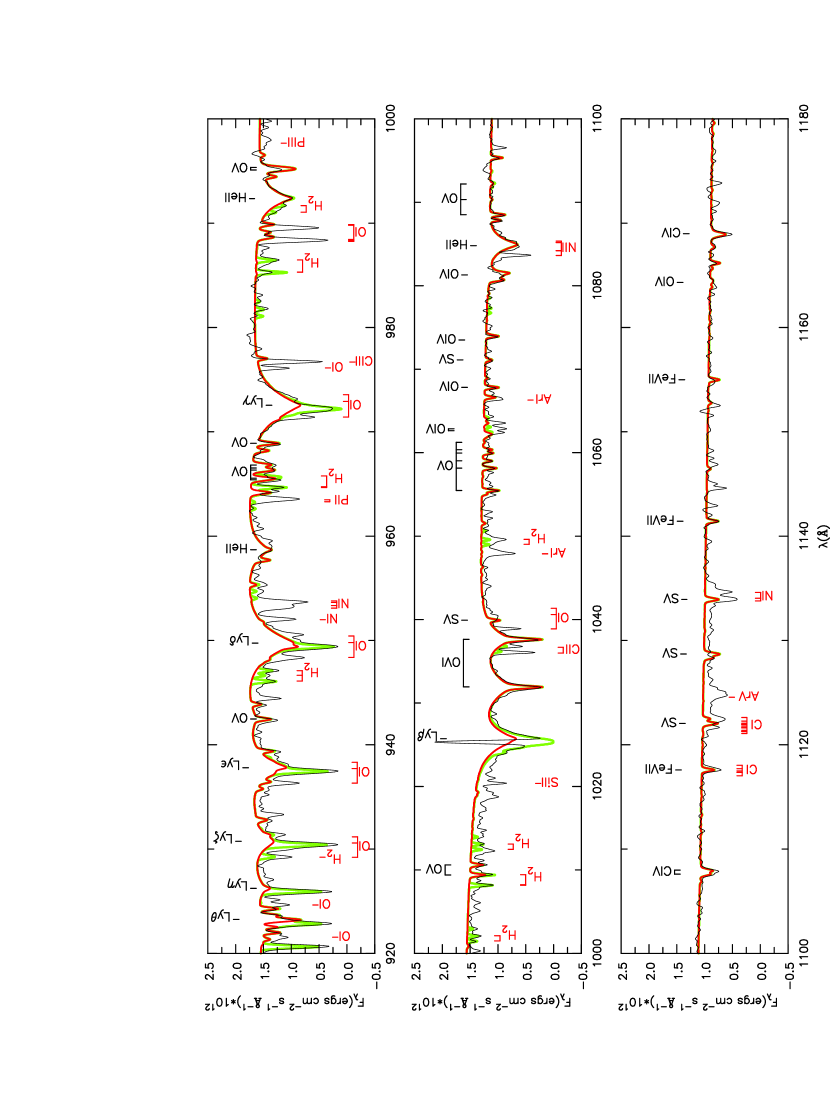
The FUSE spectrum shows features of hydrogen, helium, and metals (e.g., C, O, Fe, and S), with O VI 1032,38 being especially prominent. Test models indicated that the solar abundance ratio for H/He (as found by Mèndez et al., 1985) was adequate. We thus constructed a grid of solar abundance models varying and , treating hydrogen and helium in NLTE to calculate the structure of the atmosphere. Once and were determined adequately, they were held fixed, and the CNO elements were varied individually in NLTE to constrain their abundances and ensure that neglect of their NLTE treatment did not alter the derived and .
The atomic data used come from TOPBASE, the data-base of the Opacity Project (Cunto et al., 1993). TLUSTY makes use of the concept of “superlevels”, where levels of similar energy are grouped together and treated as a single level in the rate equations (after Anderson, 1989). The number of levels+superlevels used for the NLTE model ions were: H I(8+1), He I(24+0), He II(20+0), C III(34+12), C IV(35+2), N IV(15+8), N V(21+4), O IV(39+31), O V(34+6), and O VI(15+5). Ne, Na, Mg, Si, S, Ar, Ca, and Fe were allowed to contribute to the total number of particles and charge but their opacity contribution was neglected in the model atmosphere calculation. We have adopted SYNSPEC’s values for solar abundances, which are taken from Grevesse & Sauval (1998).
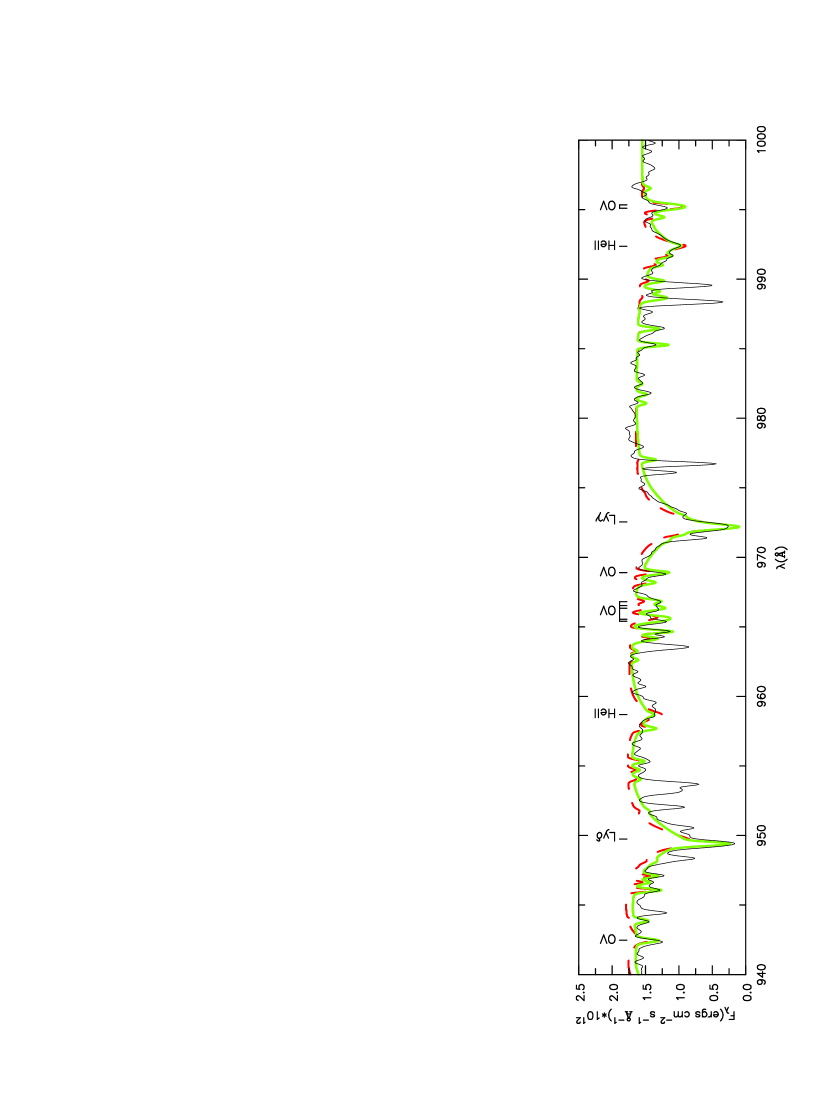
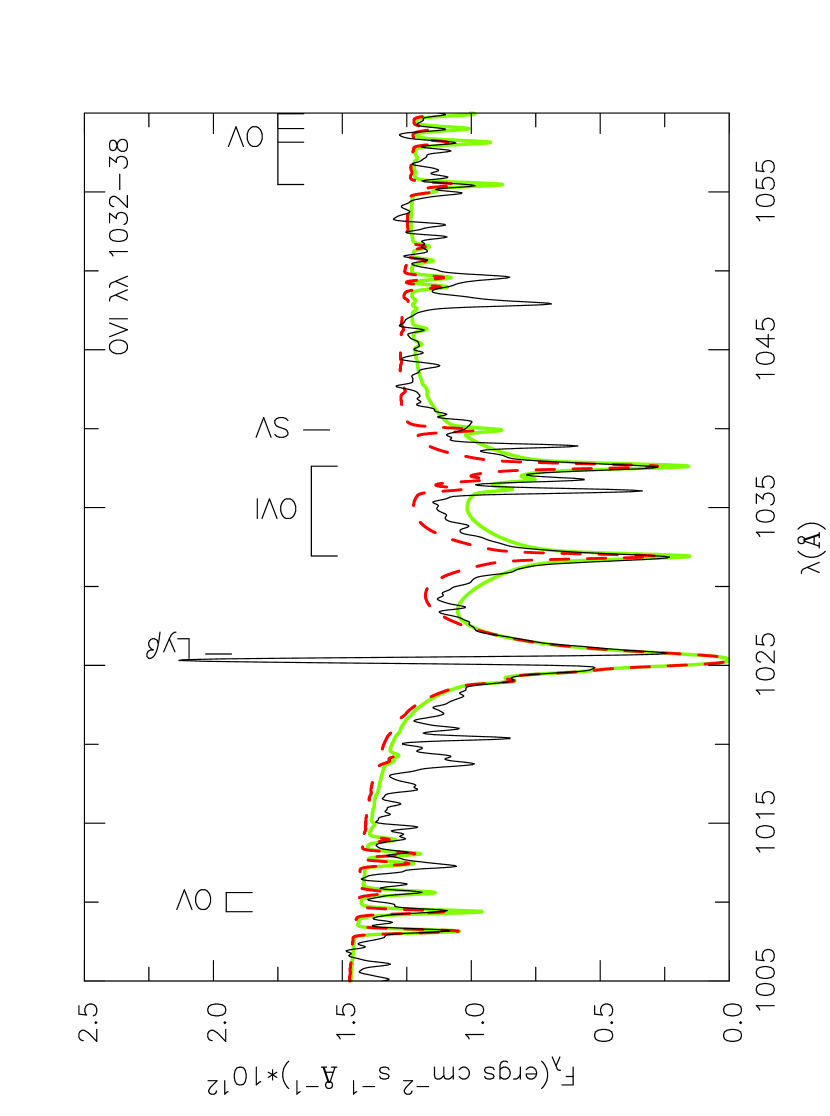
As previously mentioned, a solar hydrogen to helium ratio appeared adequate to fit the He II and H Lyman spectrum. The gravity was constrained by fitting mainly the wings of these features, as demonstrated in Fig. 3. To determine the effective temperature, the FUV-UV continuum shape, as well as FUV spectral features of hydrogen, helium and metals (mainly oxygen and carbon) were used as diagnostics. The parameters of our “best” fit model for the CSPN of Lo 1 are: kK, . Solar values for the metal abundances were found to be adequate, except for oxygen, for which the solar value underproduced the strong O VI 1032,38 feature (shown in Fig. 4). We found that an oxygen abundance enriched 5 times with respect to the solar value ( by mass) produced a good fit, however some of the other oxygen features then appeared a bit strong. For temperatures kK, the O VI feature is at its strongest, thus higher or lower temperatures require an even greater oxygen enrichment. Unless otherwise stated, the model spectrum shown in the figures and what we refer to as “our model” has the parameters kK, , , with the abundances of all other elements set to their solar values.
3.2 Modeling H2 and H I absorption toward Lo 1
The FUSE spectrum of Lo 1 (Fig. 1) displays a series of absorption features corresponding to the hydrogen Lyman sequence. The cores of these features are attributable to absorption from sight-line hydrogen. These cores are velocity shifted with respect to the broader, stellar Lyman absorption features by , which corresponds to our measured radial velocity for the CSPN lines. Thus these features are interstellar in origin (rather than circumstellar).
The effects of H I absorption were applied to the model spectrum in the following manner. For a given column density () and gas temperature (), the absorption profile of each line is calculated by multiplying the line core optical depth () by the Voigt profile where is the frequency in Doppler units and is the ratio of the line damping constant to the Doppler width (the “b” parameter). The observed flux is then .
Because the H I column density determination is insensitive to temperature, we determine by assuming K (corresponding to the mean temperature of the ISM — Hughes et al., 1971) and and fitting the Lyman profiles of the FUSE data. Doing so, we derive cm-2.
The FUSE spectrum also shows some weak absorption features from intervening molecular hydrogen, which originate from the Lyman (–) and Werner (–) sequences (these are marked in Fig. 1). We applied the effects of different H2 models in a similar manner as the H I, again assuming a gas temperature of 80 K. We derive a relatively small column density of cm-2. The low column density is probably a consequence of the high galactic latitude of Lo 1, and is consistent with our determination of mag, based on typical relations between and H2 column densities in the ISM found by Bohlin et al. (1978).
Our stellar model spectrum, with hydrogen absorptions corresponding to cm-2 and cm-2 applied, is shown in Fig. 1.
4 DISCUSSION
Our derived model parameters for the central star and sight-line hydrogen are presented in Table 3. Scaling our model flux to the observed flux yields , the ratio of the stellar radius to the distance. This value, using a distance of pc (Ishida & Weinberger, 1987), yields a radius of and a corresponding luminosity of . The model flux then yields a corresponding visual magnitude of mag, in good agreement with the measured value of mag (Kaler & Lutz, 1985). Because we can only constrain the gravity rather loosely, we cannot derive a meaningful value for the mass of the central star without appealing to stellar evolution tracks. As discussed in § 3.1, the O VI doublet may indicate an oxygen enriched atmosphere. Usually, in CSPN, oxygen enrichment is associated with helium-rich objects (i.e., helium-burners), and is often accompanied by carbon-enrichment. However, the abundances of the other elements in Lo 1 do not appear to be much different than the solar values, which is characteristic of many H-burning CSPN. Therefore, we compared our derived effective temperature and luminosity with both the hydrogen- and helium-burning (solar abundance) tracks of Vassiliadis & Wood (1994). The H-burning tracks indicate a current core mass of , and an initial mass of 2.0 , with the uncertainties of our parameters encompassing the ( ,) = (1.5,0.597) and (2.5,0.677) tracks as well. So, from the H-burning evolutionary models, we derive ( ,) = (,) and a post-AGB age 60 kyr. In a similar fashion, we derive ( ,) = (,) , 70 kyr from comparison with the He-burning tracks.
The derived stellar parameters of Lo 1 are similar to those of the hotter, higher-gravity O(H) stars in the sample of central stars for old PN classified by Napiwotzki (1999). Thus, we confirm the Mèndez et al. (1985) classification of Lo 1 as a hgO(H) star.
Mèndez et al. (1985) performed a non-LTE analysis of its optical spectrum and obtained kK, , and for the central star. We have calculated a TLUSTY model with these parameters and find it fails to match the FUV data for multiple reasons. When this model is scaled to match the UV continuum level, it significantly underproduces the FUV continuum level. It also fails to duplicate many of the FUV diagnostics, most notably the strong O VI 1032,38 feature. Similarly, Hoare et al. (1996), from an analysis of the optical and extreme ultraviolet spectra of the CSPN NGC 1360, found a temperature significantly higher than the results of Mèndez et al. (1985), which were based on optical data only. Our significantly higher derived temperature and gravity illustrate the importance of considering the FUV wavelength regime when modeling such hot CSPN, where they emit the majority of their observable flux (i.e., longwards of the Lyman limit) as well as display their strongest stellar features.
5 CONCLUSIONS
We have analyzed FUV and UV spectra of Lo 1, a hot CSPN notable for its relatively high galactic latitude and thus having a minimal reddening. Its FUSE spectrum, aside from showing hydrogen and helium lines, shows strong O VI 1032,38 signatures, perhaps indicating an oxygen-enriched object.
We have modeled the FUSE and IUE spectrum of this object to determine parameters of kK, , , , and . The temperature is much higher than that derived by Mèndez et al. (1985) from an optical-line analysis ( kK), and illustrates the importance of the FUV-UV range in the analysis of hot CSPN. These parameters confirm the Mèndez et al. (1985) classification of Lo 1 as a high-gravity O(H) star. Comparison of our parameters to evolutionary tracks indicate a post-AGB age of kyr. We also measure for the Lo 1 PN system.
References
- Anderson (1989) Anderson, L. S. 1989, ApJ, 339, 588
- Bohlin et al. (1978) Bohlin, R. C., Savage, B. D., & Drake, J. F. 1978, ApJ, 224, 132
- Cahn et al. (1992) Cahn, J. H., Kaler, J. B., & Stanghellini, L. 1992, A&AS, 94, 399
- Cunto et al. (1993) Cunto, W., Mendoza, C., Ochsenbein, F., & Zeippen, C. J. 1993, A&A, 275, 5
- Dreizler & Werner (1996) Dreizler, S. & Werner, K. 1996, A&A, 314, 217
- Grevesse & Sauval (1998) Grevesse, N. & Sauval, A. J. 1998, Space Sci. Rev., 85, 161
- Hoare et al. (1996) Hoare, M. G., Drake, J. J., Werner, K., & Dreizler, S. 1996, MNRAS, 283, 830
- Hubeny (1988) Hubeny, I. 1988, Comput. Phys. Comm., 52, 103
- Hubeny et al. (1994) Hubeny, I., Hummer, D. G., & Lanz, T. 1994, A&A, 282, 157
- Hubeny & Lanz (1992) Hubeny, I. & Lanz, T. 1992, A&A, 262, 501
- Hubeny & Lanz (1995) —. 1995, ApJ, 493, 875
- Hughes et al. (1971) Hughes, M. P., Thompson, A. R., & Colvin, R. S. 1971, ApJS, 23, 323
- Ishida & Weinberger (1987) Ishida, K. & Weinberger, R. 1987, A&A, 178, 227
- Kaler & Feibelman (1985) Kaler, J. B. & Feibelman, W. A. 1985, ApJ, 297, 724
- Kaler & Lutz (1985) Kaler, J. B. & Lutz, J. H. 1985, PASP, 97, 700
- Kohoutek & Laustsen (1977) Kohoutek, L. & Laustsen, S. 1977, A&A, 61, 761
- Longmore (1977) Longmore, A. J. 1977, MNRAS, 178, 251
- Mèndez et al. (1985) Mèndez, R. H., Kudritzki, R. P., & Simon, K. P. 1985, A&A, 142, 289
- Moos et al. (2000) Moos, H. W., Cash, W. C., & Cowie, L. L. 2000, ApJ, 538, 1
- Napiwotzki (1997) Napiwotzki, R. 1997, A&A, 322, 256
- Napiwotzki (1999) —. 1999, A&A, 350, 101
- Patriarchi & Perinotto (1991) Patriarchi, P. & Perinotto, M. 1991, A&AS, 91, 325
- Sahnow et al. (2000) Sahnow, D. J., Moos, M. W., & Ake, T. B. 2000, ApJ, 538, 7
- Vassiliadis & Wood (1994) Vassiliadis, E. & Wood, P. R. 1994, ApJ, 92, 125
- Werner (1996) Werner, K. 1996, A&A, 309, 861
- Werner et al. (1991) Werner, K., Heber, U., & Hunger, K. 1991, A&A, 244, 437
- West & Kohoutek (1985) West, R. M. & Kohoutek, L. 1985, ApJS, 60, 91
| Quantity | Value | References (Notes) |
| R.A. (J2000) | 02 56 58.23 | |
| Dec. (J2000) | –40 10 19.41 | |
| Galactic latitude () | –59.64 | Ishida & Weinberger (1987) |
| Galactic longitude () | 255.35 | Ishida & Weinberger (1987) |
| Height () [pc] | –690 | Ishida & Weinberger (1987) |
| Lateral distance () [pc] | 400 | Ishida & Weinberger (1987) |
| Radial distance [pc] | 800 | Ishida & Weinberger (1987) |
| PN radius [″] | 187, 230192 | Longmore (1977), Kohoutek & Laustsen (1977) |
| PN radius [pc] | 0.72, 0.890.75 | Assuming pc |
| [kms] | West & Kohoutek (1985) | |
| Logaritmic extinction at H () | Kaler & Feibelman (1985) | |
| CSPN [mag] | 15.4 | Kaler & Lutz (1985) |
| CSPN [kK] | Mèndez et al. (1985), from optical analysis | |
| CSPN | Mèndez et al. (1985), from optical analysis | |
| CSPN He/H | Mèndez et al. (1985), from optical analysis |
| Instrument | Data | Date | Resolution | Aperture |
|---|---|---|---|---|
| Set | (Å) | (″) | ||
| FUSE | P1330601001 | 12/11/00 | ||
| FUSE | P1330601002 | 12/11/00 | ||
| IUE | LWP11432 | 8/19/87 | 5-6 | |
| IUE | SWP21421 | 11/1/83 | 5-6 |
| Parameter | Value | Primary Diagnostics and Comments |
| CSPN [kK] | 12010 | H Ly–Ly, He II, metal features |
| CSPN [cm s-2] | H Ly–Ly, He II wings | |
| CSPN [ /pc] | Scaling model flux to observed UV flux | |
| CSPN [ ] | – | O VI 1032,38, other oxygen features |
| CSPN [ ] | Using pc | |
| CSPN [ ] | - | |
| [mag] | 0.01 | Continuum shape |
| I.S. [cm-2] | Lyman features, K assumed | |
| I.S. [cm-2] | FUV H2 features, K assumed | |
| [ ] | photospheric absorption lines |