Using Notch Filter Masks For High Contrast Imaging of Extrasolar Planets
Abstract
We present the first laboratory experiments using a notch-filter mask, a coronagraphic image mask that can produce infinite dynamic range in an ideal Lyot coronagraph according to scalar diffraction theory. We fabricated the first notch-filter mask prototype with .25 precision using an e-beam lithography machine. Our initial optical tests show that the prototype masks generate contrast levels of 10-5 at 3 and 10-6 at , with a throughput of 27%. We speculate on the “as-is” performance of such a mask in the Hubble Space Telescope.
1 Introduction
Directly imaging extrasolar terrestrial planets in reflected light requires facing the extremely high predicted contrast ratios between planets and their host stars, e.g., for an Earth analog orbiting a solar type star at quadrature. A planet-finding coronagraph must realize this contrast within a few diffraction widths (, where is the wavelength of light, and is the long axis of the primary mirror) of the stellar image. Though several coronagraph designs can achieve this contrast according to scalar diffraction theory (Kuchner & Spergel, 2003a), substantial work on mask design and laboratory investigation probably remains before this contrast can be achieved in practice.
Some coronagraph designs use image-plane masks to absorb on-axis light and diffract it away (Malbet, 1996; Sivaramakrishnan et al., 2001; Kuchner & Traub, 2002). Other designs use shaped or apodized pupils which benefit from combining aperture shape and the pupil intensity distribution to remove the wings of a circular aperture’s PSF (Kasdin et al., 2003; Vanderbei et al., 2003; Debes et al., 2002, 2003; Ge et al., 2002). Image masks offer the advantages that they explicitly remove starlight from the beam, and that they can provide high contrast at small angles from the optical axis, given sufficient control over low-spatial frequency modes.
Scattered light, wavefront errors, and mask construction errors can all degrade the contrast of a coronagraph. For example, for any coronagraphic image mask, mid-spatial frequency intensity errors near the center of the mask must be (Kuchner & Traub, 2002). Some of these errors can be controlled using active optics, but these corrections will necessarily apply only over a limited range of wavelengths.
Notch-filter masks offer a promising choice for planet-finding coronagraphs (Kuchner & Spergel, 2003b). These image masks absorb most of the light from an on-axis point source, and diffract all of the remainder onto a matched Lyot stop. While Lyot coronagraphs with Gaussian image masks must have a throughput of to reach 10-10 contrast, linear notch-filter masks have unlimited dynamic range according to scalar diffraction theory, and a throughput of , where is typically .
Other coronagraph designs besides notch filter masks can create perfect subtraction of on-axis light. However, those designs based on masks with odd symmetry (Rouan et al., 2000; Riaud et al., 2001) or interferometrically synthesized masks with odd symmetry (Baudoz et al., 2000a, b) create nulls that degrade as , where is the angle from the optical axis. This rapid degradation means that the finite size of a real star causes the coronagraph to leak light at levels unsuitable for terrestrial planet detection. Other designs, like the dual phase coronagraphic mask with an apodized entrance pupil (Soummer et al., 2003a, b), produce the needed null depth, but must use masks with special chromatic behavior and require precise, achromatic aperture apodization. Notch-filter masks are intrinsically achromatic and like the dual phase coronagraph, they create nulls of order or slower (Kuchner & Traub, 2002).
Notch-filter masks can be designed such that they are binary–regions of the mask are either opaque or transparent. This is a great advantage as intensity errors are not an issue so long as the mask is sufficiently opaque, leading to manufacturing constraints that are orders of magnitude smaller. However, the shape of the mask must be precisely reproduced, to the level of /3600 for a contrast of within the search area. For an instrument with and working , this corresponds to a tolerance on the order of 20 nm. Nanofabrication techniques are required to reach this precision.
As part of a joint university-industry study partly funded by Ball Aeorospace and in collaboration with the Penn State Nanofabrication facility (Nanofab), we have fabricated a prototype notch-filter mask and tested it in an experimental setup. We discuss briefly the mask fabrication process in Section 2, describe methods for modeling performance in Section 3, review the experiments and results in Section 4, and discuss ways of improving performance in Section 5.
2 Mask Design and Fabrication
Following the prescription laid out in Kuchner & Spergel (2003b), we designed a notch-filter mask based on a band limited function. The mask is comprised of a vertically repeating pattern of opaque curves described by:
| (1) |
where is used to determine the half power of the mask, the effective distance where a companion could reasonably be detected; and are the minimum and maximum wavelengths of the spectral band of interest. In reality the mask is constructed and therefore sampled at some resolution, i.e. with a nanofabrication tool, such that the band limited equation is modified slightly;
| (2) |
where is over all integers, is the resolution of the tool, and is the tophat function. The final step is to convolve with a series of functions spaced by to produce the mask function:
| (3) |
Repeating the band limited curve on scales ensures that the notch-filter mask becomes a good approximation of a transmissive mask for spatial frequencies in the pupil plane
We designed the mask for a f/158 system and a working wavelength of .633 . Our choice of was .46, to allow an inner working distance of 2-3 . For our working wavelength, the maximum size is 100 µm. While the theory prescribes that the width of the stripes be no wider than , there is no prohibition from making the width smaller and so we built the mask with stripes of width 25 . There are two advantages to undersizing, one is guarding against blue light leakage in a broadband case and the other is allowing future tests to be performed at smaller .
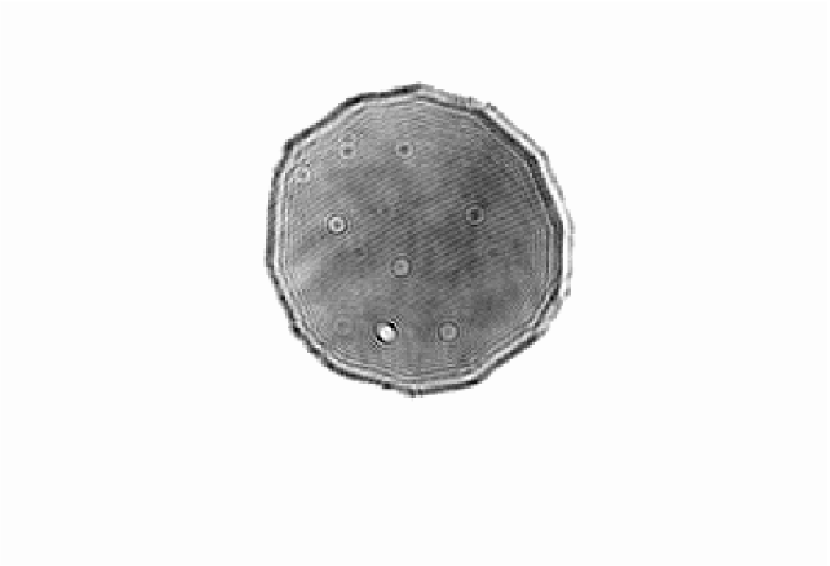
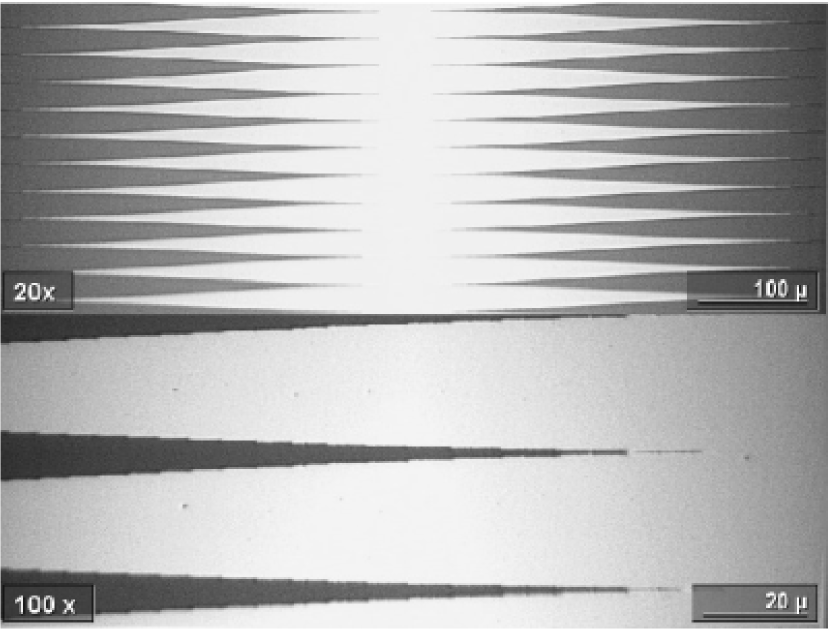
The Leica EBPG5-HR EBL tool available at Nanofab can produce resist features down to a minimum size of 20 nm with a precision of 5 nm for high resolution resists. The features are placed to an accuracy of 35 nm over a 125 mm writing area. The EBL resist was developed on a commercially supplied quartz substrate, covered by a layer of chromium that served as the opaque parts of the mask. Figure 1 shows the final mask under 20x and 100x optical magnification.
The resolution used for the EBL tool was .25 . Errors in the mask shape produce a leakage of light with an intensity of .25 where is the size of the error, measured in diffraction widths (Kuchner & Spergel, 2003b). Based on the EBL tool resolution, our mask should be capable of producing manufacturing-error-limited contrasts of 1.5 without the use of an apodized Lyot stop; with our choice of experimental setup and wavelength, achieving a deeper contrast of 10-8 at the peak would require 20 nm precision.
3 Modeling the Performance of the Mask
One would like to know in advance how the mask responds to different sources of error. It is also instructive to try and reproduce the actual performance of the fabricated mask in an attempt to understand the major sources of error in the experimental setup. However, modeling the resulting diffraction pattern requires the use of numerical methods such as Fast Fourier Transforms (FFTs) which are not adept at accurately handling simultaneous high resolution in both the imaging and pupil planes(Brigham, 2003).
Modeling the resultant scalar diffraction pattern or point spread function (PSF) of an optical system can be summed up in the following combination of the wave amplitude PSF of the original aperture , the mask function , and the Fourier Transform of the Lyot Stop aperture function :
| (4) |
where the star denotes convolution. The numerical problem arises when the arrays that represent and typically are Nyquist sampled, corresponding to , on order of the maximum scale of the mask function. To avoid this, we rely on the fact that the Fourier Transform of is semi-analytically described so that we can construct an accurate, coarsely sampled array that can then be used in the model. The Fourier Transform of at a particular value of is given by
| (5) |
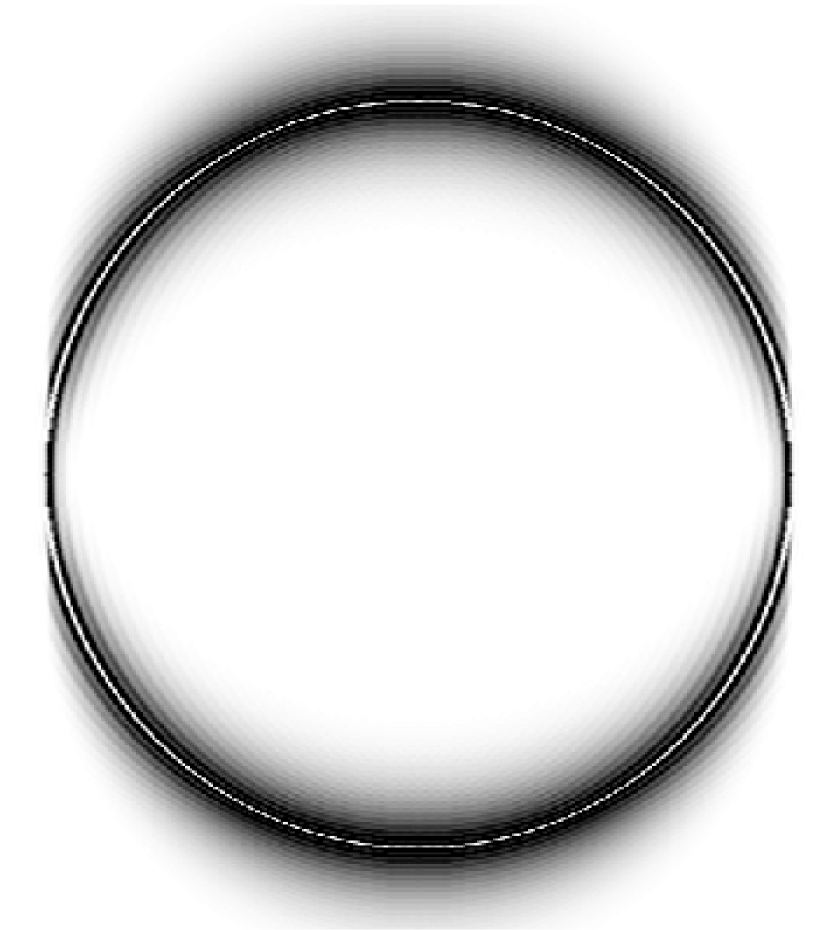
In this way can be built up using a 1D FFT that is faster and more accurate than its two dimensional analogue. The final intensity at the image is given by . Figure 2 shows the light distribution before the Lyot Stop for the notch-filter mask we designed assuming no errors and a circular entrance pupil.
4 Experiments and Results
The testbed used at Penn State was designed to test many different coronagraph and shaped pupil designs. We used a HeNe laser as the light source and approximated a point source by placing a microscope objective lens in front of the laser and placing the focused image on the entrance aperture of a single mode fiber. Light exiting the fiber was collimated, followed by a 3.16 mm entrance aperture. An image was formed at the focal plane image masks, which were mounted on a precision x-y-z stage. The light was then re-collimated and passed through a Lyot stop at an image of the entrance pupil. Finally the light was focused onto the CCD detector, where the final image was formed. The largest possible Lyot stop permitted by the linear mask design we chose would have been shaped like the overlap region of two circles (Kuchner & Traub, 2002). Instead, for convenience we used an iris as a Lyot stop. The final diameter used for the experiments was 1.8 mm. This diameter is 75% of what would be expected theoretically. We discuss the possible explanation for this in Section 5.
In order to measure a contrast ratio for any point in the PSF of the unblocked point source or of the point source behind the mask, the counts in a particular pixel must be normalized to the peak pixel counts of the unblocked point source for a given exposure time. Ideally one would measure the counts with the mask out and in for the same exposure time. The deepest contrast one can achieve with this method is limited by the nonlinearity of the CCD, in our case 20,000 ADU. For a S/N 5 in a particular pixel, this level would correspond to a contrast of only . To measure deeper contrasts one must take longer exposures of the blocked point source and normalize the results to an extrapolated count rate for the unblocked source.
To obtain reliable estimates of the count rates and fluxes of the different configurations we observed the PSF over a range of linearly increasing exposure times, taking care to avoid saturating the image. We measured the peak pixel and total flux in each exposure using the IRAF task IMEXAM. We averaged the results and fit a linear model to them using a least squares fitting routine in IDL called LINFIT. By extrapolating to a specific exposure time a normalization for observations with the notch-filter mask could be obtained.
We repeated this procedure for the point source through the quartz substrate of the notch-filter mask, with no substrate present, and with the Lyot stop completely open in order to determine the transmission of the substrates and the throughput of the Lyot stop. Our reported results for the notch-filter mask are scaled to the peak pixel count rate of the unblocked point source through the substrate. We used the other measurements to gauge the throughput of the quartz substrate and the Lyot stop.
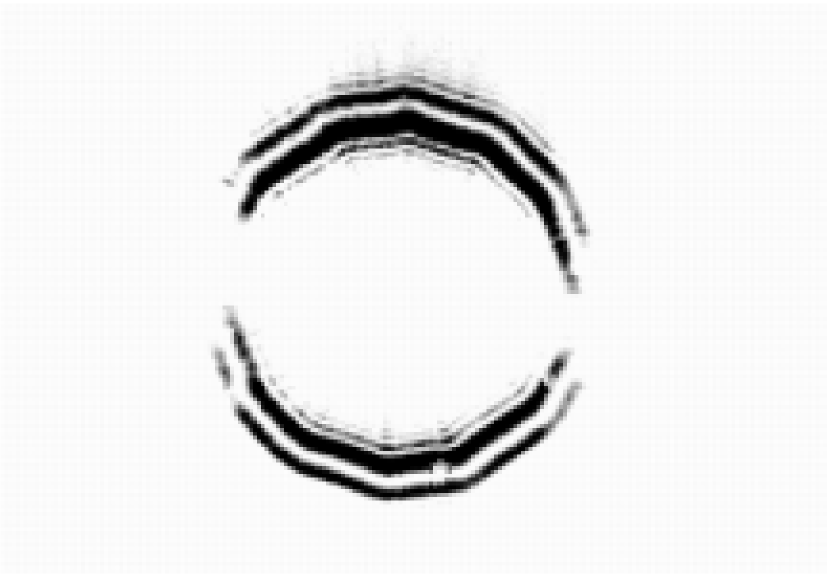
In the setup we also took observations of the pupil image both with and without the mask, to gauge how well qualitatively the mask worked, compared to what is predicted by scalar diffraction theory. Figure 3 shows that with the mask in place, the pupil qualitatively resembles what is predicted by our model in Figure 2. Note that both pupils in Figure 3 are at the same scale, and the bulk of the light falls outside the original pupil.
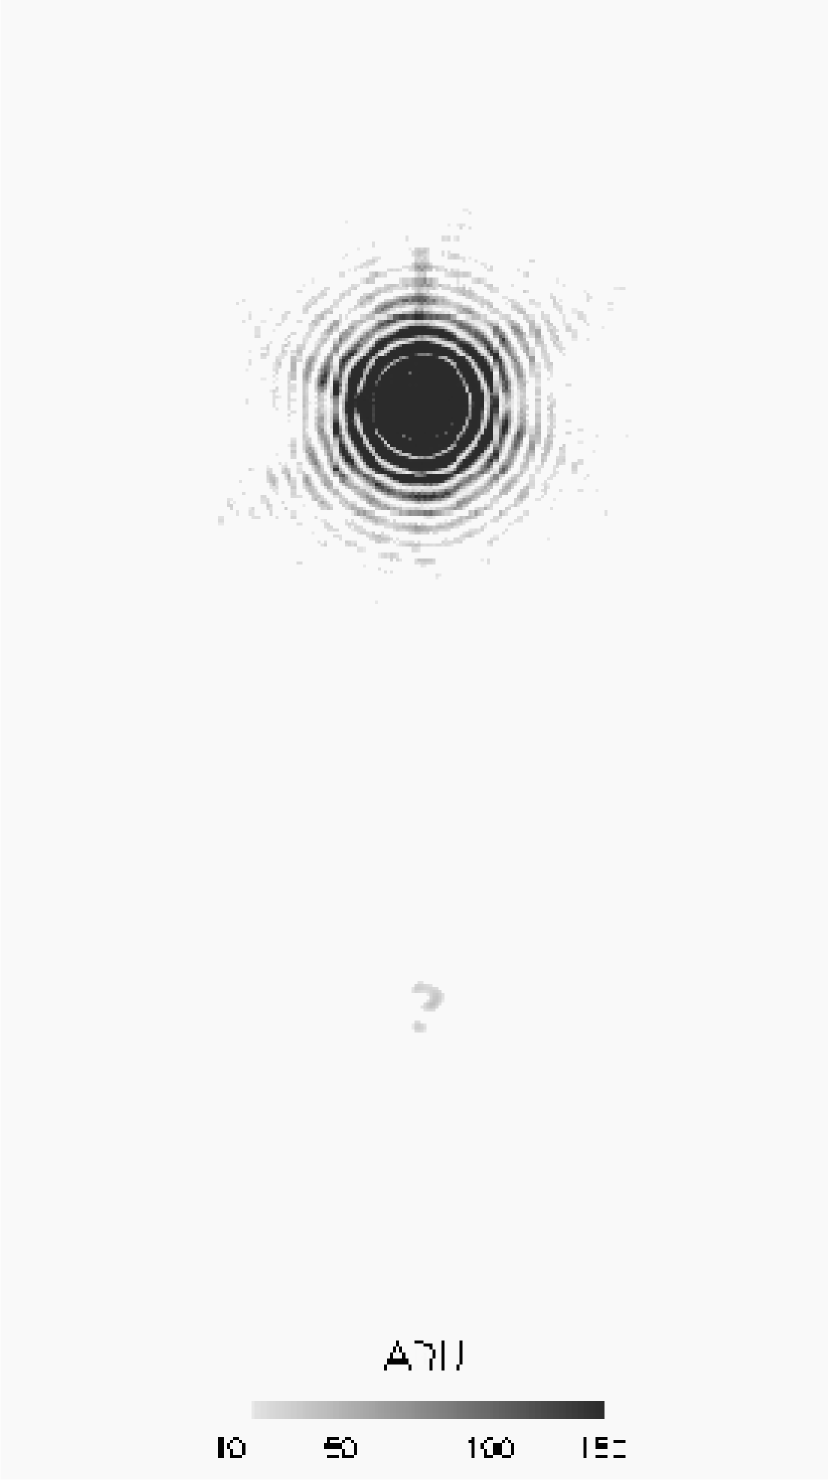
Once the peak pixel count rates and fluxes were measured, deep observations of the notch-filter mask were taken. Figure 4 shows two images set to the same contrast level and normalized to the same exposure time. The top image is one of the point source without the notch-filter mask in place, and the bottom image is an exposure with the mask centered.
The bar at the bottom shows the number of counts on the detector associated with each level of the greyscale. As can easily be seen, the diffraction pattern of the light source is diminished greatly.
Figure 5 demonstrates a more quantitative comparison with the mask present and absent and the undersized Lyot Stop in place for both configurations. The figure shows the images taken during our experiments azimuthally averaged over all angles except for 20∘ on either side of the notch-filter’s mask axis to avoid the region completely blocked by the mask. The curves are normalized to the peak pixel count rate of the unblocked image. We have converted the spatial scale in pixels to units of by multiplying by a factor of , where is the width of a pixel in µm. By doing this one can scale our results for existing or future telescopes. It is important to note that this scale reflects the degradation of spatial resolution due to a Lyot Stop that is undersized. The diffraction pattern is clearly suppressed by at least 2 orders of magnitude within 10, with a contrast of 9.5 reached at 3. In the course of our experiments we found that the mask was not completely opaque, allowing a small fraction of light transmission. We measured the magnitude of this mask transmisivity (MT) as well with the Lyot Stop in place and show it in Figure 5 for comparison. It appears that most of the residual light corresponds to the wings of this transmission.
Table 1 allows us to compare the relative throughput of the notch-filter mask to a setup without a Lyot stop. We define throughput as the ratio of flux for a certain design to the flux of the system with a completely open Lyot stop and no mask in place. We also measured the point source through the quartz substrate of the mask. As can be seen, the throughput of the notch-filter mask+Lyot stop combination is 27%.
5 Discussion
Our experiments did not attain the mask performance levels expected from scalar diffraction theory. In this section we will quantify the effect of some errors that degraded the contrast, and speculate on the potential uses of this mask for space-based planet searches.
MT, the finite size of the point source, mask alignment errors, and mask fabrication errors all combine to explain the degraded performance of the notch filter mask. These effects can be estimated and collected into an error budget to guide further testing of the mask and drive improvements in our setup.
The MT for dark parts of the mask should be less than the contrast requirements. Degradation from light transmission can be estimated by assuming a by hole in the mask with fractional transmission . The central intensity of the leakage would be as found in Kuchner & Traub (2002).
The transmission flux measured in Table 1 is times the unblocked point source, giving a transmission peak intensity of 7.5 . This is larger than what is observed at the center, but one can estimate what would be expected further away–the PSF is 10-2 the peak at the first Airy ring, which for the transmission gives an intensity of , which is more consistent with what is seen further from the center. The mask may not be uniformly transmissive and slightly thicker toward the center, which could account for the suppression of the peak core. The opaque parts of the mask are covered by a 105 nm thick layer of chromium; if this layer is doubled or tripled it will push the MT to
If the error in alignment with respect to the mask is larger than the physical size of the point source, then the leakage is where is the error in alignment and is the half power position of the mask (Kuchner & Traub, 2002). The size of our single mode fiber core, 5 , ensures that the leakage due to it is the leakage due to misalignment of the mask. We have measured the half power of the mask to be 8 pixels or 192 in the focal plane. Our precision stage had an estimated accuracy of 16 , based on half the value of the smallest movement possible in the focal plane. The leakage would be that of the unblocked point source.
The surface roughness of our lenses will dictate the levels of scattered light we should observe and allow us to estimate the contribution of scattered light to the degradation in contrast. We measured the surface roughness of one of our lenses with a profilometer at Nanofab and obtained an estimate of the RMS roughness (See Elson & Bennett (1979)). Scattered light levels are , assuming a collection of plane gratings that diffract (scatter) light into angles of interest. This formalism is for an opaque surface that reflects light. However, the results for a series of uncorrelated surfaces (i.e. an optical setup of many lenses) give similar results provided that the roughness is separated on scales (Elson et al., 1983). We find that the RMS roughness of the lens is .4 nm, which can be compared to the measured roughness of HST, 5.5 nm. Therefore we estimate that the scattered light levels should be less than that of HST, corresponding to a contrast level of , where is in multiples of (Brown & Burrows, 1990; Malbet et al., 1995). This corresponds to a scattered light level of 9 at 3 and at . More accurate measurements and analysis are needed to better quantify the limitations of scattered light in the lab, as the above comparison is not necessarily accurate with such small scattering angles (Brown & Burrows, 1990).
MT and scattered light dominate the source of errors at 3, which is consistent with what is seen in Figure 5. The resulting PSF with the notch-filter mask resembles the MT PSF, close to the PSF core, where the residual Airy Pattern of the MT dominates. Further from the core the Airy pattern is less distinct, most likely due to speckles from light scattered from the microroughness of our lenses.
A Lyot stop of diameter 2.4 mm should have sufficed for a contrast of 10-6. Experimentally we found that an undersized Lyot stop with 75% the diameter of the theoretical design appeared more efficacious. This was based on an initial belief that the degradation was caused by excess scattered light or slight misalignments of the Lyot stop and the optical beam. In those cases, undersizing the Lyot Stop would compensate for low levels of leakage. However, since it is apparent that the main cause of the degradation in contrast is due to the MT, undersizing the stop simply reduces throughput.
The design “as-is” already could have significant science benefits in space. Observations at the scattered light limit of HST coupled with PSF subtraction (shown to give an improvement of contrast of around a factor of 50-100) could yield contrast levels of (Schneider & Silverstone, 2003; Grady et al., 2003). For HST, the Lyot stop would need to be designed such that the central obscuration and support pads would be adequately blocked at a cost in throughput. The Lyot stop would be the overlap of three HST pupils, just as in the ideal case. If we assume that with sufficient integration time we can reliably detect planets at this contrast level we can speculate how useful HST would be for a planet search. An instrument on HST optimized for coronagraphy could become a test bed for future TPF coronagraph technology. This setup would allow a limited extrasolar planet direct imaging survey around nearby stars and white dwarfs. As an example we consider our reported contrast at 3 in the J band on HST with PSF subtraction. Given the best results one could expect J=17.5 and observe 1 Gyr old 3 MJup planets 10 AU from their host stars out to 30 pc and a 10-100 Myr old 2 at 6.3 AU around Pictoris (Burrows et al., 2003).
References
- Baudoz et al. (2000a) Baudoz, P., Rabbia, Y., & Gay, J. 2000a, A&AS, 141, 319
- Baudoz et al. (2000b) Baudoz, P., Rabbia, Y., Gay, J., Burg, R., Petro, L., Bely, P., Fleury, B., Madec, P.-Y., & Charbonnier, F. 2000b, A&AS, 145, 341
- Brigham (2003) Brigham, E. 2003, The fast Fourier transform and its applications (Prentice Hall)
- Brown & Burrows (1990) Brown, R. A. & Burrows, C. J. 1990, Icarus, 87, 484
- Burrows et al. (2003) Burrows, A., Sudarsky, D., & Lunine, J. 2003, ArXiv Astrophysics e-prints
- Debes et al. (2002) Debes, J. H., Ge, J., & Chakraborty, A. 2002, ApJ, 572, L165
- Debes et al. (2003) Debes, J. H., Ge, J., Mandelowitz, C., & Watson, A. 2003, in High-Contrast Imaging for Exo-Planet Detection. Edited by Alfred B. Schultz. Proceedings of the SPIE, Volume 4860, pp. 138-148 (2003)., 138–148
- Elson & Bennett (1979) Elson, J. M. & Bennett, J. M. 1979, Optical Society of America Journal, 69, 31
- Elson et al. (1983) Elson, J. M., Rahn, J. P., & Bennett, J. M. 1983, Appl. Opt., 22, 3207
- Ge et al. (2002) Ge, J., Debes, J. H., Watson, A., & Chakraborty, A. 2002, in Future Research Direction and Visions for Astronomy. Edited by Dressler, Alan M. Proceedings of the SPIE, Volume 4835, pp. 87-97 (2002)., 87–97
- Grady et al. (2003) Grady, C. A., Proffitt, C. R., Woodgate, B., Bowers, C. W., Heap, S. R., Kimble, R. A., Lindler, D., Plait, P., & Weinberger, A. 2003, PASP, 115, 1026
- Kasdin et al. (2003) Kasdin, N. J., Vanderbei, R. J., Spergel, D. N., & Littman, M. G. 2003, ApJ, 582, 1147
- Kuchner (2004) Kuchner, M. 2004, submitted to ApJ, astro-ph/o401256
- Kuchner & Spergel (2003a) Kuchner, M. J. & Spergel, D. N. 2003a, in ASP Conference Series 294, Scientific Frontiers In Research In Extrasolar Planets, ed. D. Deming & S. Seager (2003)
- Kuchner & Spergel (2003b) Kuchner, M. J. & Spergel, D. N. 2003b, ApJ, 594, 617
- Kuchner & Traub (2002) Kuchner, M. J. & Traub, W. A. 2002, ApJ, 570, 900
- Malbet (1996) Malbet, F. 1996, A&AS, 115, 161
- Malbet et al. (1995) Malbet, F., Yu, J. W., & Shao, M. 1995, PASP, 107, 386
- Riaud et al. (2001) Riaud, P., Boccaletti, A., Rouan, D., Lemarquis, F., & Labeyrie, A. 2001, PASP, 113, 1145
- Rouan et al. (2000) Rouan, D., Riaud, P., Boccaletti, A., Clénet, Y., & Labeyrie, A. 2000, PASP, 112, 1479
- Schneider & Silverstone (2003) Schneider, G. & Silverstone, M. D. 2003, in High-Contrast Imaging for Exo-Planet Detection. Edited by Alfred B. Schultz. Proceedings of the SPIE, Volume 4860, pp. 1-9 (2003)., 1–9
- Sivaramakrishnan et al. (2001) Sivaramakrishnan, A., Koresko, C. D., Makidon, R. B., Berkefeld, T., & Kuchner, M. J. 2001, ApJ, 552, 397
- Soummer et al. (2003a) Soummer, R., Aime, C., & Falloon, P. E. 2003a, A&A, 397, 1161
- Soummer et al. (2003b) Soummer, R., Dohlen, K., & Aime, C. 2003b, A&A, 403, 369
- Vanderbei et al. (2003) Vanderbei, R. J., Spergel, D. N., & Kasdin, N. J. 2003, ApJ, 590, 593
| Configuration | Flux | Peak Pixel Count Rate |
|---|---|---|
| (ADU s-1 cm-2) | (ADU s | |
| Notch-filter glass | 7 | 2.2 |
| No Mask | 8.0 | 2.4 |
| No Mask, No stop | 2.6 | 1.9 |
| Mask Transmissivity | 2.3 | 7.2 |