An Instrument to Measure the Temperature of the Cosmic Microwave Background Radiation at Centimeter Wavelengths
Abstract
The Absolute Radiometer for Cosmology, Astrophysics, and Diffuse Emission (ARCADE) is a balloon-borne instrument to measure the temperature of the cosmic microwave background at centimeter wavelengths. ARCADE uses narrow-band cryogenic radiometers to compare the sky to an external full-aperture calibrator. To minimize potential sources of systematic error, ARCADE uses a novel open-aperture design which maintains the antennas and calibrator at temperatures near 3 K at the mouth of an open bucket Dewar, without windows or other warm objects between the antennas and the sky. We discuss the design and performance of the ARCADE instrument from its 2001 and 2003 flights.
Subject headings:
instrumentation: balloons, cosmic microwave background, cosmology: observations1. Introduction
The cosmic microwave background is a thermal relic from a hot, dense phase in the early universe. Deviations from a perfect blackbody spectrum carry information on the energetics of the early universe. Measurements across the peak of the spectrum limit deviations from a blackbody to less than 50 parts per million (Fixsen et al., 1996; Gush et al., 1990). Direct observational limits at longer wavelengths, though, are weak: distortions as large as 5% could exist at wavelengths of several centimeters or longer without violating existing observations.
Plausible physical processes can generate observable distortions at long wavelengths without violating limits established at shorter wavelengths. The decay of massive particles produced near the Big Bang imparts a chemical potential to the CMB, creating a deficit of photons at long wavelengths (Sunyaev & Zeld́ovich, 1970; Silk & Stebbins, 1983; Burigana et al., 1995; McDonald et al., 2001; Hansen & Haiman, 2004). Reionization of the universe by the first collapsed structures distorts the spectrum through thermal bremsstrahlung by the ionized gas, characterized by a quadratic rise in temperature at long wavelengths (Bartlett & Stebbins, 1991). Reionization is expected to produce a cosmological free-free background with amplitude of a few mK at frequency 3 GHz (Haiman & Loeb, 1997; Oh, 1999). Such a signal is well below current observational limits, which only constrain free-free distortions to mK at 3 GHz (Bersanelli et al., 1994).
Detecting the signal from reionization requires accuracy of order 1 mK at frequencies below 30 GHz. Coherent receivers using High Electron Mobility Transistor (HEMT) amplifiers can easily achieve this sensitivity, leaving systematic error as the limiting uncertainty in previous CMB measurements below 30 GHz (see Kogut (1992) for an experimental review). These fall into 3 categories. Below 2 GHz the dominant uncertainty is synchrotron emission within the Galaxy. Ground-based measurements at higher frequencies are limited by atmospheric emission, while balloon-borne experiments have been limited by emission from warm parts of the instrument. The Absolute Radiometer for Cosmology, Astrophysics, and Diffuse Emission (ARCADE) is a fully cryogenic, balloon-borne instrument designed to avoid these sources of systematic error and provide new limits on deviations from a blackbody spectrum at centimeter wavelengths comparable to the limits established at millimeter wavelengths.
ARCADE represents a long-term effort to characterize the CMB spectrum at cm wavelengths in order to constrain the thermal history of the early universe. An engineering flight designed to test the cold open optics launched from Ft Sumner, NM on November 2 2001 UT. A second flight, optimized for CMB observations, launched from Palestine, TX on June 15 2003 UT. Scientific analysis of the 2003 flight is presented by Fixsen et al. (2004). We describe the design of the ARCADE instrument and discuss its performance during the 2001 and 2003 flights.
2. Instrument Design
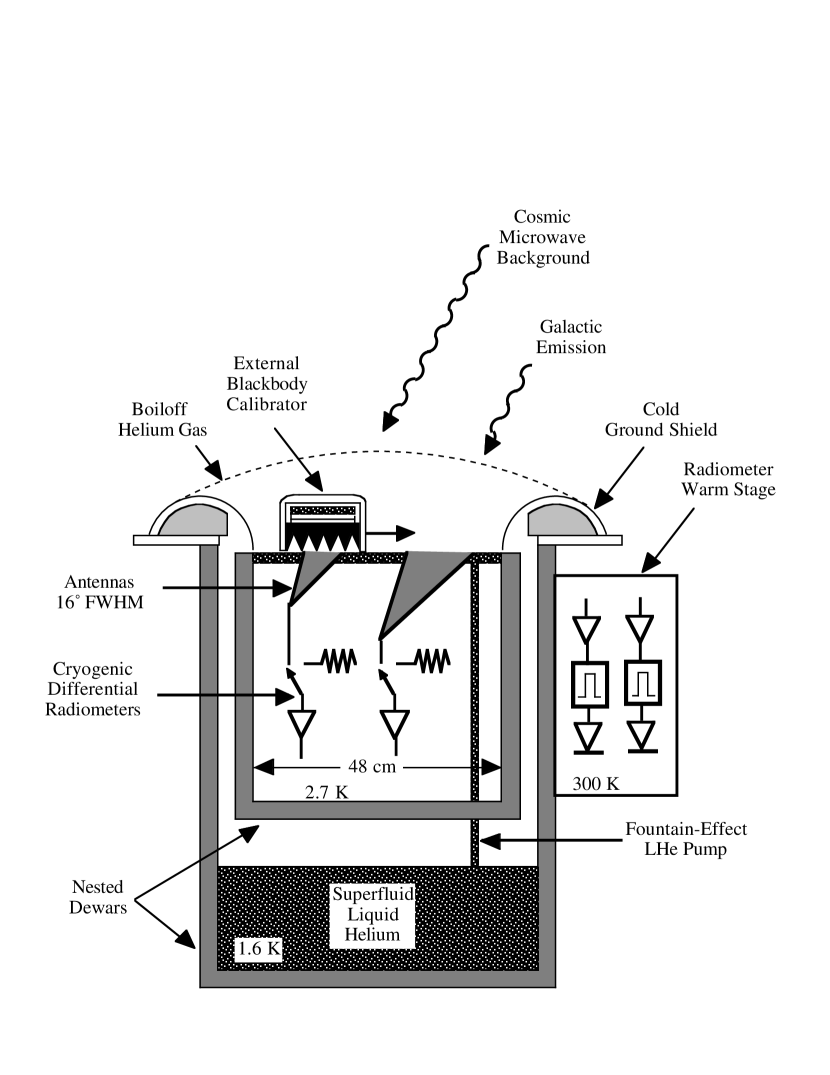
Figure 1 shows an overview of the ARCADE instrument design. It consists of a set of narrow-band cryogenic radiometers observing at frequencies 10 and 30 GHz from a balloon payload at 35 km altitude. Each radiometer measures the difference in power between a beam-defining corrugated horn antenna (16° full width at half maximum) and a temperature-controlled internal reference load. An independently controlled external blackbody calibrator (emissivity ) covers each antenna aperture in turn, so that each antenna alternately views the sky or a known blackbody. The calibrator, antennas, and radiometers are maintained near 2.7 K at the mouth of an open bucket Dewar with no windows or other warm object between the antennas and the sky. Fountain-effect pumps lift superfluid liquid helium to reservoirs at the antenna aperture plane and inside the external calibrator to maintain cryogenic temperatures. Boiloff helium gas from the main Dewar tank vents through the aperture plane to provide additional cooling and prevent the condensation of atmospheric nitrogen on the optics.
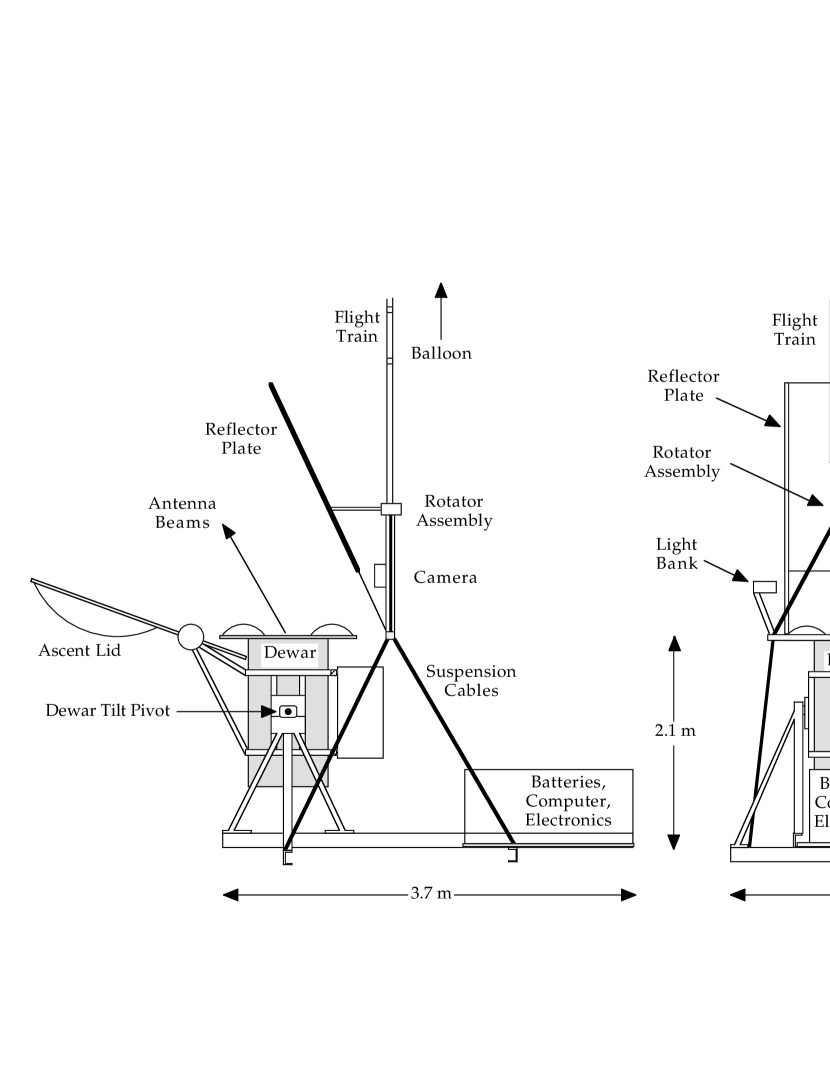
Figure 2 shows the entire payload. The Dewar is mounted on a gondola suspended 64 m below the balloon. Batteries and flight electronics mounted on a movable pallet at the other end of the gondola from the Dewar serve as counterweights, allowing the suspension to be located well away from the antenna apertures. A deployable lid covers the optics during launch and ascent and can be commanded open or closed at float. The antennas view the sky 30° from the zenith to avoid direct view of the balloon or flight train. A metallized foam reflector plate attached to the suspension shields the flight train, parachute, termination package, and part of the balloon from direct view of the antennas. The dewar can be commanded to tip at angles up to 25° from vertical, changing the orientation of the antennas with respect to the balloon and reflector. The electronics pallet can also be moved in flight to trim the gondola pitch. During nominal operation the dewar is vertical while the gondola rotates at approximately 0.5 RPM to scan the antennas around a ring 30° from the zenith. No pointing control is required; magnetometers and inclinometers allow pointing reconstruction within 3°. A Global Positioning System receiver collects position and altitude information. Table 1 summarizes the payload.
2.1. Radiometers
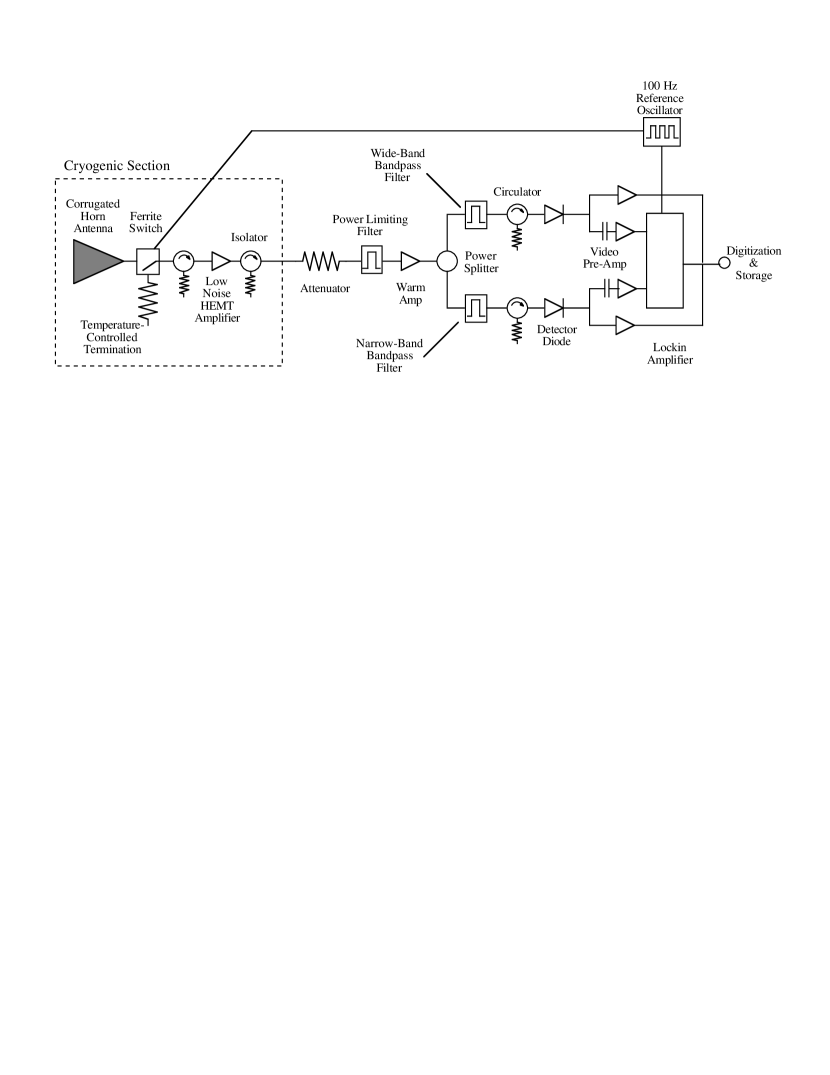
Figure 3 shows a block diagram of the radiometers. Each radiometer uses a cryogenic HEMT-based front-end amplifier. They are switched at 100 Hz between a corrugated conical horn antenna and a temperature-controlled waveguide load using latching ferrite waveguide switches with measured insertion loss below 0.4 dB. The low insertion loss greatly reduces requirements for thermal monitoring and control of the instrument front end. All of the radiometer back ends are housed in a temperature-controlled module mounted to the outside of the dewar, with stainless steel waveguide (30 GHz) or coax (10 GHz) providing the RF link between the cryogenic and room-temperature components. The back end of each radiometer is split into two frequency sub-channels: a wide-band channel for maximum sensitivity, and a narrow-band channel restricted to protected RF bands. Video preamplifiers following each detector diode separately amplify the dc and ac portions of the signal, proportional to the total power on the diode and the antenna-load temperature difference, respectively. A lockin amplifier demodulates the switched (ac) signal and integrates for one second to produce an output proportional to the difference in power between the antenna and the internal load. The lockin output, total power, and assorted housekeeping voltages are digitized at 1 Hz and stored in an on-board computer. Table 2 summarizes the radiometer properties.
The internal reference load has a dual purpose: it provides a stable cold reference for the fast gain chop, and can be adjusted in temperature during flight to eliminate the radiometric offset resulting from imbalance in the switch or the two arms of the radiometer. The reference load consists of a waveguide termination mounted on a temperature-controlled plate. Temperature control and readout consist of individually calibrated ruthenium oxide thermistors in a digitally controlled proportional-integral-differential loop.
2.2. Antennas And Beam Pattern
Each receiver is fed by a corrugated conical horn antenna scaled in wavelength to produce identical beam shapes at 10 and 30 GHz. To avoid convective instabilities in the helium vapor barrier, the instrument should remain nearly vertical during observations. We reconcile this requirement with the need for sky coverage (and avoiding direct view of the balloon) by mounting the antennas at a 30° angle from the zenith, slicing each antenna at the aperture plane. Quarter-wave chokes surround the resulting elliptical aperture and provide further suppression of side lobes. Stainless steel flares at the dewar rim function as a cold (20 K) ground shield to block emission from the Earth.
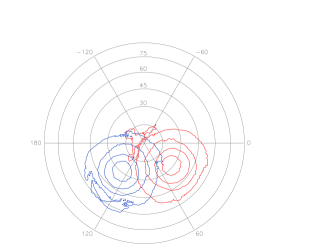
We measured the co-polar and cross-polar beam patterns of each radiometer over sr at the Goddard Electro-Magnetic Anechoic Chamber. Beam mapping used the entire dewar in flight configuration, including the flares and external calibrator. Figure 4 shows the co-polar beam patterns at 10.1 and 30.3 GHz in a stereographic projection centered on the dewar aperture plane. The beam centroids are located 30° from the zenith with azimuthal separation 90°. Despite the sliced geometry, the beams retain circular symmetry past -10 dB, with full width at half maximum 16° at both 10 and 30 GHz. The deformation evident at -30 dB towards low elevation angles shows the effect of the nearby cold flares.
| Property | 2001 | 2003 |
| MassaaMass at launch, excluding ballast (kg) | 1148 | 1183 |
| Mean Power (W) | 326 | 325 |
| Peak Power (W) | 470 | 925 |
| Float Altitude (km) | 29.5 | 34.7 |
| Float Pressure (Torr) | 10 | 4.5 |
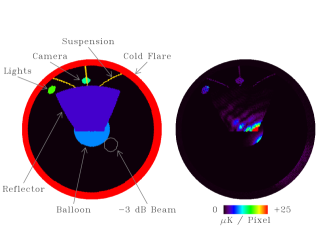
Warm objects in the beam contribute to the measured sky signal. We reduce the contribution from the flight train by mounting a reflective plate to the gondola suspension and extending over the Dewar aperture. The reflector plate consists of metallized foam and blocks direct view of the rotator assembly, ladder, parachute, and termination package while partially obscuring the balloon. We model emission from the suspension, reflector, and balloon by convolving the temperature, emissivity, and position of these objects with the measured beam patterns. Figure 5 shows the relevant geometry. The reflector re-directs the part of the beams that would otherwise view the flight train to blank regions of the sky. Emission from the plate is comparable to emission from the flight train hidden behind it, but is much simpler to model. Table 3 summarizes the contribution of each element as a function of Dewar tip angle. In normal operation with the Dewar vertical, warm parts of the instrument contribute a predicted 10.8 mK to the sky temperature. Tipping the Dewar back toward the electronics pallet moves the beams closer to the balloon and reflector, while tipping forward reduces the signal. The predicted signal modulation can be observed in flight (Fixsen et al., 2004).
2.3. External Calibrator
The determination of the sky temperature rests on the comparison of the sky to an external blackbody calibrator, described in Kogut et al. (2004). The external calibrator consists of a microwave absorber (Eccosorb CR-112, an iron-loaded epoxy) cast with grooves in the front surface to reduce reflections. The Eccosorb is mounted on a thermal buffer consisting of an alternating series of thin copper and fiberglass plates. Thermal control is achieved by heating the outermost copper plate, which is in weak thermal contact with a superfluid helium reservoir inside the target housing. Fountain-effect pumps lift liquid helium from the main Dewar to the calibrator. Reflective multilayer insulation surrounds the calibrator housing. The calibrator is mounted on a rotating mechanism to allow it to completely cover either antenna aperture while the other antenna views the sky. The antennas view the calibrator 30° from normal incidence. Measurements with the calibrator over each antenna limit the in-band power reflection coefficient to below -35 dB. We monitor the calibrator temperature at 7 locations within the Eccosorb and on the copper thermal control plate. Data taken it situ with the target immersed in liquid helium during 8 independent calibrations spaced 4 years apart agree within 2 mK, providing an independent verification of the thermometer calibration at temperatures near that of the cosmic microwave background.
| 10 Wide | 10 Narrow | 30 Wide | 30 Narrow | |
| Band Pass (GHz) | 9.5 - 10.6 | 10.6 - 10.7 | 28.4 - 31.3 | 31.3 - 32.3 |
| Switch Isolation (dB) | 25 | 25 | 25 | 25 |
| Switch Insertion Loss (dB) | 0.4 | 0.3 | 0.3 | 0.3 |
| Cold Stage Gain (dB) | 36 | 35 | 28 | 26 |
| Total RF Gain (dB) | 63 | 74 | 64 | 74 |
| System Temperature (K) | 12 | 12 | 77 | 77 |
| Sensitivity (mK Hz-1/2) | 0.7 | 2.3 | 2.8 | 4.8 |
| Beam FWHM (degrees) | 16 | 16 | 16 | 16 |
2.4. Gondola Electronics
The gondola electronics consist of a flight computer, telemetry system, magnetometer-inclinometer box, drive electronics for the various motors, analog interface unit, and central electronics box. The central electronics box houses the ambient temperature and pressure readout electronics, voltage and current measuring modules, relay boards and the power distribution system, and various other electronics. The analog interface unit contains 48 16-bit A/D channels and 12 12-bit D/A channels. This unit communicates with the flight computer which consists of a i486-based embedded computer running a multi-tasking, real-time operating system. The computer assembly contains a hard disk capable of storing an entire flight’s worth of data. The flight computer communicates with the cryogenic temperature sensor readout electronics (Fixsen et al., 2002) via an asynchronous serial (RS-232) interface. Flight data are stored on-board and relayed to the ground using a discriminator channel on the Consolidated Instrument Package (CIP) provided by the National Scientific Balloon Facility (NSBF). Commands are sent to the flight computer via our 408 MHz telemetry uplink that allows 4800 baud ASCII data communication.
A video camera mounted on the reflector above the Dewar aperture allows direct imaging of the cold optics in flight. Two banks of light-emitting diodes provide the necessary illumination. Ground tests revealed interference from the video transmitter in the 10 GHz wide channel. We do not use data from any channel for science analysis during times when the camera and video transmitter are turned on.
3. Cryogenic Design And Performance
ARCADE uses cryogenic optics and calibrator on a 48-cm diameter clear aperture operating without windows at temperatures near 2.7 K. To eliminate any spillover of the antenna beams onto warm portions of the Dewar walls, the antenna apertures and external calibrator are located at the mouth of an open bucket Dewar. Two fountain-effect superfluid pumps move helium from the main Dewar into a reservoir located inside the calibrator; a third pump lifts liquid helium to cool the aperture plane. Boiloff gas from the 220 liter main tank vents through pinholes in the metal mounting plate holding the antenna apertures, providing additional cooling through the enthalpy of the helium gas while providing a buffer between the optics and the atmosphere.
3.1. Thermometry
We monitor cryogenic temperatures using 4-wire ac resistance measurements of 27 ruthenium oxide thermometers read out every 1.067 seconds (Fixsen et al., 2002). Seven of the thermometers are located in the external calibrator. Eight additional thermometers monitor critical temperatures (antenna throat, internal load, Dicke switch, and cryogenic HEMT amplifier) on each of the 2 radiometers. The remaining thermometers monitor the temperature of the aperture plane, cold flares, superfluid pumps, liquid helium reservoirs (main tank, aperture plane, and external calibrator) as well as the Dewar walls and the instrument support structure inside the Dewar.
The in-flight thermometry compares the resistance of each thermometer to a set of 4 calibration resistors spanning the dynamic range of the thermometer resistances. The calibration resistors are part of the readout electronics board, located in a temperature-controlled enclosure. One of the calibration resistors includes the electrical harness into the Dewar to monitor possible effects from electrical pickup or stray capacitance. The flight computer uses a lookup table to infer a temperature for each thermometer using temperature-resistance curves derived from ground tests. The instrument is mainly a transfer standard to compare the sky to the external calibrator target; precise knowledge of the absolute temperature is required only for the external calibrator. The resistance to temperature calibration for the thermometers in the external calibrator was obtained multiple times over several years by measuring the resistance of the embedded thermometers with the calibrator submerged in liquid helium, as the pressure over the bath was slowly lowered. Observations of the superfluid helium transition at 2.1768 K using the flight readout electronics agree within 0.3 mK over multiple calibrations spaced 4 years apart, providing a cross-check on the absolute thermometry. Thermal gradients during the calibration process degrade the absolute accuracy to 2 mK at temperatures near 2.7 K.
3.2. Heat Flow
The ARCADE instrument is mounted at the mouth of an open fiberglass/aluminum composite bucket Dewar manufactured by Precision Cryogenics. The inner diameter is 61 cm with a fiberglass top section extending 38 cm to reduce heat flow from the aluminum body. The aluminum bottom section holds 220 liters of liquid helium. The heat leak to the cryogen is dominated by thermal conduction down the walls. Typical boiloff rates are 12 liters hr-1 on the ground with the ascent lid closed, 32 liters hr-1 during ascent, and 15 liters hr-1 at float when we activate a boiloff heater in the main reservoir to provide additional outflow of cold gas. The Dewar is unpressurized and vents through the aperture plane so the liquid remains near ambient pressure. The 2003 flight launched with 140 liters of liquid helium in the main reservoir, falling to 53 liters at float to provide 3.5 hours of cryogenic observations.
Fountain-effect pumps move superfluid liquid helium from the main reservoir to separate reservoirs below the aperture plane and in the external calibrator housing. Each pump consists of a 1.3 cm diameter porous plug (CoorsTek P-1/2-BC ceramic disk with pore diameter less than 0.5 m) mounted in a leak-tight housing. A resistive heater warms the liquid inside the housing 80 mK above the 1.56 K bath temperature, creating enough pressure (35 Pa) to lift the liquid helium 130 cm to the reservoirs at the top of the Dewar. Two pumps (a primary and a backup) service the target with a third pump allocated to the aperture plane. Each pump can lift approximately 2.8 liters hr-1 liquid helium, providing 2.6 W cooling each through the latent heat of the liquid. Boiloff gas from the main reservoir provides additional cooling to the aperture plane through the enthalpy of the cold gas.
3.3. Atmospheric Condensation
The cryogenic performance of the ARCADE depends on interactions between ambient nitrogen and the cold helium efflux at pressures below 5 Torr. Gaseous helium is denser than the ambient nitrogen at float altitude provided the helium remains colder than 20 K. The mixing as the helium warms and the nitrogen cools is complicated and difficult to simulate in pressure chambers on the ground, which are not designed to maintain a dilute nitrogen atmosphere in the presence of a large (12 m3 hr-1) helium gas source.
| Component | Dewar Tip AngleaaPositive angles tip the Dewar forward and the antenna beams away from the zenith. | ||||
|---|---|---|---|---|---|
| -10 | -5 | 0 | 5 | 10 | |
| Balloon | 2.1 | 1.4 | 0.7 | 0.2 | 0.1 |
| Reflector | 25.6 | 10.6 | 4.8 | 2.4 | 1.3 |
| Camera | 0.4 | 0.2 | 0.2 | 0.1 | 0.1 |
| Lights | 0.2 | 0.2 | 0.3 | 0.3 | 0.2 |
| Suspension | 4.7 | 3.9 | 3.2 | 2.5 | 1.8 |
| Cold Flares | 1.4 | 1.4 | 1.4 | 1.4 | 1.4 |
| Ground | 0.3 | 0.3 | 0.4 | 0.4 | 0.4 |
| Total | 34.7 | 18.1 | 10.8 | 7.4 | 5.3 |
The efflux of helium gas above the aperture does not eliminate condensation of atmospheric nitrogen onto the cryogenic optics, but does reduce it to levels compatible with the desired CMB observations. Flight data show excess heat dissipation on the aperture plane, consistent with an accumulation rate of approximately 200 g hr-1 of nitrogen onto the aperture, a heat source of order 6 W. Visual examination using the video camera confirms this slow accumulation of nitrogen ice, with several mm of “frost” visible on the optics an hour after opening the ascent lid. Nitrogen ice is nearly transparent at cm wavelengths; since the ice cools to the same temperature as the rest of the optics, modest accumulations primarily affect only mechanical operations. The 2003 flight included a large (kW) heater on the cold optics, including the antenna aperture and throat sections. With the superfluid pumps off, the aperture plane and calibrator have only weak thermal coupling to the Dewar. Raising the aperture plane and calibrator above 80 K for 15 minutes suffices to remove accumulated nitrogen ice without only a modest impact on the main liquid helium reservoir.
4. Discussion
Both the 2001 and 2003 flights demonstrate the viability of large open-aperture cryogenic optics for CMB measurements. The ARCADE cryogenic design maintains the external calibrator, antennas, and cryogenic radiometers at temperatures near 2.7 K for many hours at 35 km altitude. Cold boiloff gas vented through the aperture plane reduces condensation of atmospheric nitrogen to levels consistent with the desired CMB observations; the primary impact is the cooling required to handle the additional heat load on the aperture. The current instrument is relatively small (two frequency channels at 10 and 30 GHz) and is intended primarily as a pathfinder to verify the cryogenic design under flight conditions. A larger second-generation instrument with 6 channels exending down to 3 GHz is currently under construction and is scheduled to launch in 2005.
References
- Bartlett & Stebbins (1991) Bartlett, J. G. & Stebbins, A. 1991, ApJ, 371, 8
- Bersanelli et al. (1994) Bersanelli, M., Bensadoun, M., de Amici, G., Levin, S., Limon, M., Smoot, G. F., & Vinje, W. 1994, ApJ, 424, 517
- Burigana et al. (1995) Burigana, C., De Zotti, G., & Danese, L. 1995, å, 303, 323
- Fixsen et al. (1996) Fixsen, D. J., Cheng, E. S., Gales, J. M., Mather, J. C., Shafer, R. A., & Wright, E. L. 1996, ApJ, 473, 576
- Fixsen et al. (2004) Fixsen, D. J., Kogut, A., Levin, S., Limon, M., Lubin, P. M., Mirel, P., Seiffert, M., & Wollack, E. 2004, ApJ, submitted
- Fixsen et al. (2002) Fixsen, D. J., Mirel, P. G. A., Kogut, A., & Seiffert, M. 2002, Rev. Sci. Inst., 73, 3659
- Gush et al. (1990) Gush, H. P., Halpern, M., & Wishnow, E. H. 1990, Phys. Rev. Lett., 65, 537
- Haiman & Loeb (1997) Haiman, Z. & Loeb, A. 1997, ApJ, 483, 21
- Hansen & Haiman (2004) Hansen, S. H. & Haiman, Z. 2004, ApJ, 600, 26
- Kogut (1992) Kogut, A. 1992, in Current Topics in Astrofundamental Physics, ed. N. Sanchez & A. Zichichi (Singapore: World Scientific), 137
- Kogut et al. (2004) Kogut, A., Fixsen, D. J., Levin, S., Limon, M., Lubin, P. M., Mirel, P., Seiffert, M., & Wollack, E. 2004, Rev. Sci. Inst., submitted
- McDonald et al. (2001) McDonald, P., Scherrer, R. J., & Walker, T. P. 2001, Phys. Rev. D, 63, 023001
- Oh (1999) Oh, S. P. 1999, ApJ, 527, 16
- Silk & Stebbins (1983) Silk, J. & Stebbins, A. 1983, ApJ, 269, 1
- Sunyaev & Zeld́ovich (1970) Sunyaev, R. A. & Zeld́ovich, Y. B. 1970, Ap. Space Sci., 7, 20