NITROGEN AND OXYGEN ABUNDANCE VARIATIONS IN THE OUTER EJECTA OF ETA CARINAE: EVIDENCE FOR RECENT CHEMICAL ENRICHMENT
Abstract
We present optical spectra of the ionized ‘Outer Ejecta’ of Carinae that reveal differences in chemical composition at various positions. In particular, young condensations just outside the dusty Homunculus Nebula show strong nitrogen lines and little or no oxygen — but farther away, nitrogen lines weaken and oxygen lines become stronger. The observed variations in the apparent N/O ratio may signify either that the various blobs were ejected with different abundances, or more likely, that the more distant condensations are interacting with normal-composition material. The second hypothesis is supported by various other clues involving kinematics and X-ray emission, and would suggest that Car is enveloped in a “cocoon” deposited by previous stellar-wind mass loss. In particular, all emission features where we detect strong oxygen lines are coincident with or outside the soft X-ray shell. In either case, the observed abundance variations suggest that Car’s ejection of nitrogen-rich material is a recent phenomenon — taking place in just the last few thousand years. Thus, Carinae may be at a critical stage of evolution when ashes of the CNO cycle have just appeared at its surface. Finally, these spectra reveal some extremely fast nitrogen-rich material, with Doppler velocities up to 3200 km s-1, and actual space velocities that may be much higher. This is the fastest material yet seen in Car’s nebula, but with unknown projection angles its age is uncertain.
1 INTRODUCTION
In the hot interiors of massive stars, the equilibrium CNO cycle converts most of the carbon and oxygen into nitrogen. Through turbulent and rotational mixing (Maeder 1982), or perhaps by stripping of the outer hydrogen-rich envelope by a stellar-wind, these nitrogen-rich ashes from the core may eventually be observed in a massive star’s atmosphere or its ejecta. One spectacular example of N-rich ejecta in a massive star’s circumstellar nebula, in addition to the rings around SN 1987a (Sonneborn et al. 1997; Meaburn et al. 1995), is the ‘Outer Ejecta’ around the evolved massive star Carinae.
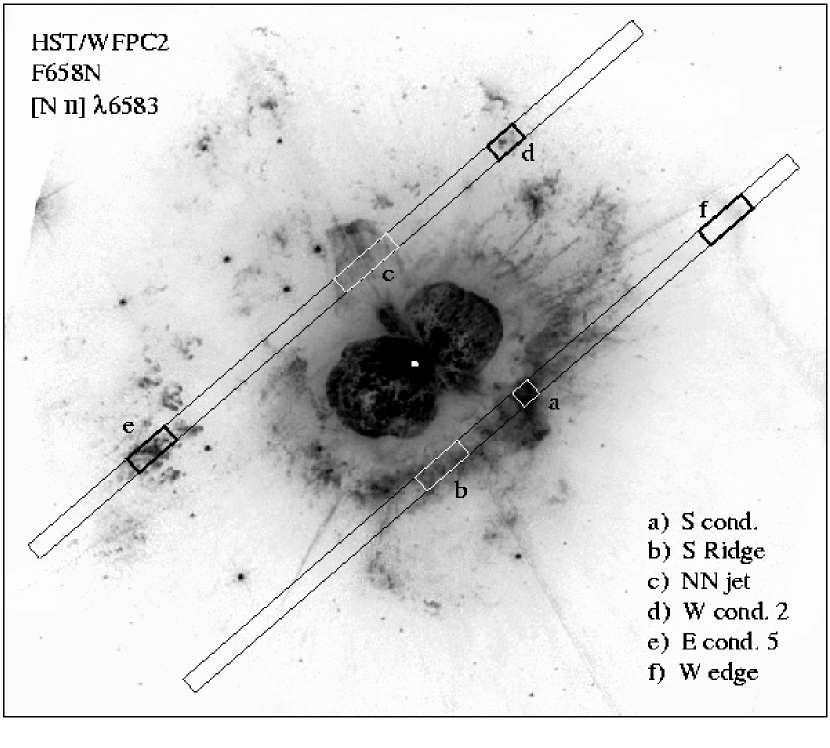
Outside its dusty bipolar reflection nebula known as the ‘Homunculus’, which was ejected in the mid-19th century, Carinae is surrounded by a complex aggregate of ionized gas condensations known collectively as the ‘Outer ejecta’, the ‘Outer Shell’, or the ‘Outer Condensations’ (e.g., Walborn 1976; Thackeray 1950; Meaburn et al. 1996). Since these ejecta are ionized, as opposed to mostly neutral and dusty like the Homunculus, they provide a practical way to estimate the chemical abundances of some material recently ejected by Carinae. Some of the more prominent nebular condensations in the outer ejecta have names that are identified in the HST/WFPC2 image in Figure 1 (see Morse 1999; Morse et al. 1998), following the nomenclature of Walborn (1976). Proper motions suggest that some of these condensations may predate Car’s famous 19th century eruption by a few hundred years or more (Walborn et al. 1978, Walborn & Blanco 1988), while some ejecta closer to the Homunculus originated within a few decades of that eruption (Morse et al. 2001). Bright ionized condensations in the outer ejecta coincide with a soft X-ray emitting shell (Seward et al. 2001; Chlebowski et al. 1984), suggesting that they are excited predominantly by shocks, rather than photoionized. Thus, young fast ejecta may be plowing into older material. Davidson et al. (1982, 1986) examined the UV and optical spectrum of the brightest condensation and the brightest X-ray source in the outer ejecta (the ‘S Condensation’) and found it to be extremely nitrogen rich, being almost completely devoid of any oxygen or carbon lines. Thus, ashes of the CNO cycle have been exposed at the star’s surface, confirming that Car is indeed an evolved massive star. Dufour (1989) and Dufour et al. (1997) have also discussed the physical properties and abundances in the S Condensation and some similar nearby ejecta. However, no suitable spectra for examining abundances of other condensations in the Outer Ejecta have been published; consequently, it is usually assumed that all of the Outer Ejecta are nitrogen rich.
Here we present long-slit optical spectra for several positions in Car’s Outer Ejecta. We find that the chemical abundances are not uniform, and we discuss interpretations and evolutionary implications of this conclusion. We present our spectroscopic observations in §2 and discuss the data in §3, including a deductive chemical abundance analysis. In §4 we discuss implications of the non-uniform abundances in the young ejecta around Car, as well as some interesting details of the observed kinematics.
2 OBSERVATIONS
Low resolution ( 700-1600; 2-pixel) spectra from 3600 to 9700 Å were obtained on 2002 March 1 and 2 using the RC Spectrograph on the CTIO 1.5-m telescope. The 7 long and 15 wide slit aperture was oriented at position angle 310, and pointed at two different positions in the nebula around Car as shown in Figure 1. Spectra at each pointing were obtained on two separate nights in two different wavelength ranges (blue: 2600 - 7100 Å, and red: 6250 - 9700 Å), with total exposure times of 1200 s each. Sky conditions were photometric; flux-calibration and telluric absorption correction (at far-red wavelengths) were accomplished using similar observations of the standard stars LTT-3218 and LTT-2415, with airmass correction performed using the CTIO extinction coefficients in IRAF. We estimate that the absolute photometric accuracy of our spectroscopic data is roughly 5 to 10% over most of the observed wavelength range, increasing to between 10 and 20% toward the blue end of the spectrum. Note, however, that our analysis below is based exclusively on relative line intensities.
In the resulting two-dimensional (2-D) spectra, various bright condensations corresponding to ejecta seen in Figure 1 – some with very high Doppler shifts – could be seen superimposed on narrow emission lines from the Carina Nebula H ii region (and some faint narrow sky lines) with constant velocity along the entire length of the slit. We subtracted this relatively smooth background emission by carefully fitting the spectrum on each side of each condensation and interpolating with a second-order polynomial, excluding the bright ejecta from the fit. A careful subtraction like this is critical for interpreting the extracted spectra, and our subtraction method is reliable excluding unresolved variations in the flux from the H ii region on size scales of a few arcseconds.111However, [S iii] 9069 showed some subtraction artifacts (especially in the fainter W2 and W Edge spectra in Figure 2), which may be partially caused by telluric absorption. The spatial scale of a detector pixel was 13.
From these background-subtracted 2-D spectra we then made several one-dimensional (1-D) tracings of individual condensations; the smaller boxes in Figure 1 represent the extracted segments of the slit aperture for each feature. Names for various features are adopted from Walborn (1976) and Meaburn et al. (1993). The blue and red wavelength ranges of these extracted 1-D spectra were then merged to form a single 3600-9700 Å spectrum for each feature with a common dispersion of 2 Å pixel-1. The average of the blue and red segments was taken in the wavelength range near H where the two overlapped. The fluxes of emission lines and faint continuum agreed to within the noise of the data in this overlapping region, suggesting that the flux calibration was reliable from night to night. Figure 2 shows the resulting 1-D optical spectra for several individual condensations through apertures identified with boxes in Figure 1, as well as the average H ii region spectrum sampled a few arcminutes away on either side of Car. The size of the extraction region is also indicated in Figure 2 for each tracing. The spectra probed emission from [O ii] 3727 in the blue out to [S iii] 9532 in the red.
Observed intensities of many relevant lines are listed in Table 1, relative to H=100. Uncertainties in these line intensities vary depending on the strength of the line and the measurement method. Isolated emission lines were measured by taking the integrated flux of the line; for these, brighter lines with 10 typically have measurement errors of a few percent, and weaker lines may have uncertainties of 10 to 15%. In spectra with the lowest signal-to-noise, like W2, uncertainties are typically 10% for bright lines, increasing to 25% for faint lines. In all cases, the uncertainties increase somewhat at the blue edge of the spectrum. Blended pairs or groups of lines were measured by fitting Gaussian profiles. For brighter blended lines like H+[N ii] and [S ii], the measurement uncertainty is typically 5 to 10%. Obviously, errors will be on the high end for faint lines adjacent to bright lines, and errors will be on the low end for the brightest lines in a pair or group, or lines in a pair with comparable intensity (like [S ii]). For faint blended lines, the measurement uncertainties increase; in Table 1, lines with measurement uncertainty of more than about 25 to 30% are listed in parentheses.
3 RESULTS AND ANALYSIS
3.1 Comments on Individual Spectra
S Condensation. The S Condensation appears to be a position in the Outer Ejecta where young material from the Great Eruption is catching-up with older ejecta in the S Ridge (Morse et al. 2001). An upper limit to [O iii] 4949,5007 is given in the tables. A fairly bright line near 5020 Å is seen, but its centroid velocity is 300 km s-1 redder than the Doppler velocity of other lines in the S Condensation, and it is probably the N ii 5011 blend or perhaps [Fe ii] 5018 instead of [O iii] 5007. Therefore, the [O iii] upper limits listed in the tables are based upon a measured upper limit for [O iii] 4949 and a limit for [O iii] 5007 that is 3 times stronger. An upper limit for [O iii] 4363 is not given because the strong line near the expected wavelength is probably [Fe ii] 4358. The [O i] lines at 6300 and 6364 Å are uncertain because they are blended with nearby lines like [S iii] and Si ii, but the intensities of these lines are probably valid to within about 30%. We chose to identify the emission feature at 7325 Å as [Ca ii] instead of [O ii], due to the strength of [Ca ii] 7291. The red spectrum of the S Condensation is similar to spectra observed in Herbig-Haro objects (e.g., HH 47A; Morse et al. 1994), with a wide range of ionization and strong low-excitation forbidden lines of S, N, Fe, Ca, Ni, etc., produced in moderate-velocity radiative shock waves. [Fe ii] 8617 is particularly strong, and is characteristic of dense shocks.
S Ridge. Material in the S Ridge was probably ejected by the star at least several decades before the Great Eruption (Walborn et al. 1978; Morse et al. 2001). Comments made above regarding [O iii] and [O i] lines in the S Condensation apply here as well. In addition, [O ii] 3727,3729 is somewhat uncertain because it is partially blended with the nearby hydrogen lines H13 and H14, and again, the line at 7325 Å is probably [Ca ii] instead of [O ii]. In general, the spectrum of the S Ridge is similar to that of the S and ES Condensations (Dufour et al. 1997), except that hydrogen lines are relatively stronger here. It is perhaps interesting to note that for the S Condensation, hydrogen lines were also relatively stronger than forbidden lines in the spectrum published by Davidson et al. (1986), which was obtained with a larger aperture than we used for the S Condensation.
NN Jet. Like the S Condensation, the NN Jet appears to be younger than the rest of the Outer Ejecta; it probably originated in the Great Eruption (Morse et al. 2001). The spectrum of the NN Jet is dominated by reflected light from Carinae itself (notice the continuum level in the NN Jet spectrum in Figures 2 and 4), indicating a high dust content in the NN Jet, with a clear line-of-sight to the star. Interestingly, there is little or no soft X-ray emission from the position of the NN Jet in recent Chandra images (Seward et al. 2001; we return to this mysterious absence of X-ray emission later). Some relatively weak and blueshifted intrinsic emission from ionized gas can be seen in the 2-D spectra (Figure 4), apparently from the outer bow shock around the “jet”. This emission has strong nitrogen lines and a spectrum qualitatively similar to the S Ridge, with little or no [O ii] and [O iii] emission. However, the kinematics of the ionized gas are complicated, precluding the measurement of accurate line intensities in the low-resolution spectra presented here (for instance, reflected H is blended with [N ii] 6583). Thus, the spectrum of the NN Jet is not included in the discussion below. However, Meaburn et al. (1996) have already discussed the kinematics and emission properties of the NN Jet in considerable detail; their high-resolution spectra show that the NN Jet is nitrogen rich, with [N ii] 6583 roughly 6 times stronger than H (see also Dufour et al. 1997).
W Condensation (W2). The W Condensation identified by Walborn (1976) was not included in either slit position, but a nearby feature that we call “W2” was included in the northeast slit position (see Figure 1). The blob is faint and the observed spectrum is noisy, but it is useful because it shows the relative strengths of [O iii] 4949,5007, [N ii] 6548,6583, and hydrogen lines at this position. [O iii] 4363 and [S iii] 6312 were too faint to measure, so only the [N ii] electron temperature can be deduced here. This spectrum is complicated by multiple velocity components – the [N ii] lines are clearly redshifted by 100 km s-1 with respect to strong hydrogen and oxygen lines (see the inset in Figure 2, for example, and Figure 4). These two components may trace different parts of a shock (see §4.2), or perhaps a mixture of ejections. The redshifted emission is qualitatively similar to that of the E Condensation.
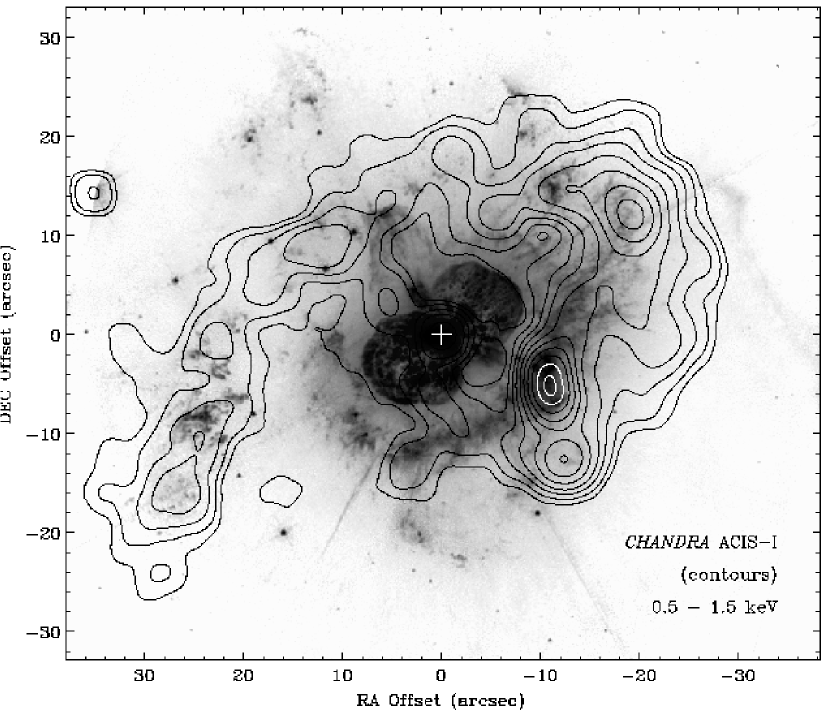
E Condensation (E5). One of our two slit positions passed through a few of the E Condensations identified by Walborn (1976), of which E5 is the brightest (see Figure 1). Like the W Condensation, the E Condensation has several velocity components. The spectrum here is dominated by blueshifted gas at a few hundred km s-1, but there is both slower (nearly rest wavelength) and much faster material as well – see the discussions about kinematics in §4.2 and §4.3. As in the W Condensation, O lines arise in the slowest component. [O i] 6300 and [S iii] 6312 were blended, but appeared to have comparable intensities. The E Condensation is part of the soft X-ray shell seen in Chandra images (see Figure 3).
W Edge. The southwest slit passed through a thin filament at the western edge of Car’s outer ejecta, which has not been discussed before. This feature was visible in some emission lines in the raw 2-D spectra, and the background spectrum extrapolated from either side of the aperture marked in Figure 1 was subtracted. The resulting spectrum is similar to the background H ii region, except for stronger [O ii] 3727,3729, an indication of a slow to moderate velocity shock in an ionized medium (e.g., see the discussion of HH 47D by Morse et al. 1994). The radial velocity of the W Edge is similar to the H ii region to within 50 km s-1. We identify the 7325 Å feature as the [O ii] doublet instead of [Ca ii], because [Ca ii] 7291 is not detected.
Carina Nebula. The average spectrum of the background Carina Nebula was measured in 30-wide extractions of bright areas on either side of Car’s Outer Ejecta (the full slit aperture was roughly 7 long; much longer than shown in Figure 1). Sky subtraction for these areas was performed by subtracting the spectrum in relatively dark areas of the nebula, like the dark patches of extinction in the Keyhole Nebula (Smith 2002; Brooks et al. 2000). Relative line intensities from the background nebula varied along the slit, but the spectrum in Figure 2 is a suitable average representing the H ii region in Car’s vicinity.
3.2 Reddening
We used the observed Balmer decrement in the adjacent Carina Nebula to determine the line-of-sight reddening toward Carinae. Using the extinction law of Cardelli, Clayton, & Mathis (1989) and Case B values for hydrogen line intensities computed by Hummer & Storey (1987), the H and H lines in the Carina Nebula suggested 0.20.5. This is lower than the average value of =0.47 for O stars in the Tr16 cluster, but it is reasonable given the observed range of 0.25 to 0.64 for those same stars (Walborn 1995). This value is low compared to values adopted in previous studies of the S Condensation (0.4 to 0.6; Davidson et al. 1986; Dufour et al. 1997); for this reason, we do not include the [S iii] electron temperature in the analysis below, since it covers a fairly wide wavelength range and is more susceptible to errors from an uncertain reddening correction than the other diagnostics. (The [S iii] lines yielded temperatures of 8,000 to 12,000 K.) Note that is not the usual value of 3.1; dust clouds around the Keyhole Nebula near Car suggest values closer to (Smith 2002; Smith 1987). Although there may be variable extinction across Car’s environment, it is hard to characterize accurately with available data, so we used the same value of = 0.2 to correct line intensities for all the condensations; dereddened intensities are listed in Table 2. Although the H/H ratio varies considerably (as expected when collisions in shock waves enhance the H/H ratio; e.g., Chevalier & Raymond 1978), the resulting dereddened H/H ratios are within 5-10% of the Case B value, indicating that variable extinction is probably not severe. In any case, an incorrect would not undermine the main result of this study: the systematic change in O and N line strengths at various positions.
3.3 Deductive Nebular Analysis
Given the complex kinematics and the non-equilibrium shock physics that may dominate emission from Car’s Outer Ejecta, it is dangerous to place too much weight on a standard deductive nebular analysis. Nevertheless, it is a place to start; the results can guide inputs for future shock models and may be instructive and useful if we keep in mind that they apply to the average properties of the observed condensations. Table 2 lists electron densities for various condensations derived from the [S ii] 6717/6731 ratio, and characteristic electron temperatures derived from the usual [N ii] and [O iii] line ratios. These were calculated using the TEMDEN task in IRAF’s NEBULAR package (see Shaw & Dufour 1994). For the S Condensation, which has already been studied extensively, our value of is somewhat lower than previous estimates, but is reasonably consistent with Davidson et al. (1986) and Dufour et al. (1997), especially considering the variations in these quantities on small spatial scales within the S Condensation itself (Dufour et al. 1997).
A clear trend is seen in Figure 2; namely, from top to bottom, nitrogen lines weaken systematically as oxygen lines get stronger, and the characteristics of the spectra change from a rich shock spectrum to a photoionized H ii region. Since we do not have corresponding UV spectra for all observed features, and consequently, we lack information on critical ionization stages like N++ and higher, it is not immediately clear whether this trend is due to ionization or an abundance gradient. Using the temperatures and densities in Table 2, some crude estimates of the N and O abundances are possible, however. Ionic abundances for a few stages of N and O are given in Table 2, computed using the NEBULAR package in IRAF, as well as the relative nitrogen to oxygen ratio given by [N0+N+]/[O0+O++O++] (this is not the total N/O ratio, just a few observed ionization stages). We see that N/O changes from 20 in the S Condensation to much lower values 1 in the condensations farther from the star.
Still, how can we be certain that we are not being misled by changes in ionization rather than chemical abundances? Indeed, there appears to be a pronounced ionization gradient in the outer ejecta: The ratio [S iii] 9069+9532 [S ii] 6717+6731 is a rough gauge of the ionization conditions in the gas which is emitting [O iii], [O ii], and [N ii], provided that the electron densities do not approach the [S ii] critical density. (In Table 2, values for various regions are all 104 cm-3, so it is unlikely that [S ii] or [O ii] 3726,3729 are severely quenched.) In the S Condensation we measure [S iii]/[S ii] = 0.67, and the ratio increases outward with values of 3.5 (S Ridge), 7.6 (W Cond. 2), 7.3 (E Cond. 5), and 12 (W Edge). Thus, there is an ionization gradient toward higher average ionization with distance from the star, regardless of whether the ionization is from shocks or photoionization. From spectroscopy of shocks in HH objects (e.g., HH 47D; Morse et al. 1994), the relative strength of [O i] and [O iii] lines are anticorrelated as a function of ionization, while [O ii] remains fairly constant. Thus, the oxygen depletion in the S Condensation may be best noted by the lack of [O i] 6300 emission and very weak [O ii] 3726,3729, in addition to the absence of [O iii] 5007.
Previous study of the S Condensation, including UV wavelengths that are not included here, showed strong lines of N+2, N+3, and N+4, but no strong oxygen lines of higher excitation (Davidson et al. 1982, 1986; Dufour et al. 1997), and firmly established that the S Condensation is indeed N-rich and severely depleted of O and C. By comparing our results for the S Condensation, we can check the validity of our abundance analysis. In general, our N and O abundances are consistent with these earlier studies of the S Condensation. For example, for the N abundance on a logarithmic scale with H=12, we find [(N0+N+)/H]=8.6, whereas Dufour et al. (1997) find [(N++N2++N3++N4+)/H]=8.78. Similarly, we find [(O0+O++O2+)/H]=7.3, and Dufour et al. find [(O++O2+)/H]=7.06. The agreement is good, considering the different ionization levels included and the difference in aperture sizes (Dufour et al. 1997 used HST data). In any case, despite potential uncertainties from calibration, reddening correction, or other systematic effects, it is clear from Figure 2 that the W Condensation, the E Condensation, and the W Edge are not severely depleted of oxygen, and it is likely that the observed variation in the N/O ratio from one condensation to another is a real effect of chemical abundances.
4 DISCUSSION
4.1 Possible Interpretations
Our observations suggest inhomogeneous abundances in the Outer Ejecta of Carinae. Specifically, there is a strong change in the apparent N/O ratio: while ejecta immediately outside the Homunculus are nitrogen rich and severely oxygen depleted, more distant material appears to have normal abundances. If it is indeed true, how shall we interpret this apparent chemical abundance gradient? Two different scenarios seem like obvious possibilities:
1. Dense condensations ejected by Carinae over the past few thousand years may have become progressively more enriched with nitrogen and depleted of oxygen as ashes from the CNO cycle appeared at the surface of the star, or as mass loss ate deeper into the processed material inside the star.
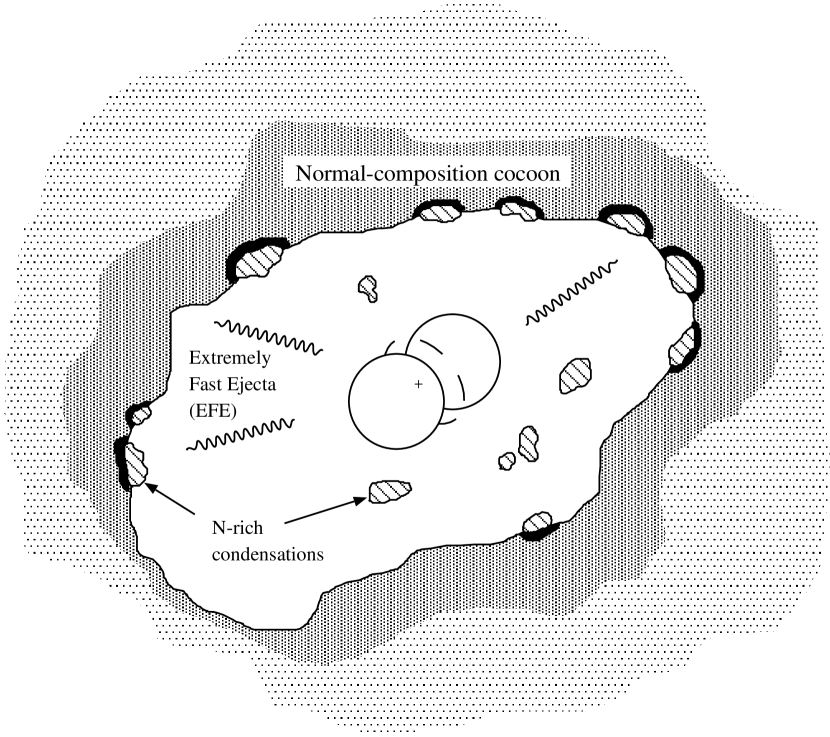
2. All of the dense condensations that make up the Outer Ejecta may indeed be nitrogen rich (perhaps in varying degrees), but the older material farther from the star may be interacting with the normal composition material deposited by previous stellar-wind mass loss. This would imply that Car’s Outer Ejecta are expanding into a cocoon or halo created by the loss of the star’s original hydrogen-rich stellar envelope, as depicted in Figure 5.
Observed kinematics may help distinguish between these possibilities. For example, proper motion measurements may be able to determine if the ejecta are expanding freely or are being decelerated, and ejecta with different chemical abundances may show discrepant Doppler velocities. Higher-quality data are needed for conclusive answers (high-dispersion spectroscopy of oxygen lines might be particularly useful), but some more immediate clues are discussed below. Proper-motion measurements in the S Ridge (Walborn & Blanco 1988; Morse et al. 2001) show a very large scatter in the projected velocities (about 5 times larger than the Homunculus), suggesting interactions between slower condensations and faster ejecta or a wind.
4.2 Clues from Kinematics
Of the two possibilities listed above, the second appears to be supported more closely by the observations. A prominent soft X-ray shell surrounds Car, and the shock heating of this shell arises as fast ejecta overtake slower material. Figure 3 shows contours of the soft X-ray emission observed by Chandra ACIS-I (see Seward et al. 2001), superposed on an optical [N ii] image of the Outer Ejecta taken in June 1999 with HST/WFPC2. Condensations that show relatively bright oxygen lines in their spectra in Figure 2 (E5, W2, W Edge) coincide with or lie outside the soft X-ray shell, whereas oxygen-poor ejecta (S Ridge, NN Jet) are inside it. The S Condensation, S Ridge, and NN Jet may comprise an ‘inner shell’ (Meaburn et al. 1996) that may be distinct from more distant ejecta (note, however, that the S Condensation and NN Jet appear to have been ejected in the Great Eruption, while the S Ridge originated somewhat earlier; Morse et al. 2001). Thus, if one wishes to estimate chemical abundances of Car pertaining to its current evolutionary state, one must study the ionized ejecta of this ‘inner shell’ which is not yet contaminated by swept-up material.
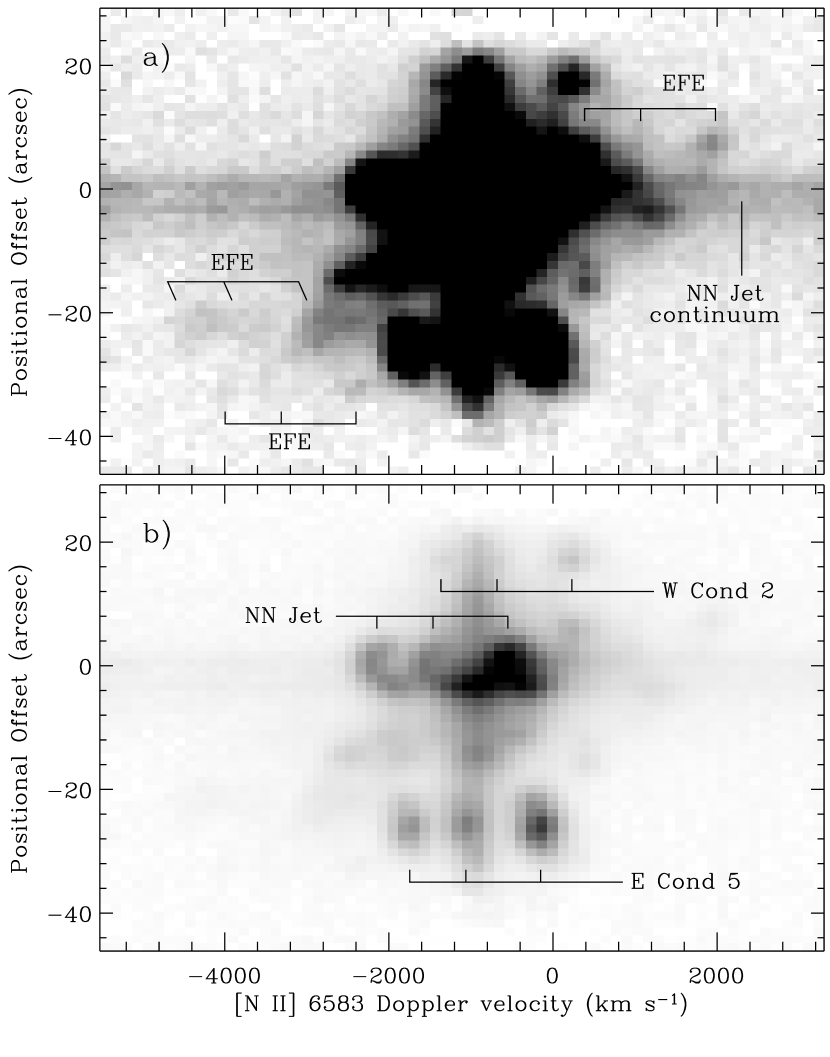
Examining long-slit spectra like the detail of [N ii] and H lines shown in Figure 4 provides some additional clues. While the background H ii region emission has been subtracted carefully, Figure 4 shows some faint H emission near the systemic velocity within 30 of Car. This implies that the Outer Ejecta are embedded in a cocoon or halo of H-rich material. Even with a careful subtraction of the spectrum on either side of a given condensation like E5, there is still some enhanced low-velocity H emission at the position of the condensation that contaminates the spectrum in Figure 2. This may indicate some low-velocity H-rich gas associated with the E5 condensation itself; the oxygen lines in the E5 condensation also appear to have lower velocities than the nitrogen lines. Obviously our analysis is hampered by low spectral resolution, so it is difficult to confirm any direct relation between kinematics and chemical abundances. However, Meaburn et al. (1996) presented echelle spectra of H and the [N ii] lines for several condensations and showed a clear trend: the [N ii]/H ratio was stronger in fast ejecta just outside the Homunculus, and dropped by a factor of 2 in the slower ejecta farther from the star. Thus, even at high dispersion where line profiles are resolved, line intensities may be qualitatively consistent with an abundance gradient.
4.3 Extremely Fast Ejecta
Figure 4 also reveals some extremely fast nitrogen-rich ejecta not previously reported. At one slit position northeast of the star, we see blueshifted emission up to about 3200 km s-1 and redshifted emission as fast as 2000 km s-1. The extremely fast blueshifted material is faint, and was not seen in previous investigations (Meaburn et al. 1987, 1993, 1996; Dufour 1989; Weis et al. 2001). Dufour (1989) detected a redshifted emission feature at 2150 km s-1, but no blueshifted features faster than 1000 km s-1 were reported.
The fastest blueshifted emission in Figure 4 is particularly interesting. First, this material is nitrogen-rich and the Doppler shifts up to 3200 km s-1 are probably correct, since the two nitrogen lines and perhaps even H can be seen offset from one another by the expected amount (these features are identified as “EFE” for “extremely fast ejecta” in Figure 4). Coincidentally, this fast blueshifted emission extends spatially away from the Homunculus as far as the position of the E Condensation 5 (roughly 25 along the slit in Figure 4), where it seems to end abruptly. Is this fast material colliding with the E Condensation? If so, there are interesting implications for the geometry. The E Condensation 5 has a trajectory tilted out of the plane of the sky by , since it has a Doppler shift of 140 km s-1 (Meaburn et al. 1996) and a tangential speed from proper motions of 600 km s-1 (Walborn et al. 1978). If the same value of applies to the EFE, the true space velocity away from Car would be well above 104 km s-1. Such astonishingly high speeds would be unusual even for young supernova remnants (e.g., Fesen et al. 1988). Though is uncertain, the true space velocity is likely to be well above 3200 km s-1, since the material is certainly not coming directly toward us – the fastest material is seen 25 away from the star. With speeds well above 3200 km s-1, this is the fastest nebular material yet detected that is associated with Car.
Could this ‘EFE’ signify a shock from the Great Eruption that is now causing the X-ray shell around Car? Obviously, better spectroscopic data are desirable to constrain the age of this interesting fast ejecta. Unfortunately, the proper motion of this emission cannot be measured with existing HST data because it is Doppler shifted out of narrow imaging filters centered on H or [N ii]. Regardless of the age, it is likely that this fast material was ejected by Car itself (i.e. the evolved primary in the putative binary system that was responsible for the Great Eruption), because it is nitrogen rich, with [N ii] 6548 H more than 6. This indicates that under some circumstances, the primary star is indeed capable of ejecting material at speeds sufficient to account for the hard X-ray emission that varies with Car’s 5.5 year cycle (Pittard & Corcoran 2002). Such high speeds are not seen in spectroscopy of the primary star’s stellar wind, even at the poles where the outflow speed is highest (Smith et al. 2003a).
If this fast material is sweeping-out a cavity and causing the soft X-ray emission shell in Figure 3, it may help to explain why there is no significant X-ray emission coming from the NN Jet and some other Outer Ejecta to the north and east of the Homunculus – i.e. even though the NN Jet is moving very fast, it is plowing through material that is already moving outward at high speed, so the relative shock velocity is insufficient for X-ray production, and instead shows a relatively low-ionization optical spectrum. This is analogous to the shock excitation in Herbig-Haro jets (Hartigan et al. 1990; Morse et al. 1994) and may explain why we see [N ii] emission even though the observed speeds imply that the shocked material should be non-radiative. We did not detect EFE south of the star in the RC Spec slit aperture offset to the southwest of Car. This absence is particularly interesting, since that position coincides with a distinct gap in the soft X-ray shell around Car (see Figure 3).
Finally, the ‘EFE’ in Figure 4 may help explain the peculiar morphology of the E Condensations (see Figs. 1 and 3), which show teardrop-like shapes that sweep away from the central star. If the E Condensations are dense knots that are being overtaken by a much faster and more tenuous outflowing wind or blast wave, their structure may arise from Rayleigh-Taylor instabilities. The detailed structure in the E Condensations resembles some Rayleigh-Taylor instabilities in the supernova remnant Cas A, for example (Fesen et al. 2001), or simulations of wind-cloud interactions (e.g., Klein et al. 1994). Note that the E Condensations do coincide with a prominent feature in the soft X-ray shell (Figure 3).
4.4 Sudden Chemical Enrichment?
Of the two possible scenarios to explain the observed N and O line intensities — chemical abundance gradients in the dense knots vs. modified abundances through swept-up material — the second seems more likely for reasons described above. In either case, however, the observed abundance gradient is significant, because it indicates that Car’s ejection of nitrogen-rich ashes of the CNO cycle is a recent phenomenon, occurring in just the past few thousand years. (The oldest of the outer condensations measured by Walborn et al. (1978) have proper motions indicating ages of 103 years.) We have discussed several interesting aspects of the observed kinematics, but the main conclusion of this paper is as follows:
Our observations suggest that diffuse gas immediately outside the nitrogen-rich condensations seen in images of Car — the material they are running into — has not been significantly processed through the CNO burning cycle.
The surrounding cocoon of normal composition material that the outer ejecta are now plowing through (see Figure 5) probably corresponds to part of the star’s original H-rich stellar envelope. Lamers et al. (2001) have inferred a similar type of abundance gradient or rapid enrichment deduced from N/O ratios in a sample of other LBV nebulae. Since the Outer Ejecta are so young (103 years), this conjecture has interesting implications for stellar evolution theories for the most massive stars. For example, stellar evolution models for stars above 50 to 60 M⊙ predict that internal turbulent mixing timescales are shorter than mass-loss timescales on the main sequence; a star with an initial mass of 120 M⊙ has a mixing timescale of only 1.6 Myr compared to a mass-loss timescale of 2.4 Myr, both of which are shorter than the time spent on the main sequence (Maeder 1982). Rotation tends to enhance the mixing (Maeder & Meynet 2002; Maeder 2002), and there are indications that Car has significant rotation (Smith et al. 2003a). Thus, we should expect the cores and envelopes of very massive stars to be well-mixed and to evolve quasi-homogeneously.
Instead, our observations suggest that Car’s outer layers were blown off the star before turbulent mixing was able to transport nitrogen-rich CNO products to the star’s surface. This might imply that in very massive stars with initial masses above 100 M⊙, the mass-loss timescale on the main sequence is shorter than the mixing timescale between the core and outer layers, shorter than the nuclear-burning timescale for the CNO cycle (e.g., Appenzeller 1970), or that violent sporadic mass-loss events like Car’s Great Eruption play a central role in a very massive star’s evolution off the main sequence. The cocoon around Car may have been created during post-main sequence evolution immediately before its current tenure as an extreme luminous blue variable, consistent with the idea that Car may be a rare example of a post-WNL type star (Walborn 1989; see also Langer et al. 1994; Crowther et al. 1995).
The apparent abundance variations we observe in Car’s Outer Ejecta provide grounds for interesting though inconclusive speculation regarding its current evolutionary state: Is there a link between Car’s fundamental instability and the critical point in the star’s evolution when CNO products are first exposed at the surface? Are catastrophic mass-loss events like the Great Eruption responsible for removing the outer H-rich envelope to expose the CNO ashes, or do they occur as a result of it (i.e. from a change in opacity)? The Great Eruption ejected several solar masses of material from the star (Mitchell & Robinson 1978; Hackwell et al. 1986; Cox et al. 1995; Smith et al. 1998, 2003b), and therefore removed a large fraction of the star’s outer radius. For example, models by Guzik et al. (1999) predict extremely tenuous outer layers for a star like Car, with 95% of the radius containing less than 1% of the total mass. It is interesting to speculate that the Great Eruption itself, or perhaps a previous similar event, may have been the trigger that first released the CNO ashes from the star. Walborn (1976) has already compared Car’s Outer Ejecta to the nitrogen-rich “quasi stationary flocculi” in the supernova remnant Cas A (Baade & Minkowski 1954; van den Bergh 1971; Chevalier & Kirshner 1978; Fesen et al. 1987, 2001); these existed in the presupernova circumstellar environment and were probably ejected shortly before the progenitor star finally exploded. The corresponding implications of the nitrogen-rich Outer Ejecta for Car’s evolutionary state and its near future are provocative.
References
- (1)
- (2) Appenzeller, I. 1970, A&A, 9, 216
- (3)
- (4) Baade, W., & Minkowski, R. 1954, ApJ, 119, 206
- (5)
- (6) Brooks, K.J., Burton, M.G., Rathborne, J.M., Ashley, M.C.B., & Storey, J.W.V. 2000, MNRAS, 319, 95
- (7)
- (8) Cardelli, J.A., Clayton, G.C., & Mathis, J.S. 1989, ApJ, 345, 245
- (9)
- (10) Chevalier, R.A., & Kirshner, R.P. 1978, ApJ, 219, 931
- (11)
- (12) Chevalier, R.A., & Raymond, J.C. 1978, ApJ, 225, L27
- (13)
- (14) Chlebowski, T., Seward, F.D., Swank, J., & Szymkowiak, A. 1984, ApJ, 281, 665
- (15)
- (16) Cox, P., et al. 1995, A&A, 297, 168
- (17)
- (18) Crowther, P.A., Smith, L.J., Hillier, D.J., & Schmutz, W. 1995, A&A, 293, 427
- (19)
- (20) Davidson, K., Dufour, R.J., Walborn, N.R., & Gull, T.R. 1986, ApJ, 305, 867
- (21)
- (22) Davidson, K., Walborn, N.R., & Gull, T.R. 1982, ApJ, 254, L47
- (23)
- (24) Dufour, R.J. 1989, RevMexAA, 18, 87
- (25)
- (26) Dufour, R.J., Glover, T.W., Hester, J.J., Currie, D.G., van Orsow, D., & Walter, D.K. 1997, in ASP Conf. Ser. 120, Luminous Blue Variables: Massive Stars in Transition, ed. A. Nota & H.J.G.L.M. Lamers (San Francisco: ASP), 255
- (27)
- (28) Fesen, R.A., Becker, R.H., & Blair, W.P. 1987, ApJ, 313, 378
- (29)
- (30) Fesen, R.A., Becker, R.H., & Goodrich, R.W. 1988, ApJ, 329, L89
- (31)
- (32) Fesen, R.A., Morse, J.A., Chevalier, R.A., Borkowski, K.J., Gerardy, C.L., Lawrence, S.S., & van den Bergh, S. 2001, AJ, 122, 2644
- (33)
- (34) Guzik, J.A., Cox, A.N., & Despain, K.M. 1999, in ASP Conf. Ser. 179, Eta Carinae at the Millenium, ed. J.A. Morse, R.M. Humphreys, & A. Damineli (San Francisco: ASP), 347
- (35)
- (36) Hackwell, J.A., Gehrz, R.D., & Grasdalen, G.L. 1986, ApJ, 311, 380
- (37)
- (38) Hartigan, P., Raymond, J., & Meaburn, J. 1990, ApJ, 362, 624
- (39)
- (40) Hummer, D.G., & Storey, P.J. 1987, MNRAS, 224, 801
- (41)
- (42) Klein, R.I., McKee, C.F., & Colella, P. 1994, ApJ, 420, 213
- (43)
- (44) Lamers, H.J.G.L.M., Nota, A., Panagia, N., Smith, L.J., & Langer, N. 2001, ApJ, 551, 764
- (45)
- (46) Langer, N., Hamann, W.R., Lennon, M., Najarro, F., Pauldrach, A.W.A., & Puls, J. 1994, A&A, 290, 819
- (47)
- (48) Maeder, A. 1982, A&A, 105, 149
- (49)
- (50) Maeder, A. 2002, A&A, 392, 575
- (51)
- (52) Maeder, A., & Meynet, G. 2002, ARA&A, 38, 143
- (53)
- (54) Meaburn, J., Wolstencroft, R.D., & Walsh, J.R. 1987, A&A, 181, 333
- (55)
- (56) Meaburn, J., Gehring, G., Walsh, J.R., Palmer, J.W., Lopez, J.A., Bryce, M., & Raga, A.C. 1993, A&A, 276, L21
- (57)
- (58) Meaburn, J., Boumis, P., Walsh, J.R., Steffen, W., Holloway, A.J., Williams, R.J.R., & Bryce, M. 1996, MNRAS, 282, 1313
- (59)
- (60) Meaburn, J., Bryce, M., & Holloway, A.J. 1995, A&A, 299, L1
- (61)
- (62) Mitchell, R.M., & Robinson, G. 1978, ApJ, 220, 841
- (63)
- (64) Morse, J.A. 1999, in ASP Conf. Ser. 179, Eta Carinae at the Millenium, ed. J.A. Morse, R.M. Humphreys, & A. Damineli (San Francisco: ASP), 13
- (65)
- (66) Morse, J.A., Davidson, K., Bally, J., Ebbets, D., Balick, B., & Frank, A. 1998, AJ, 116, 2443
- (67)
- (68) Morse, J.A., Hartigan, P., Heathcote, S., Raymond, J., & Cecil, G. 1994, ApJ, 425, 738
- (69)
- (70) Morse, J.A., Kellogg, J.R., Bally, J., Davidson, K., Balick, B., & Ebbets, D. 2001, ApJ, 548, L207
- (71)
- (72) Pittard, J.M., & Corcoran, M.F. 2002, A&A, 383, 636
- (73)
- (74) Seward, F.D., Butt, Y.M., Karovska, M., Prestwich, A., Schlegel, E.M., & Corcoran, M.F. 2001, ApJ, 553, 832
- (75)
- (76) Shaw, R.A., & Dufour, R.J. 1994, in ASP Conf. Ser. 61, Astronomical Data Analysis Software and Systems iii, ed. D.R. Crabtree, R.J. Hanisch, & J. Barbes (San Francisco: ASP), 327
- (77)
- (78) Smith, N. 2002, MNRAS, 331, 7
- (79)
- (80) Smith, N., Davidson, K., Gull, T.R., Ishibashi, K., & Hillier, D.J. 2003a, ApJ, 586, 432
- (81)
- (82) Smith, N., Gehrz, R.D., & Krautter, J. 1998, AJ, 116, 1332
- (83)
- (84) Smith, N., Gehrz, R.D., Hinz, P.M., Hoffmann, W.F., Hora, J.L., Mamajek, E.E., & Meyer, M.R. 2003b, AJ, 125, 1458
- (85)
- (86) Smith, R.G. 1987, MNRAS, 277, 943
- (87)
- (88) Sonneborn, G., Fransson, C., Lundqvist, P., Cassatella, A., Gilmozzi, R., Kirshner, R.P., Panagia, N., & Wamsteker, W. 1997, ApJ, 477, 848
- (89)
- (90) Thakeray, A.D. 1950, MNRAS, 110, 524
- (91)
- (92) van den Bergh, S. 1971, ApJ, 156, 457
- (93)
- (94) Walborn, N.R. 1976, ApJ, 204, L17
- (95)
- (96) Walborn, N.R. 1989, in Physics of Luminous Blue Variables, ed. K. Davidson, A.F.J. Moffat, & H.J.G.L.M. Lamers (Dordrecht: Kluwer), 251
- (97)
- (98) Walborn, N.R. 1995, Rev. Mexicana A&A, Ser. Conf., 2, 51
- (99)
- (100) Walborn, N.R., & Blanco, B.M. 1988, PASP, 100, 797
- (101)
- (102) Walborn, N.R., Blanco, B.M., & Thackeray, A.D. 1978, ApJ, 219, 498
- (103)
- (104) Weis, K., Duschl, W.J., & Bomans, D.J. 2001, A&A, 367, 566
- (105)
| Line I.D. | S Cond. | S Ridge | W Cond. 2 | E Cond. 5 | W Edge | H ii reg. |
|---|---|---|---|---|---|---|
| O ii] 3726+3729 | 11.0 | 4.2 | 97.4 | 124 | 305 | 168 |
| H 4340 | 45.9 | 47.8 | 47.2 | 47.5 | 49.2 | 45.2 |
| O iii] 4363bbFor the S Condensation and S Ridge we cannot give useful upper limits for the [O iii] 4363 intensity, because [Fe ii] 4358 dominates the emission at this wavelength. | 1.7 | 1.0 | 2.5 | 3.5 | ||
| H 4861 | 100 | 100 | 100 | 100 | 100 | 100 |
| O iii] 4959 | 1.0 | 0.1 | 14.7 | 30.2 | 59.3 | 60.1 |
| O iii] 5007 | 3.0 | 0.3 | 49.1 | 89.6 | 182 | 185 |
| N i] 5200 | 51.2 | 8.6 | 1.7 | 1.9 | 3.3 | 1.6 |
| N ii] 5755 | 69.2 | 12.2 | 6.8 | 14.5 | 4.9 | 1.4 |
| He i 5876 | 25.3 | 17.9 | 10.7 | 19.1 | 21.3 | 14.8 |
| O i] 6300 | (6.8) | (1.2) | 1.7 | (2.4) | 4.0 | 0.7 |
| S iii] 6312 | (2.2) | (3.2) | 1.7 | (2.4) | (5.8) | 1.7 |
| O i] 6364 | (6.5) | (1.2) | 1.7 | (1.9) | 4.0 | 0.7 |
| N ii] 6548 | 1010 | 385 | 76.9 | 311 | 29.0 | 15.5 |
| H 6563 | 373 | 474 | 377 | 460 | 427 | 408 |
| N ii] 6583 | 3060 | 1160 | 238 | 938 | 89.8 | 46.5 |
| He i 6678 | 10.8 | 13.3 | 3.5 | 8.1 | 8.1 | 6.0 |
| S ii] 6717 | 62.7 | 17.7 | 4.4 | 12.0 | 12.1 | 16.0 |
| S ii] 6731 | 116 | 28.5 | 5.7 | 20.1 | 11.4 | 11.9 |
| He i 7065 | 16.0 | 16.6 | 9.8 | 11.3 | 6.8 | 6.4 |
| Ar iii] 7136 | 7.6 | 4.1 | 5.7 | 16.7 | 22.8 | 18.7 |
| Fe ii] 7155 | 48.2 | 8.5 | 1.7 | 8.6 | 4.0 | 4.0 |
| Ca ii] 7291 | 49.7 | 9.6 | 1.7 | 11.4 | 4.0 | 0.1 |
| Ca ii] 7325 | 34.7 | 5.1 | 1.7 | 12.6 | ||
| O ii] 7325 | 1.7 | 11.2 | 3.6 | |||
| Ni ii] 7379 | 41.4 | 12.6 | 4.4 | 14.0 | 4.0 | 1.0 |
| Ni ii] 7412 | 9.1 | 2.0 | 1.7 | 2.2 | 4.0 | 0.4 |
| Fe ii] 7452 | 15.7 | 2.8 | 1.7 | 3.3 | 4.0 | 0.1 |
| Fe ii] 8617 | 65.9 | 13.5 | 3.5 | 14.2 | 4.0 | 0.3 |
| S iii] 9069 | 42.0 | 49.4 | 21.4 | 48.5 | (19) | 60.4 |
| S iii] 9532 | 103 | 146 | 70.8 | 237 | 256 | 214 |
| Line I.D. | S Cond. | S Ridge | W Cond. 2 | E Cond. 5 | W Edge | H ii reg. |
|---|---|---|---|---|---|---|
| O ii] 3726+3729 | 13.3 | 5.0 | 117 | 150 | 368 | 203 |
| H 4340 | 50.2 | 52.2 | 51.6 | 52.0 | 53.9 | 49.4 |
| O iii] 4363 | 1.9 | 1.1 | 2.8 | 3.9 | ||
| H 4861 | 100 | 100 | 100 | 100 | 100 | 100 |
| O iii] 4959 | 0.9 | 0.08 | 14.4 | 29.6 | 58.3 | 59.1 |
| O iii] 5007 | 2.9 | 0.26 | 47.8 | 87.3 | 177 | 180 |
| N i] 5200 | 48.3 | 8.1 | 1.6 | 1.8 | 3.1 | 1.5 |
| N ii] 5755 | 60.4 | 10.7 | 5.9 | 12.6 | 4.3 | 1.2 |
| He i 5876 | 21.8 | 15.4 | 9.2 | 16.5 | 18.3 | 12.8 |
| O i] 6300 | (5.6) | (1.0) | 1.4 | (2.0) | 3.3 | 0.6 |
| S iii] 6312 | (1.8) | (2.7) | 1.4 | (2.0) | (4.8) | 1.4 |
| O i] 6364 | (5.3) | (1.0) | 1.4 | 1.6 | 3.3 | 0.6 |
| N ii] 6548 | 816 | 312 | 62.3 | 252 | 23.5 | 12.6 |
| H 6563 | 302 | 384 | 306 | 373 | 345 | 331 |
| N ii] 6583 | 2470 | 942 | 193 | 758 | 72.6 | 37.6 |
| He i 6678 | 8.7 | 10.7 | 2.8 | 6.5 | 6.5 | 4.8 |
| S ii] 6717 | 50.2 | 14.1 | 3.5 | 9.6 | 9.7 | 12.8 |
| S ii] 6731 | 92.6 | 22.8 | 4.5 | 16.1 | 9.1 | 9.5 |
| He i 7065 | 12.5 | 12.9 | 7.7 | 8.8 | 5.3 | 5.0 |
| Ar iii] 7136 | 5.9 | 3.2 | 4.4 | 12.9 | 17.7 | 14. 5 |
| Fe ii] 7155 | 37.3 | 6.6 | 1.1 | 6.6 | 2.6 | 3.1 |
| Ca ii] 7291 | 38.1 | 7.4 | 1.1 | 8.8 | 2.6 | 0.1 |
| Ca ii] 7325 | 26.5 | 3.9 | 1.1 | 9.6 | ||
| O ii] 7325 | 1.1 | 8.5 | 2.7 | |||
| Ni ii] 7379 | 31.5 | 9.6 | 3.3 | 10.6 | 2.5 | 0.8 |
| Ni ii] 7412 | 6.9 | 1.5 | 1.0 | 1.7 | 2.5 | 0.3 |
| Fe ii] 7452 | 11.9 | 2.1 | 1.0 | 2.5 | 2.5 | 0.1 |
| Fe ii] 8617 | 45.2 | 9.2 | 2.4 | 9.7 | 2.1 | 0.2 |
| S iii] 9069 | 28.0 | 33.0 | 14.2 | 32.3 | (13) | 40.3 |
| S iii] 9532 | 68.0 | 95.6 | 46.2 | 155 | 167 | 140 |
| ne [S ii] (cm-3) | 7,1001800 | 3,600700 | 1,540460 | 4,2301120 | 470170 | 150 |
| Te [N ii] (K) | 11,550600 | 8,800300 | 14,600600 | 10,150400 | 25,000 | 15,800500 |
| Te [O iii] (K) | 22,000 | 12,400800 | 13,7001000 | 15,8001300 | ||
| n(N0)/n(H) | 5.910-5 | 1.810-5 | 4.210-7 | 2.410-6 | 7.310-7 | 1.810-7 |
| n(N+)/n(H) | 3.710-4 | 2.810-4 | 1.610-5 | 1.510-4 | 6.810-6 | 2.710-6 |
| n(O0)/n(H) | 1.510-5 | 6.610-6 | 1.610-6 | 3.210-6 | 4.510-6 | 5.010-7 |
| n(O+)/n(H) | 5.710-6 | 5.410-6 | 1.410-5 | 4.010-5 | 4.510-5 | 1.510-5 |
| n(O+2)/n(H) | 6.410-7 | 1.410-7 | 5.410-6 | 1.610-5 | 2.410-5 | 1.710-5 |
| n(N+O)/n(H)bbThis is the observed quantity n(N0+N++O0+O++O+2)/n(H), and is not the total N+O abundance relative to H. | 4.510-4 | 3.110-4 | 3.710-5 | 2.110-4 | 8.110-5 | 3.510-5 |
| n(N)/n(O)ccThis is the observed ratio n(N0+N+)/n(O0+O++O+2), and is not the total N/O ratio. | 227 | 246 | 0.80.3 | 2.60.8 | 0.10.05 | 0.10.03 |