and Photometry of Ultracool Dwarfs
Abstract
We have compiled (3.4–m) and (4.6–m) photometry of 63 single and binary M, L, and T dwarfs obtained at the United Kingdom Infrared Telescope using the Mauna Kea Observatory (MKO) filter set. This compilation includes new measurements of 8 L dwarfs and 13 T dwarfs and new measurements of 7 L dwarfs, 5 T dwarfs, and the M1 dwarf Gl 229A. These new data increase by factors of 0.6 and 1.6, respectively, the numbers of ultracool dwarfs ( K) for which and measurements have been reported. We compute , BCK, and for 42 dwarfs whose flux-calibrated spectra, photometry, and trigonometric parallaxes are available, and we estimate these quantities for 9 other dwarfs whose parallaxes and flux-calibrated spectra have been obtained. BCK is a well-behaved function of near-infrared spectral type with a dispersion of mag for types M6–T5; it is significantly more scattered for types T5–T9. declines steeply and monotonically for types M6–L7 and T4–T9, but is nearly constant at K for types L7–T4 with assumed ages of Gyr. This constant is evidenced by nearly unchanging values of – between types L6 and T3. It also supports recent models that attribute the changing near-infrared luminosities and spectral features across the L–T transition to the rapid migration, disruption, and/or thinning of condensate clouds over a narrow range of . The and luminosities of early-T dwarfs do not exhibit the pronounced humps or inflections previously noted in the through bands, but insufficient data exist for types L6–T5 to assert that and are strictly monotonic within this range of types. We compare the observed , , and luminosities of L and T dwarfs in our sample with those predicted by precipitating-cloud and cloud-free models for varying surface gravities and sedimentation efficiencies. The models indicate that the L3–T4.5 dwarfs generally have higher gravities (log –5.5) than the T6–T9 dwarfs (log –5.0). The predicted luminosities of late-T dwarfs are 1.5–2.5 times larger than those derived empirically for the late-T dwarfs in our sample. This discrepancy is attributed to absorption at 4.5–m by CO, which is not expected under the condition of thermochemical equilibrium assumed in the models. Our photometry and bolometric calculations indicate that the L3 dwarf Kelu-1 and the T0 dwarf SDSS J042348.57–041403.5 are probable binary systems. We compute log and –750 K for the T9 dwarf 2MASSI J0415195–093506, which supplants Gl 570D as the least luminous and coolest brown dwarf presently known.
1 Introduction
The number of known ultracool dwarfs – dwarfs with effective temperatures K – has grown dramatically over the last seven years, primarily because of the sizes and depths of the DEep Near-Infrared Survey of the Southern Sky (DENIS; Epchtein, 1997), the Two-Micron All Sky Survey (2MASS; Skrutskie et al., 1997), and the Sloan Digital Sky Survey (SDSS; York et al., 2000). These surveys, and others of lesser scope, have revealed ultracool dwarfs in numbers sufficient to populate a distribution of temperatures ranging from the coolest hydrogen-burning stars ( K; Burrows et al., 1993; Chabrier et al., 2000) to the coolest known brown dwarf ( K; this paper). Consequently, two new spectral types, L and T, have been defined in order to classify dwarfs cooler than spectral type M (Kirkpatrick et al., 1999b; Martín et al., 1999b; Burgasser et al., 2002a; Geballe et al., 2002, hereafter G02). The spectra of L dwarfs are characterized by absorption from neutral alkali metals (e.g., K, Na, Cs, and Rb) and metallic hydrides (e.g., FeH and CrH) at red wavelengths and by absorption from CO and H2O at near-infrared wavelengths. In contrast, the optical spectra of T dwarfs are dominated by pressure-broadened K I and Na I absorption lines, and their near-infrared spectra are sculpted by broad absorption bands of CH4 and H2O and collisionally-induced absorption (CIA) by H2.
Most observational studies of ultracool dwarfs concern the spectral region 0.6–2.5 m. This region is favored because the flux distributions of these objects peak around 1.2 m and because the spectral sensitivities of modern photoelectronic detectors coincide with the relatively dark and transparent atmospheric windows in this region. Recently, attention has been given to the photometry of ultracool dwarfs longward of the bandpass. This attention has been motivated partly by the need to better constrain the bolometric luminosities of ultracool dwarfs and by the prospects for observing even cooler brown dwarfs or planets at these wavelengths with space-based infrared telescopes. The intrinsic faintness of L and T dwarfs and the increasing brightness and variability of the sky make ground-based observations of these objects in the (2.5–4.0 m) and (4.1–5.5 m) bandpasses difficult and time-consuming. Although -band photometry of L and T dwarfs is extensive (Jones et al., 1996; Leggett, Allard, & Hauschildt, 1998; Tokunaga & Kobayashi, 1999; Stephens et al., 2001; Reid & Cruz, 2002; Leggett et al., 2002a, hereafter L02), -band photometry has been published for only six of these objects (Matthews et al. 1996; Reid & Cruz 2002; L02).
Spectroscopic studies of brown dwarfs in the or bandpasses have so far been limited to three L dwarfs and the archetypal T dwarf, Gl 229B. The bandpass contains the Q-branch of the fundamental absorption band of CH4, which is situated near 3.3 m. This absorption band appears as early as spectral type L5 ( K; Noll et al., 2000) and is deep and broad in the spectrum of the T6 dwarf Gl 229B ( K; Oppenheimer et al., 1998). The -band spectrum of Gl 229B features a broad but shallow absorption trough from 4.5 m to 4.9 m and a narrow peak at 4.67 m, both of which are attributed to the 1-0 vibration-rotation band of CO (Noll, Geballe, & Marley, 1997; Oppenheimer et al., 1998). These features reveal a CO abundance that is over 1000 times larger than expected under conditions of COCH4 thermochemical equilibrium, indicating that CO is rapidly transported outward from warmer, CO-rich layers of the atmosphere (Fegley & Lodders, 1996; Griffith & Yelle, 1999; Saumon et al., 2000, 2003). The -band fluxes of two other T dwarfs, SDSS J125453.90–012247.4 and 2MASS J05591914–1404488, are reportedly well below the levels expected for COCH4 equilibrium, which suggests that vertical mixing of CO within the atmospheres of T dwarfs is common (L02; Saumon et al., 2003).
In this paper, we present new 3.4–m and 4.6–m photometry of ultracool dwarfs obtained with the United Kingdom Infrared Telescope (UKIRT) using the Mauna Kea Observatory (MKO) and filters. These data increase by factors of 0.6 and 1.6, respectively, the numbers of ultracool dwarfs for which MKO and measurements have been reported. We examine the near-infrared colors and magnitudes of these dwarfs as functions of spectral type. Using recently published trigonometric parallaxes, we show color–magnitude diagrams in the MKO , , and bandpasses, and we determine the bolometric luminosities and effective temperatures of ultracool dwarfs. We compare these results with the predictions of recent atmospheric models that consider the effects of cloud sedimentation on the broadband spectra of these objects. Finally, we consider the effects of nonequilibrium COCH4 chemistry on the luminosities of ultracool dwarfs and on direct searches for even cooler objects at wavelengths around m.
2 The Sample
The sample of objects under study comprises 63 single and binary M, L, and T dwarfs for which MKO photometry has been presented by L02, Leggett et al. (2002b), Reid & Cruz (2002), or in this paper. Although our study concerns ultracool dwarfs (spectral types M7 and later), we include in our sample some early-M dwarfs to establish a connection with the cool end of the classical main sequence. Counting only the single dwarfs and the primary components of close binaries, our sample numbers 15 M dwarfs, 28 L dwarfs, and 20 T dwarfs. Table 1 lists the names, multiplicities, spectral types, trigonometric parallaxes, and distance moduli of the dwarfs in our sample, as well as published references for those characteristics. The parallaxes and distance moduli listed in columns 3 and 4 are based upon the weighted means of the parallax measurements referenced in column 6. The names of the dwarfs are the full designations assigned to them by the catalogues or surveys of their origin, using (where possible) the most current naming protocols for those sources. Henceforth, we abbreviate the names of the single and binary dwarfs detected by DENIS, 2MASS, and SDSS using their survey acronyms, followed by the first four digits of both their Julian right ascensions and declinations. These abbreviated forms are preferred by the International Astronomical Union (IAU).
The spectral types of all but two of the L and T dwarfs listed in Table 1 are derived from their -, -, and -band spectra using the near-infrared spectral classification scheme of G02. The types listed for the primary components of close-binary systems are derived from the composite spectra of the binaries using this classification scheme. The types listed for the secondary components are either previously published estimates or new estimates based on published luminosities and the relationship between luminosity and spectral type presented by L02. The classification scheme of G02 employs four indices that measure the strengths of H2O and CH4 absorption bands between m and m. The monotonic variation of these indices through the L and T sequences permits classification of these dwarfs with a typical uncertainty of one-half spectral subtype. The H2O m index and a fifth index measuring the slope of the red continuum flux are well suited for classifying early-L dwarfs. These indices yield early-L types that are consistent with types obtained from the optical classification schemes of Kirkpatrick et al. (1999b) and Martín et al. (1999b). However, discrepancies between the optical and G02 schemes as large as 2.5 subtypes occur for mid- to late-L dwarfs, which suggests that the optical and near-infrared indices are unequally affected by the changing opacity of condensate clouds as decreases (Stephens, 2003). The spectral types of T dwarfs obtained from the independent near-infrared classification schemes of G02 and Burgasser et al. (2002a) usually match within one-half subtype.
We have obtained new MKO photometry for 21 dwarfs in our sample (8 L dwarfs and 13 T dwarfs) and new MKO photometry for 13 dwarfs in our sample (1 M dwarf, 7 L dwarfs, and 5 T dwarfs). These new data increase to 57 and 21 the numbers of ultracool dwarfs that have been measured photometrically in the MKO and bandpasses, respectively (L02; Leggett et al., 2002b; Reid & Cruz, 2002). This group of ultracool dwarfs is the largest so far measured in any single - and -band photometric system. Stephens et al. (2001) obtained -band photometry of 23 ultracool dwarfs using the and filters installed in the Near Infrared Camera (NIRC) at the W. M. Keck Observatory on Mauna Kea, Hawaii. Because no photometric transformations between the Keck and bandpasses and the MKO bandpass exist yet for ultracool dwarfs, we exclude these 23 measurements from our present analysis.
3 Observations and Data Reduction
The new and photometric data were obtained between 2001 November and 2003 November using the 3.8 m UKIRT on Mauna Kea, Hawaii. Data obtained before 2002 September 1 were recorded with UKIRT’s 1–5 m InfraRed Camera (IRCAM; Puxley et al., 1994); data obtained thereafter were recorded with the new 1–5 m UKIRT Imager Spectrometer (UIST; Ramsay-Howat et al., 2000). IRCAM features a array of m InSb pixels and optics that yield a pixel scale of 0081 pixel-1 and a field of view of 207 207. UIST features a ALADDIN array of m InSb pixels and selectable optics in its imaging mode that yield pixel scales of 006 pixel-1 and 012 pixel-1. The former scale and a subarray readout were used to increase the efficiency of our observations. This configuration provided a field of view of 307 307. Both imagers are equipped with broadband filters spanning the range 1.15–4.9m, including the and filters of the MKO photometric system (Simons & Tokunaga, 2002; Tokunaga, Simons, & Vacca, 2002). Descriptions of these filters and the differences between commonly used - and -bandpasses have been presented by L02.
To investigate possible differences between the instrumental and magnitudes of IRCAM and UIST, we synthesized the and magnitudes of Gl 229B by convolving its 3.0–m and 4.5–m spectra (Noll, Geballe, & Marley, 1997; Oppenheimer et al., 1998) with the measured transmission and reflection profiles of the imagers’ optics and detectors. A 5% dip in the 2.7–m transmission of UIST’s lenses produces a value of that is 0.015 mag larger than that computed for IRCAM. No other instrumental features affect the magnitudes significantly. The magnitudes computed for each imager are nearly identical. The differences between the pairs of synthetic magnitudes are much less than the random errors associated with actual and magnitudes of ultracool dwarfs obtained with either imager (Table 2). Thus, our limited investigation indicates that - and -band measurements recorded with IRCAM and UIST are compatible with the MKO and photometric system.
Table 2 lists the dates and instruments of observation and the calibrated magnitudes of the 28 dwarfs in our sample for which new or photometric data were obtained. All data were recorded during photometric (dry and cloudless) conditions and subarcsecond seeing. The techniques of recording and reducing the data from both imagers mimicked those of previous IRCAM observations of ultracool dwarfs (L02). Because of the bright sky background, the reduced images comprised scores of short-exposure, co-added frames. Typically, each exposure consisted of 100 co-added exposures of 0.2 s, and each exposure comprised 75 co-added exposures of 0.12 s. The telescope was offset slightly between frames. Adjacent pairs of frames were subtracted to remove the rapidly varying background signal, and every four pairs of differenced images were combined and divided by a flat field. This process was repeated until the desired ratio of signal to noise (S/N) was achieved. With IRCAM, S/N was achieved in 1–30 min for targets having –13. Likewise, S/N was reached in about 1.3 hr for targets having . With UIST, S/N was achieved in 1 hr for targets having , and S/N was achieved in 1 hr for targets having . All data were calibrated using UKIRT standard stars observed through the MKO and filters (Leggett et al., 2003).
4 Results and Analysis
Table 3 lists the new and previously published MKO photometry for our sample of M, L, and T dwarfs. All measurements come from L02 or this paper unless otherwise noted. Absolute magnitudes are also listed for objects whose trigonometric parallaxes have been published. The values of for five T dwarfs are based on the weighted means of absolute parallaxes reported by Dahn et al. (2002, hereafter D02) and Vrba et al. (2004, hereafter V04) and relative parallaxes reported by Tinney, Burgasser, & Kirkpatrick (2003). The for another T dwarf, 2MASS J1534–2952AB, is based solely upon a relative parallax. Tinney, Burgasser, & Kirkpatrick (2003) estimate that the corrections from relative to absolute parallaxes are less than 0001 for their astrometric fields, so the systematic differences between values of derived separately from absolute and relative parallaxes are probably within 0.06 mag for the dwarfs in our sample.
4.1 – and – colors
Figure 1 shows the variations of – and – with spectral type for the dwarfs in our sample. The ordinate axes of each diagram have the same incremental scales so that the relative changes in each color may be compared directly. Figure 2 is a diagram of – versus – for dwarfs measured in all three bandpasses. In these figures, M dwarfs are denoted by circles, L dwarfs by triangles, and T dwarfs by squares. Points representing close-binary systems are surrounded by open circles to distinguish them from single or widely separated dwarfs. These representations are maintained throughout this paper.
The diagram of – versus spectral type is a more populated version of the similar diagram shown by L02. – generally increases monotonically through the spectral sequence, but the rate of increase changes significantly over the range of spectral types shown. The reddening between types M1 and L0 is approximately linear with a dispersion of mag, but – increases nonlinearly through the L sequence with a dispersion of mag. This scatter has been attributed to the strong and varying effects of condensate clouds on the emergent - and -band fluxes over the associated range of (Ackerman & Marley 2001; L02). Variations in surface gravity among L dwarfs may also contribute to this scatter (see §5). The nearly unchanging values of – between types L6 and T5 were noted by L02, who attributed this behavior to the balanced effects of increasing CH4 absorption at 2.2–m and 3.3–m, the latter of which extends into the blue half of the band. Similar behavior can be inferred from the Keck – measurements of Stephens et al. (2001) despite a lack of data for types L8.5–T0.5. As we discuss in §4.3, this behavior may also reflect the redistribution of flux caused by the settling of condensate clouds in the photosphere. The rapid increase of – beyond type T5 may be caused by increasing H2 CIA in the band, saturation (or, alternatively, weakening) of the CH4 absorption band at 3.3–m, or both. The L9 dwarf with the anomalously blue – is SDSS J0805+4812, and the T6 dwarf with the anomalously red – is 2MASS J0937+2931. We discuss these dwarfs in §4.5.
– decreases slowly between spectral types M5 and L6, probably because of strengthening CO absorption at 4.5–m (Tsuji & Ohnaka, 1995; Tsuji, Ohnaka, & Aoki, 1995; Reid & Cruz, 2002). The color is nearly constant between types L6 and T3, which suggests that the varying absorptions by CH4 at 3.3–m and CO at 4.5–m have balanced effects on the integrated and fluxes, or that changes little within this range of spectral types. While the former condition may be true, the results presented in §4.3 indicate that the latter condition is certainly true. Beyond type T5, – rises steeply, i.e, it becomes significantly redder. This reddening cannot be definitively explained without a representative collection of - and -band spectra. It may be caused by dissipating CO absorption at 4.5–m, or it may simply reflect a Wien-like shift of the spectral energy distribution as decreases.
4.2 Color–magnitude and magnitude–spectral type relations
Figures 3a and 3b are color–magnitude diagrams (CMDs) of versus – and –, respectively, for the dwarfs in our sample. Figure 3a is similar to the versus – diagram presented by L02, but it shows many more data, especially in the T dwarf domain –. Figure 3b greatly extends the equivalent versus – diagram of Reid & Cruz (2002) by including L and T dwarfs with –. The bright end of each diagram represents the M1 dwarf Gl 229A; the faint end represents the T9 dwarf 2MASS J0415–0935. We cannot explain in detail the characteristics of these CMDs without a comprehensive set of 3.4–m spectra, but their basic appearances are significant. The anomalous 2MASS J0937+2931 notwithstanding (see §4.5), both diagrams are monotonic throughout the M, L, and T spectral classes. Such monotonicity, combined with a wide range of color values, is rare among CMDs constructed from combinations of optical and near-infrared bandpasses. For example, the reversals of – and – caused by strengthening CH4 absorption at 1.6–m and 2.2–m (G02; Burgasser et al., 2002a) cause degeneracies in the -based CMDs of M and early-T dwarfs (L02; D02; Tinney, Burgasser, & Kirkpatrick 2003; V04; Knapp et al. 2004, hereafter K04). Combinations of -, -, and -band measurements produce CMDs that are similarly degenerate over a wide range of spectral types (Tinney, Burgasser, & Kirkpatrick, 2003). CMDs constructed exclusively from SDSS and photometry are monotonic for –, but SDSS measurements of late-T dwarfs with known distances are presently lacking (Hawley et al. 2002; K04). Consequently, Figures 3a and 3b are the only CMDs with sufficient range and resolution to enable reliable estimates of photometric parallaxes throughout the presently defined L and T sequences.
We have derived parametric expressions for each CMD by computing least-squares fits of polynomials to their respective data. Because the intrinsic scatter of the data exceeds the photometric and astrometric measurement errors, the data were not weighted. Data representing close-binary systems and 2MASS J0937+2931 were excluded from the fits. The curves in Figures 3a and 3b are low-order polynomials that yield the optimum statistic for the selected range of data. The coefficients and residual statistics of the fits are listed in Table 4. The fits are intended primarily for estimating the luminosities and distances of individual dwarfs from MKO photometry. Because the data represent dwarfs of unknown multiplicity and age, the fits can be used to derive only a provisional luminosity function for ultracool dwarfs.
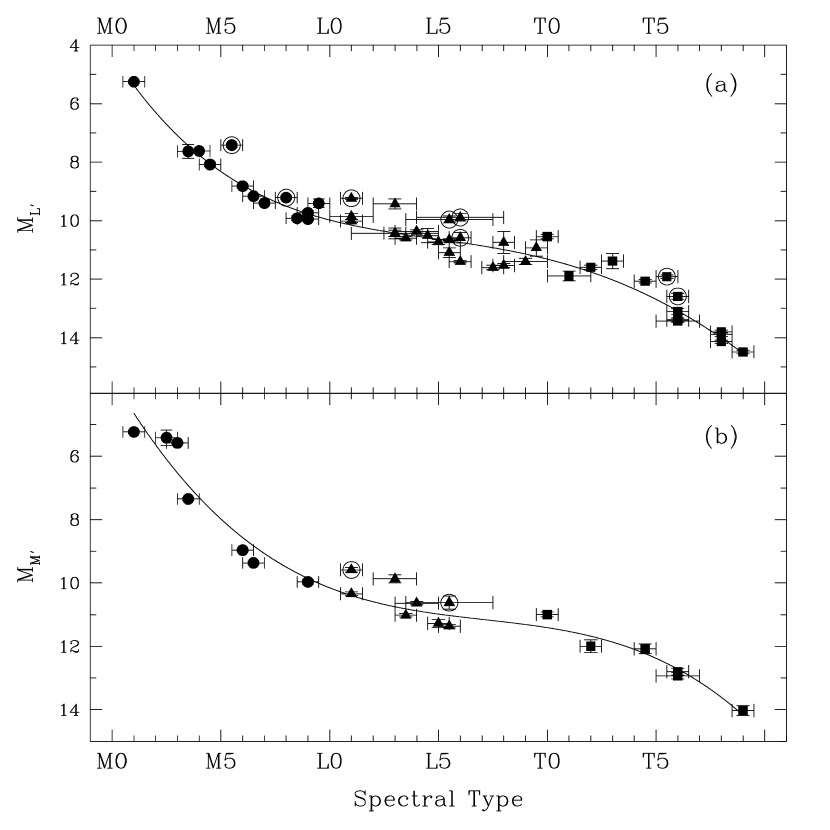
Figures 4a and 4b are diagrams of and as functions of spectral type. These diagrams complement the diagrams presented by Tinney, Burgasser, & Kirkpatrick (2003) and K04 for MKO and photometry reported by L02 and K04.111Tinney, Burgasser, & Kirkpatrick (2003) incorrectly described L02’s and data as having been measured on the old UKIRT photometric system instead of the proper MKO system. Also, Tinney, Burgasser, & Kirkpatrick (2003) employed L types derived from the optical classification scheme of Kirkpatrick et al. (1999b) rather than the near-infrared scheme of G02 used by us. The two schemes often yield discordant mid-L to early-T types, so systematic inconsistencies between our Figure 4 and the diagrams of Tinney, Burgasser, & Kirkpatrick may exist for these types. The curves in Figures 4a and 4b are low-order polynomials fitted to the unweighted data, excluding those for known close binaries. The coefficients and residual statistics of these fits are listed in Table 4. The fits are not -optimal, but they provide means of estimating the luminosities and distances of M, L, and T dwarfs for which MKO photometry and near-infrared spectral types have been obtained. The combination of photometry with -based spectral types seems awkward, but the relatively small scatter in the and luminosities – especially among types L0 to L5 – provides an advantage over combinations of photometry and optical or near-infrared spectral types (L02; D02; Tinney, Burgasser, & Kirkpatrick 2003; V04; K04).
The fits in Figures 4a and 4b indicate that and decrease monotonically throughout the M, L, and T classes. They do not exhibit the pronounced “hump” or inflection in luminosity noted for early-T dwarfs in diagrams of , , , , and versus spectral type (Tinney, Burgasser, & Kirkpatrick 2003; V04; K04). The amplitude of this feature increases from to (Tinney, Burgasser, & Kirkpatrick, 2003) and decreases from to (V04; K04). The lack of obvious humps or inflections in Figures 4a and 4b suggests that the latter trend continues through the and bands. Close inspection of Figure 4a shows that the polynomial fit may overestimate by mag the values of for early-T dwarfs, but more and parallax measurements of T0–T5 dwarfs are needed to confirm this possibility. No inflection appears in Figure 4b, but insufficient data exist for types L6–T5 to assert with confidence that is strictly monotonic within this range of types.
The apparently monotonic decrease of the and luminosities with decreasing is consistent with recent explanations of the “early-T hump” at shorter wavelengths. Using models of precipitating condensate clouds, Ackerman & Marley (2001) and Marley et al. (2002) showed that a horizontally-uniform cloud deck forms progressively deeper in the atmosphere and becomes more optically thick as decreases. This behavior significantly affects the - through -band fluxes of late-L and early-T dwarfs ( K; see §4.3), but it affects much less the emergent flux outside these bandpasses. The migration of the cloud deck into the convective region of the atmosphere may also disrupt the deck’s uniformity, thereby allowing more -band flux from hotter layers of the atmosphere to escape through holes in the clouds (Ackerman & Marley, 2001; Burgasser et al., 2002b). Alternatively, the efficiency of sedimentation may rapidly increase at the L–T transition and enhance the -band flux (K04). Tsuji & Nakajima (2003) also attributed the L–T transition to the inward migration of thin dust clouds as decreases, but they viewed the reported brightening of the -band flux as an artifact of a small sample of brown dwarfs with different masses, ages, and cooling tracks. They did not extend their demonstration to shorter or longer wavelengths, but Tsuji (2002) reported that the effect of cloud migration on the emergent spectrum is largest in the band. Whether or not cloud migration alone is sufficient to explain the sudden appearance of the “early-T hump”, the dynamics of the cloud deck below K have comparatively little impact on the emergent and fluxes. The predicted effects of temperature, clouds, and gravity on and are examined further in §5.
4.3 Bolometric Luminosities and Effective Temperatures
Our large and comprehensive set of measurements permits us to determine with reasonable accuracy the bolometric luminosities () and of ultracool dwarfs. We have computed and compiled of 42 dwarfs in our sample for which flux–calibrated spectra, photometry, and trigonometric parallaxes are available. To this group, we have added nine M, L, and T dwarfs for which spectra and photometry exist and for which trigonometric parallaxes have recently been measured. The luminosities of these supplemental dwarfs can be estimated from the measured magnitudes of dwarfs in our sample that have similar spectral types and colors (K04). The names, spectral types, parallaxes, and magnitudes of these nine dwarfs are listed in Table 5 along with their respective references.
As a first step toward computing , we used SDSS , UKIRT , and MKO photometry (L02; K04) to calibrate the 0.8–m spectra (Leggett et al. 1999; G02; Burgasser et al. 2002a; K04) of the 51 dwarfs under study. We also used our MKO and measurements of Gl 229B to calibrate its 3.0–m and 4.5–m spectra (Noll, Geballe, & Marley, 1997; Oppenheimer et al., 1998). For Gl 229B, we summed the available spectra from through bands, linearly interpolated the fluxes in the regions 2.5–m and 4.2–m, and assumed a Rayleigh–Jeans (R–J) flux distribution longward of . The R–J approximation is compromised by the presence of absorption by CH4, H2O, and NH3 between 6 and m (Marley et al., 1996; Burrows et al., 2001), but we estimate that this absorption decreases by % the bolometric flux of dwarfs with K (Burrows et al., 2001). For the other dwarfs, we summed the spectra from their blue limits through band, interpolated the flux between and the effective flux computed from our photometry, and assumed a R–J distribution longward of . Neither the interpolation between and nor the R–J extrapolation longward of is valid for T dwarfs, because CH4 absorbs shortward of and CO absorbs significantly in . Consequently, we used the summed - and -band spectra of Gl 229B to determine corrections for these approximations. The corrections increase by 20% the derived bolometric fluxes of mid- to late-T dwarfs. (The absorption by CH4 and CO is more than offset by the flux beyond that exceeds our R–J approximation.) Leggett et al. (2001) used model atmospheres to determine that no correction is needed for late-M to mid-L dwarfs. For types L8–T3.5, we adopted a correction that is half that computed for the later T dwarfs. We applied these corrections to the fluxes of the mid-L to late-T dwarfs, verifying where possible the bolometric fluxes derived from this method against those computed using our measurements and an R–J approximation longward of . We found that the two methods matched within %. We estimate that the uncertainties in the bolometric fluxes of all the dwarfs are 5–11%.
We used the magnitudes obtained from our bolometric fluxes and the photometry of L02 and K04 to compute -band bolometric corrections (BCK) for the 51 M, L, and T dwarfs in our supplemented sample. We also used the weighted-mean parallaxes listed in Tables 1 and 5 to convert the bolometric fluxes into and compute absolute bolometric magnitudes (). Table 6 lists [expressed as log], , and BCK for the 51 dwarfs. Many of these quantities are based on photometry and astrometry reported since the work of L02 (D02; Tinney, Burgasser, & Kirkpatrick 2003; V04; K04; this paper), so the information in Table 6 supersedes that given in Table 7 of L02.
We used the relationships between and derived from the evolutionary models of Burrows et al. (1997), Baraffe et al. (1998), and Chabrier et al. (2000) to obtain for the dwarfs listed in Table 6. Because the radii of brown dwarfs older than 0.1 Gyr vary by no more than 30% (Marley et al., 1996; Burrows et al., 2001), the range of possible for a given remains within K regardless of mass or age. This behavior is illustrated in Figure 5, which shows the relationships between and predicted by the models of Burrows et al. (1997) and Chabrier et al. (2000). Column 6 of Table 6 lists the range of derived from the values of listed in Column 5, assuming ages of 0.1–10 Gyr.222The ages of some dwarfs have been further constrained by assuming coevality with their main sequence companions whose ages have been delimited observationally. These systems are: Gl 229AB (0.5–10 Gyr; Nakajima et al. 1995; J. Stauffer 2001, personal communication; Leggett et al. 2002b; Gizis, Reid, & Hawley 2002; I. N. Reid 2003, personal communication), LHS 102AB (1–10 Gyr; Leggett et al., 2002b; Gizis, Reid, & Hawley, 2002), GD 165B (1.2–5.5 Gyr; Kirkpatrick et al., 1999a), Gl 584C (1–2.5 Gyr; Kirkpatrick et al., 2001), and Gl 570D (2–5 Gyr; Burgasser et al., 2000; Geballe et al., 2001). Also, the age of Kelu-1 has been constrained to 0.3–1 Gyr on the basis of its Li I Å absorption strength (Basri et al., 1998). Column 7 lists for an age of Gyr (unless otherwise noted), which represents the mean age of nearby brown dwarfs inferred from their kinematics (D02). These values of supersede those reported by L02 for dwarfs common to both samples. The broad range of assumed ages contributes uncertainties of % to . For dwarfs whose computed values of have errors within 10%, the contributions of these errors to the uncertainties in are 1–2.5%. Thus, the uncertainties in for dwarfs whose measured parallaxes have errors % are dominated by our conservative range of ages for the dwarfs. A less conservative range of 0.5–10 Gyr increases the minimum for each dwarf by K.
Figures 6a and 6b are diagrams of BCK and versus spectral type for the M6–T9 dwarfs listed in Table 6. The plotted values of are those listed in Column 7 of the table for a mean age of Gyr, except where noted. The error bars for these values reflect the full ranges of listed in Column 6 of the table. The curves in Figures 6a and 6b are nonoptimal fourth- and sixth-order polynomials fitted to the weighted data, excluding the data for known close binaries. The datum for the anomalous T6 dwarf 2MASS 0937+2931 (see §4.5) is omitted from in Figure 6a for clarity’s sake, but it is included in the polynomial fit to the data. The fit in Figure 6b is fixed at type T9 to avoid an unrealistic upturn in between types T8 and T9. The coefficients and residual statistics of these fits are listed in Table 4.
The fitted curve in Figure 6a shows that BCK is a piecewise-monotonic function of spectral type with a small dispersion ( mag) for types M6–T5. The increased dispersion for the late-T dwarfs may indicate the sensitivity of H2 CIA, which significantly affects the -band spectrum, to variations in surface gravity (Saumon et al. 1994; Burgasser et al. 2002a; K04). BCK gradually rises between types M5 and L5, which is expected from Wien’s law but may also indicate enhanced -band luminosity as the cloud deck settles below the “-band photosphere” ( K; Ackerman & Marley, 2001; Marley et al., 2002). BCK generally declines for types later than L5, which reflects the increasing strength of combined absorption by CH4 at 2.2–m and CO at 2.3–m (G02; Burgasser et al., 2002a).
Figure 6b shows that declines steeply and monotonically for types M6–L7 and T4–T9. The decline from L0 to L7 ( K, for assumed ages of Gyr) is nearly linear, as noted by Stephens et al. (2001). is approximately constant ( K) for types L7–T4, which lie within the range of types for which – and – appear constant (Figure 1). This coincidence suggests that the constancy of is the cause for these unchanging colors, but the substantial changes in the -band spectra of these brown dwarfs (G02; Burgasser et al., 2002a) show that their spectral energy distributions are not static at K. Indeed, the constancy of for types L7–T4 is not evident in diagrams of –, –, and – versus spectral type (L02; Burgasser et al. 2002a; Hawley et al. 2002; K04). These colors increase or decrease substantially over this range. The dichotomy between these changing colors and the nearly constant – and – between types L6 and T5 may be attributed to the migration and disruption of condensate clouds deep in the photosphere (Ackerman & Marley, 2001; Marley et al., 2002; Burgasser et al., 2002b; Tsuji, 2002; Tsuji & Nakajima, 2003). These cloud dynamics occur over a narrow range of 333Burgasser et al. (2002b) reproduced the 2MASS magnitudes and colors of L and T dwarfs by assuming that the cloud deck disrupts rapidly at K. Likewise, K04 showed that the MKO and CMDs of L–T transition dwarfs are bounded by the 1300 K isotherms that connect the color–magnitude sequences predicted by cloudy and cloud-free models for a wide range of gravity. These transition temperatures are –15% lower than the K that we compute empirically for L7–T4 dwarfs using the effective temperatures at age Gyr listed in Table 6. and significantly affect only the 0.9–2.5 m region of the flux spectrum. Consequently, – should not vary significantly across the L–T boundary. Nevertheless, the small decrease in the and luminosities between types L6 and T5 (Figure 4) suggests that some redistribution of spectral energy from 3.5–5.0 m to shorter wavelengths occurs as the cloud deck settles or disrupts. Thus, the constancy of – may be attributed to the balanced effects of enhanced -band flux and increased CH4 absorption at 2.2–m, both of which occur rapidly as the cloud deck sinks, and gradually decreasing luminosity.
Figures 7a and 7b show the variations of BCK with MKO – and –. The data for 2MASS 0937+2931 are again omitted from the figures for clarity’s sake. These diagrams are augmented versions of ones shown by L02, and employ new photometry reported by K04. BCK is neither a monotonic nor single-valued function of – because of the color reversal brought on by increasing CH4 absorption at 2.2–m for types L8 and later (G02). BCK is a better behaved function of –, but it is degenerate for –. This degeneracy reflects the balanced effects of flux redistribution and CH4 absorption in the - and -bands for L6–T5 dwarfs. Thus, Figures 7a and 7b are not useful stand-alone references for bolometric luminosities near the L–T boundary.
4.4 Comparison of Effective-Temperature Scales
Since the initial discoveries of numerous L dwarfs by DENIS and 2MASS, many estimates of the relationship between and L subtype have been reported. Kirkpatrick et al. (1999b) and Reid et al. (1999) offered initial estimates of the scale of L dwarfs by comparing the evolutions of absorption features in their optical spectra with chemical-equilibrium abundance profiles predicted for the atoms and molecules responsible for those features (Burrows & Sharp, 1999). Martín et al. (1999b) and Basri et al. (2000) derived a warmer scale by fitting synthetic absorption profiles of Rb I Å and Cs I Å with those observed in their optical spectra. Noll et al. (2000), Leggett et al. (2001), and Schweitzer et al. (2002) also developed scales for L dwarfs by fitting model spectra to their sets of optical and near-infrared spectra. Consequently, the accuracy of each scale is tied to the fidelity of the contemporaneous model atmospheres on which the scale is based. Differences among these scales probably reflect the rapidly evolving details of the model atmospheres rather than fundamentally different perspectives on the effective temperatures of ultracool dwarfs. Fortunately, empirically-based scales have been derived that are immune to the idiosyncracies of model atmospheres and depend only on the comparatively robust theoretical relationship between the ages and radii of brown dwarfs (Leggett et al. 2001; L02; D02; V04; this paper). We now compare the effective temperatures listed in Table 6, which supersede the results of Leggett et al. (2001) and L02, with the empirical scales derived by D02 and V04.
D02 derived for 17 M and L dwarfs listed in Table 6.444The 17 dwarfs are LHS 3003 (M7), LHS 2065 (M9), BRI 0021–0214 (M9.5), 2MASS J0345+2540 (L1), 2MASS J1439+1929 (L1), 2MASS J0746+2000AB (L1 + L2), DENIS J1058–1548 (L3), GD 165B (L3), Kelu-1 (L3), 2MASS J2224–0158 (L3.5), 2MASS J0036+1821 (L4), LHS 102B (L4.5), 2MASS J1507–1627 (L5.5), DENIS J0205–1159AB (L5.5 + L5.5), 2MASS J0825+2115 (L6), DENIS J1228–1547AB (L6 + L6), and 2MASS J1632+1904 (L7.5). In doing so, they applied the BC versus – relation of Leggett et al. (2001) to their collection of photometry measured on the California Institute of Technology (CIT) and 2MASS photometric systems. They also adopted radii that are halfway between those predicted by the models of Burrows et al. (1997) and Chabrier et al. (2000) for their resultant values of and assumed ages of 1–5 Gyr. The values of derived by D02 for the eleven M7–L4.5 dwarfs are higher by an average of K than those listed in Column 7 of Table 6 for the same dwarfs. Conversely, the values derived by D02 for the five L5.5–L7.5 dwarfs are lower by an average of K than the corresponding values in Table 6. Although these discrepancies lie within the ranges of uncertainty of both scales, their systematic nature is likely due to slightly different applications of the evolutionary models for particular combinations of luminosity and age. We discount the possibilities that these differences are caused by discordant photometric measurements or improper use of the UKIRT bolometric corrections by D02.
The ranges of computed by D02 for the 17 dwarfs are approximately half as wide as those listed in Column 6 of Table 6 for the same dwarfs. D02’s smaller uncertainties are not the result of more accurate data, but instead reflect the 1–5 Gyr range of ages assumed for all the dwarfs in their sample. This range is much narrower than our adopted range of 0.1–10 Gyr for the dwarfs listed in Table 6 whose ages cannot be constrained by the ages of stellar companions. By assuming a lower age limit of 1 Gyr, D02 eliminate from consideration the era in which the radii of ultracool dwarfs change greatly and rapidly (Burrows et al., 1997; Chabrier et al., 2000). The possible youth of Kelu-1 and Gl 229B13 suggest that the 1–5 Gyr range of ages assumed by D02 is too narrow to encompass a random sample of ultracool dwarfs in the solar neighborhood. In general, the ranges of ages assumed for such samples must be carefully considered when comparing scales derived from structural models. Figure 5 shows that, for a fixed , narrowing the age range from 0.1–10 Gyr to 1–5 Gyr compresses the corresponding range of asymmetrically so that its midpoint shifts to a higher than would be expected if the radii of brown dwarfs decreased uniformly over time. Consequently, comparisons of scales must be based on temperatures derived for some fiducial age or radius, rather than the midpoint of the range. Otherwise, discrepancies between scales might be declared where none actually exists.
V04 applied our polynomial fit of BCK versus spectral type (Table 4) to a sample of 56 L and T dwarfs whose trigonometric parallaxes have been measured at the United States Naval Observatory (D02; V04). In doing so, they assumed equality between the dwarfs’ magnitudes, which were collected from different sources and transformed to approximate magnitudes, and the magnitudes on which our bolometric corrections are based. V04 also employed spectral types based on the optical L-dwarf classification scheme of Kirkpatrick et al. (1999b) and the near-infrared T-dwarf classification scheme of Burgasser et al. (2002a), rather than the near-infrared classification scheme of G02 that defines our L and T subtypes. Despite the noted differences between the CIT and MKO photometric systems (Stephens & Leggett, 2004) and the optical and near-infrared classification schemes (Stephens, 2003), the values of log, , and obtained by V04 are generally consistent with those shown in Table 6 for the dwarfs common to both studies. However, significant differences exist for some individual dwarfs and spectral types. For instance, our ranges of for early-L dwarfs are 100–400 K cooler than those of V04. This discrepancy is caused by the fixed range of radii (0.075–0.105 ) adopted by V04 for all the dwarfs in their sample. Imposing a less conservative, but more appropriate, lower limit of upon dwarfs with log (Burrows et al., 1997; Chabrier et al., 2000) brings V04’s scale for early-L dwarfs into agreement with ours. V04 computed log and K for the T9 dwarf 2MASS J0415–0935. These values are significantly higher than the corresponding values in Table 6. The discrepancies are due to a 0.4-mag difference between our measured magnitude and the transformed magnitude adopted by V04. The 0.4-mag difference is probably caused by the 20% uncertainty in the measured 2MASS magnitude of 2MASS J0415–0935 and the -mag systematic error for late-T dwarfs associated with the 2MASS-to-CIT transformation employed by V04 (Stephens & Leggett, 2004). Nevertheless, the possibility that 2MASS J0415–0935 is photometrically variable cannot be excluded.
4.5 Noteworthy L and T dwarfs
Several ultracool dwarfs in our sample merit special consideration. We describe them here, in progressive order of spectral type.
Kelu-1 (L3) is mag more luminous in and than the other L3 dwarfs in our sample. Similar overluminosity in other bandpasses is well documented (Martín et al., 1999b; Leggett et al., 2001). Kelu-1’s large rotational velocity ( km s-1; Basri et al., 2000) and periodic photometric variability (Clarke, Tinney, & Covey, 2002) suggest possible duplicity, but no companion has yet been imaged (Martín, Brandner, & Basri, 1999a). Kelu-1’s age has been constrained to 0.3–1 Gyr based on the strength of Li I Å absorption (Basri et al., 1998). For this range of ages, our computed yields –2350 K. These temperatures are K hotter than those the other L3 dwarfs. For Kelu-1 to have a consistent with the other L3 dwarfs, it must have a mass of and an age of Myr (Burrows et al., 1997). This age is inconsistent with the lower bound set by the Li I absorption, and Kelu-1 is not located near a known region of star formation (Ruiz, Leggett, & Allard, 1997). Moreover, Kelu-1 exhibits H emission, which is characteristic of old, early-L dwarfs (Gizis et al., 2000). These conditions don’t preclude the possibility that Kelu-1 is extremely young, but the collective evidence favors unresolved duplicity as the cause of Kelu-1’s overluminosity.
2MASS J2244+2043 (L7.5) has a – color that is mag redder than those of other late-L dwarfs. D02 reported that its 2MASS – color is mag redder than those of all other L dwarfs in their sample. K04 reported that the MKO – and – colors of 2MASS J2244+2043 are significantly redder than those of other L dwarfs whose spectral types lie within the broad range (L5.5–L9.5) spanned by the near-infrared spectral indices (G02) computed for 2MASS J2244+2043. K04 suggested that the anomalous colors may be caused by condensate clouds that are more optically thick than usual. A comprehensive set of - through -band spectra of 2MASS J2244+2043 is needed to determine whether unusually opaque clouds or other conditions cause the excessively red colors throughout these bands.
SDSS J0805+4812 (L9) is an anomalously blue (–) late-L dwarf. K04 reported that its – and – colors are –0.3 mag bluer than those of other dwarfs whose spectral types lie within the L7.5–T0.5 range spanned by the indices (G02) computed for SDSS J0805+4812. Its 1.0–m spectrum reveals unusually strong H2O, K I, and FeH absorption, which suggests that the atmosphere of SDSS J0805+4812 is relatively free of condensate clouds or metal-poor (K04). The former possibility is inconsistent with the observed value of –, however, because a cloudless atmosphere with K should yield a redder value of – than a corresponding cloudy atmosphere (see §5). A comprehensive set of - through -band spectra is needed to determine the cause(s) of the unusual colors of SDSS J0805+4812.
SDSS J0423–0414 (T0) is mag more luminous in and than other dwarfs of similar spectral type in our sample. Overluminosities of –1.5 mag in , , and have also been reported by V04 and K04. SDSS J0423–0414 is not known to be multiple. V04 state that its colors and luminosities better suit its optical spectral type of L7.5 (Cruz et al., 2003) than its near-infrared spectral type of T0 (G02). This contradiction may be virtual, however, because the spectral classification schemes of Kirkpatrick et al. (1999b) and G02 are not rigidly correlated for late-L and early-T dwarfs. Unfortunately, – and – are nearly constant for near-infrared types L7–T4 (Figure 1), so these colors do not constrain SDSS J0423–0414’s spectral type. However, Figures 4a and 4b show that the and overluminosities of this dwarf are the same whether it has a near-infrared type of L7.5 or T0. Moreover, Table 6 and Figure 6a show that the BCK computed for SDSS J0423–0414 is more consistent with type T0 than type L7.5. Thus, our photometry and derived BCK support the T0 classification assigned to SDSS J0423–0414 by G02 on the basis of its highly consistent near-infrared spectral indices. Our results do not refute the L7.5 optical classification; they merely reflect the dominant contribution of the dwarf’s near-infrared flux to its bolometric flux. Our computed for SDSS J0423–0414 yields –1825 K for assumed ages of 0.1–10 Gyr. These temperatures are K hotter than those of other dwarfs with types L9–T1 (Table 6). For SDSS J0423–0414 to have a consistent with the other L9–T1 dwarfs, it must have a mass of and an age of Myr (Burrows et al., 1997). Burgasser et al. (2003a) speculate that SDSS J0423–0414 is an older, more massive T dwarf because it exhibits H emission and it has an optical continuum whose slope is consistent with relatively large surface gravity. Moreover, SDSS J0423–0414 does not lie near a known star-forming region. Thus, the collective evidence indicates that SDSS J0423–0414’s overluminosity is likely caused by unresolved multiplicity rather than extreme youth. Its putative components probably have equal masses, because a coeval companion of lesser mass would have K and a spectral type later than T4 (Figure 6b). SDSS J0423–0414’s near-infrared spectrum does not exhibit such heterogeneity (G02).
2MASS J0559–1404 (T4.5) was reported by D02 to be mag more luminous in than the L8 dwarfs Gl 337C, Gl 584C, and 2MASS J1632+1904. Hubble Space Telescope observations revealed no bright companion beyond 005 of the T dwarf (Burgasser et al., 2003c). Our and measurements indicate that 2MASS J0559–1404 is no more luminous than the upper bound of the intrinsic scatter observed for the T dwarfs. This conclusion agrees with that of V04, who find that the , , and luminosities of 2MASS J0559–1404 are consistent with the “early-T hump.”
2MASS J0937+2931 (T6) has an anomalously red color of –. Its is consistent with those of other T6 dwarfs (Table 3), so its overly red – can be attributed to its suppressed -band flux caused by uncommonly strong H2 CIA (Burgasser et al., 2002a). Such strong absorption may be attributed to high surface gravity (log ; K04) or to low metallicity (Saumon et al. 1994; Burgasser et al. 2002a; K04). Either condition may also account for the absence of the K I absorption doublet at m and m in 2MASS J0937+2931’s -band spectrum (Burgasser et al. 2002a; K04), because low metallicity implies a paucity of sodium and because high gravity raises the abundance of KCl at the expense of K (Lodders 1999; Marley et al. 2002; K04). Recent models of the pressure-broadened Na I and K I absorption lines in the 0.6–1 m spectrum of 2MASS J0937+2931 suggest that a mixed condition of high gravity and low metallicity best describe this unusual T dwarf (Burgasser et al., 2003a).
2MASS J0415–0935 (T9) is the latest T dwarf classified on the system of G02 (K04). It has been classified as type T8 by Burgasser et al. (2002a), but its numerical rank based on the average of its spectral indices is the latest of the T dwarfs in their sample. Our computed values of log and –750 K show that 2MASS J0415–0935 is the least luminous and coolest brown dwarf presently known. It is 35–225 K cooler than the previous title-holder, Gl 570D (Burgasser et al., 2000; Geballe et al., 2001). Interestingly, the – and – colors of 2MASS J0415–0935 are redder than those of Gl 570D (K04), which is contrary to the trend that later T dwarfs have bluer colors in these bands. Marley et al. (2002) and Burrows, Sudarsky, & Lunine (2003) predict a reversal in – as H2O condenses and settles into clouds at K. If the redder colors of 2MASS J0415–0935 are caused by thickening water clouds, then our computed value of indicates that the condensation of H2O can occur under warmer conditions than anticipated from typical model atmospheres. However, Burrows, Sudarsky, & Lunine (2003) show that H2O clouds can form at such temperatures in the atmospheres of very old (–10 Gyr) brown dwarfs with masses –. Alternatively, the color reversal may be due to optically-thick clouds that conceivably form when gaseous potassium condenses into solid KCl at K (Lodders, 1999; Marley, 2000; Burrows, Sudarsky, & Lunine, 2003). Further study of 2MASS J0415–0935 is needed to investigate these possibilities.
5 Effects of Precipitating Clouds, Nonequilibrium Chemistry, and Gravity
Our theoretical understanding of the effects of condensate clouds on the emergent fluxes of brown dwarfs has advanced considerably during the last few years (Burrows et al., 1997; Chabrier et al., 2000; Allard et al., 2001; Ackerman & Marley, 2001; Marley et al., 2002; Burgasser et al., 2002b; Tsuji, 2002; Tsuji & Nakajima, 2003; Cooper et al., 2003; Burrows, Sudarsky, & Lunine, 2003). The formation, migration, sedimentation, and turbulent disruption of cloud decks are thought to affect significantly the near-infrared spectra of L and T dwarfs, as well as cooler dwarfs yet to be discovered. The models of Ackerman & Marley (2001) and Marley et al. (2002) consider horizontally-uniform decks of precipitating water, iron, and silicate clouds formed in atmospheres having solar metallicity and conditions of structural and thermochemical equilibrium. The altitudes, particle-size distributions, and density profiles of the clouds are determined self-consistently from atmospheric temperature and pressure profiles and an adjustable ratio, , which describes the efficiency of particle sedimentation (precipitation) relative to the upward transport of condensates by convection.555Ackerman & Marley (2001) originally employed the parameter to describe the sedimentation efficiency. To avoid confusion with the traditional notion of rain, has been renamed . Practical values of for L dwarfs range from 3, which also describes Jupiter’s thick NH3 cloud deck, to 5, which describes a thinner, more efficiently precipitating cloud deck (Ackerman & Marley 2001; Marley et al. 2002; Burgasser et al. 2002b; K04). Model spectra from m to m have been produced by Marley et al., and our and measurements allow us to assess these models between m and m.
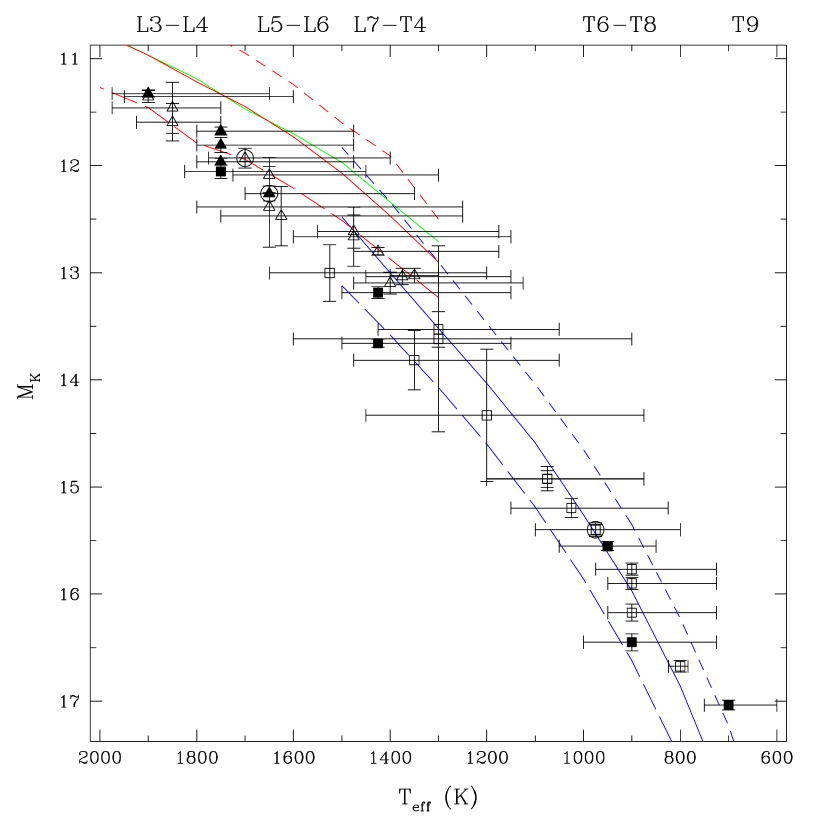
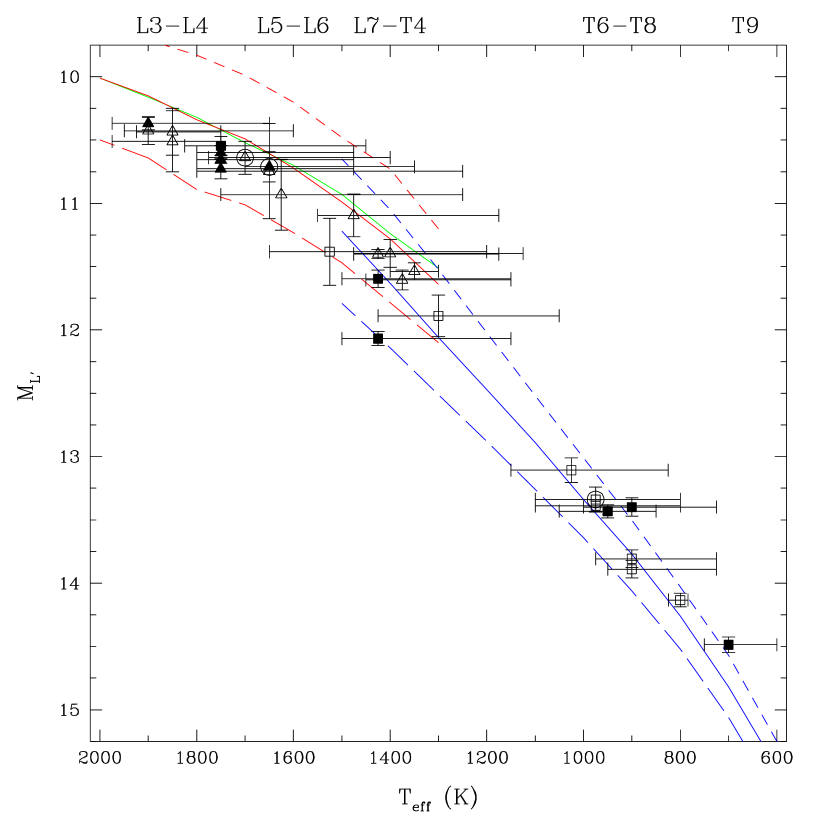
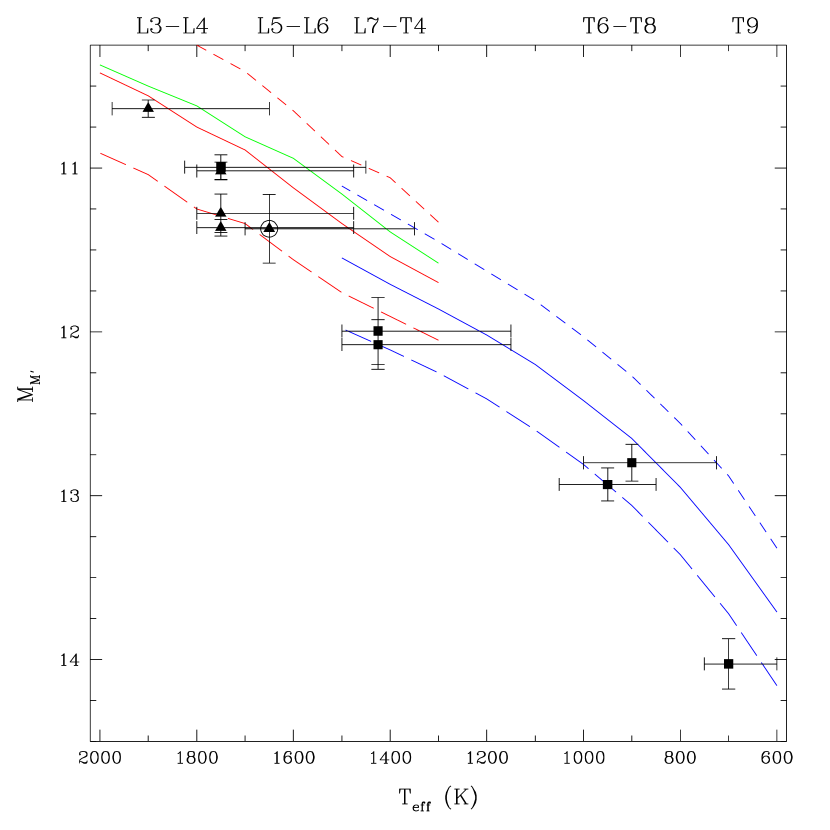
Figures 8, 9, and 10 are diagrams of , , and versus for the L3–T9 dwarfs listed in Table 6. The dwarfs for which we have data are denoted by filled symbols to facilitate comparison of the data associated with these dwarfs in all three diagrams. The absolute magnitudes of close binaries have been increased by 0.75 mag to represent one component of the presumed uneclipsed, equal-luminosity systems. The curves in the diagrams are the predicted absolute magnitudes computed from the models of Marley et al. (2002) for discrete values of (3, 5, and no clouds) and surface gravity (log , 5.0, and 5.5, where has units of cm s-2). The precipitating-cloud models are shown for K, and the cloud-free models are shown for K. Thus, all models are shown across the L–T transition. The predicted magnitudes were synthesized from the model spectra and the measured transmission profiles of the MKO , , and filters (L02). The diagrams show that the models collectively envelope the empirical data in all bands, i.e., the models reproduce the broad ranges of absolute magnitudes and effective temperatures for this sample of L and T dwarfs. The ensemble of data does not favor particular sets of model parameters for particular ranges of spectral type, but this situation is expected given the presumably heterogeneous masses, ages, and metallicities associated with our sample.
Figures 8–10 indicate that the high-gravity (log –5.5) models consistently match the absolute magnitudes and effective temperatures obtained for the L3–T4.5 dwarfs in our sample. Conversely, the values of and for the T6–T9 dwarfs (except the anomalous 2MASS J0937+2931) are generally bounded by the low-gravity (log –5.0) models. The lower gravities of the late-T dwarfs are also indicated in K04’s Figure 6, which compares the measured MKO – and – colors of 42 T dwarfs with those synthesized from the models of Marley et al. (2002). The apparent fidelity of the low-gravity models suggests that they are useful benchmarks for predicting other photometric characteristics of late-T dwarfs. Such reasoning has frequently been applied when estimating the fluxes of cool brown dwarfs at wavelengths longer than m, which are easily observed from space. Figure 10, however, shows that the values of measured for all the T dwarfs in our sample are better matched by the high-gravity models. The log –5.0 models, which consistently reproduce and measured for the late-T dwarfs Gl 229B and 2MASS J0415–0935, underestimate for these dwarfs by 0.5–1 mag. L02 also noted discrepancies of mag between the measured – colors of two T dwarfs (SDSS J1254–0122 and 2MASS J0559–1404) and the – colors predicted by the dusty-atmosphere models of Chabrier et al. (2000) and the settled-condensate models of Burrows et al. (1997) for wide ranges of gravity. Noting that these models predicted well for their sample of L and T dwarfs, L02 attributed the discrepancies to luminosities that were overpredicted by a factor of . This assessment is consistent with the general trends seen in Figures 8–10, but the figures also show that 2MASS J0559–1404’s , , and are consistent with the cloud-free, log model of Marley et al. (2002).
Although the discrepancies between the observed and predicted luminosities of most T dwarfs vary among the models, they reveal a consistent overestimation of the emergent m flux regardless of how the condensates are modeled. L02 speculated that the low luminosities of SDSS J1254–0122 and 2MASS J0559–1404 are caused by strong CO absorption at 4.5–m, which was predicted and then observed in the -band spectrum of Gl 229B (Fegley & Lodders, 1996; Noll, Geballe, & Marley, 1997; Oppenheimer et al., 1998). The models of Burrows et al. (1997), Chabrier et al. (2000), and Marley et al. (2002) do not account for this absorption because it results from an abundance of CO that exceeds that expected under conditions of thermochemical equilibrium. Saumon et al. (2003) have modeled the effects of nonequilibrium chemistry caused by vertical mixing on the emergent spectrum of brown dwarfs. They determined that the overabundance of CO in cloudless atmospheres significantly decreases the fluxes from their chemical-equilibrium levels for K. As Figure 6b shows, this range of spans the late half of the presently defined T sequence.
Saumon et al. (2003) showed that the measured values of for 2MASS J0559–1404 and Gl 229B are matched by a nonequilibrium model with log and an eddy-diffusion coefficient of cm2 s-1. Such a coefficient is consistent with the minimum expected for planetary atmospheres and indicates that the vertical mixing of CO occurs within the outermost radiative layer of the atmosphere. An independent measure of 2MASS J0559–1404’s gravity is needed, however, to resolve the ambiguity between the log , nonequilibrium model of Saumon et al. (2003) and the cloud-free, log , equilibrium model of Marley et al. (2002) shown in Figure 10. Our results for the T9 dwarf 2MASS J0415–0935 provide a less ambiguous test of the nonequilibrium models for the coolest known T dwarfs ( K). Figures 8 and 10 show that the cloud-free, log model of Marley et al. (2002) matches and well, but it underestimates by mag. Conversely, the log model predicts within 0.25 mag, but overestimates and by 1.6 mag and 0.6 mag, respectively. Figure 4 of Saumon et al. (2003) shows that the measured for 2MASS J0415–0935 is well matched by a nonequilibrium, log model with a large eddy-diffusion coefficient ( cm2 s-1) typical of planetary atmospheres.
Evolutionary models of ultracool dwarfs (Burrows et al., 1997; Chabrier et al., 2000) can be used to constrain the gravities and masses of the dwarfs in our sample, if the dwarfs’ ages can be estimated. D02 used kinematic statistics to argue that the mean age of the L and T dwarfs in the solar neighborhood in 2–4 Gyr. We find an age range of 0.3–5.5 Gyr for the dwarfs in our sample whose minimum and maximum ages can be constrained spectroscopically.13 The lower limit of this range is consistent with a reported lull in star formation in the solar neighborhood during the last Gyr (Hernandez, Valls-Gabaud, & Gilmore, 2000; Gizis, Reid, & Hawley, 2002). The evolutionary tracks of Burrows et al. (1997) show that L2–T4 dwarfs (–1400 K) with ages 0.3–5.5 Gyr have log –5.5. This prediction is consistent with the results shown in Figures 8–10. The evolutionary tracks also show that T6–T9 dwarfs (–700 K) in this age range have log –5.3, but their mean gravity is log because high-mass brown dwarfs cool much more slowly than low-mass brown dwarfs (Reid et al., 1999). This range of gravity is higher than the log –5.0 noted for T6–T9 dwarfs in Figures 8 and 9. Unfortunately, the small and heterogeneous nature of our sample precludes a definitive explanation of this discrepancy. Because the magnitudes of the late-T dwarfs are typically near the detection limits of 2MASS and SDSS, our sample may be biased toward younger, brighter, and less-massive ones. Alternatively, the gravities indicated by the solar-metallicity, equilibrium models of Marley et al. (2002) may be incorrect. Nevertheless, the latter possibility does not affect our conclusions regarding the overpredicted luminosities for late-T dwarfs.
6 Implications for Spaced-Based Missions
Burrows et al. (1997, 2001, 2003) created 1–30 m spectra of brown dwarfs and extrasolar giant planets (EGPs) of various masses and ages using model atmospheres that assume settled condensate clouds and thermochemical equilibrium. They found that the suppression of mid-infrared flux by H2 enhances enormously the flux at shorter wavelengths. For example, the m flux of a 1 Gyr-old, Jupiter-mass EGP is times greater than its K blackbody equivalent. Marley et al. (1996) referred to this enhanced m flux as the “universal diagnostic” of brown dwarfs and EGPs. Burrows et al. (2001) remarked that space-based, -band imagers could detect brown dwarfs cooler than can be found by DENIS, 2MASS, and SDSS. Burrows, Sudarsky, & Lunine (2003) added that the persistent -band hump in the spectra of older and less massive brown dwarfs and EGPs makes this bandpass the best suited for studying these objects with the Spitzer Space Telescope (SST; formerly the Space Infrared Telescope Facility, or SIRTF). Such searches for “infra-T” dwarfs and EGPs are indeed imminent now that SST has been launched (Padgett, O’Linger, & Stapelfeldt 2003; G. Fazio 2003, personal communication666Presently, unpublished abstracts of the approved SST Guaranteed Time Observer science programs may be viewed on the World Wide Web at http://sirtf.caltech.edu/SSC/geninfo/gto/abs/.).
The apparent 50–200% overestimates of the -band fluxes of T dwarfs by chemical-equilibrium models diminish the anticipated sensitivity of the m band of SST’s Infrared Array Camera (IRAC) to the coolest known T dwarfs. If the especially low luminosity of 2MASS J0415–0935 is indicative of low-mass brown dwarfs with K, then IRAC’s m detection horizons for nearby infra-T dwarfs and EGPs may be significantly nearer than expected. Moreover, the low-mass limits for members of young star clusters detected at m may be higher than anticipated. The 1.0 m width of IRAC’s m bandpass will mitigate somewhat the effect of the 4.5–m CO absorption on the integrated signal-to-noise ratio, but it will also complicate the interpretation of the CO aborption strength. By expanding our narrower-band study to include more faint and cool brown dwarfs, we may aid the SST studies by calibrating the effects of CO absorption on the broader m photometry of at least the warmer IRAC targets.
Saumon et al. (2003) reported that nonequilibrium chemistry also affects the abundances of N2 and NH3 in the atmospheres of cool brown dwarfs. The observable effect of this situation is diminished absorption by NH3 at m and m. Thus, contrary to the case of CO in the -band, vertical mixing serves to enhance the -band (m) flux of brown dwarfs with K. Unfortunately, the -band lies between the reddest bandpass of IRAC and the bluest bandpass of the Multiband Imaging Photometer for SST (MIPS), but targeted studies of extremely cool brown dwarfs with SST’s Infrared Spectrograph (IRS) should benefit from their larger-than-predicted m luminosities. Moreover, future mid-infrared space missions like the James Webb Space Telescope (JWST) may fully exploit the enhanced m luminosities of infra-T dwarfs and EGPs. Despite the previously underappreciated effects of nonequilibrium chemistry in substellar atmospheres, the prospects for filling the ever-shrinking gap between the coolest known T dwarfs and the Jovian planets with SST and JWST are excitingly good.
7 Summary
Our compilation of new and previously reported MKO and photometry has permitted us to characterize ultracool dwarfs comprehensively at wavelengths longward of the commonly used , , and bands. We find that – increases monotonically with decreasing , but the nearly constant K of spectral types L7–T4 limits the utility of – as an indicator of spectral type. Likewise, – is nearly constant between types L6 and T3, indicating that the dramatic changes in the 1–m spectra of L–T transition dwarfs are not duplicated in their - and -band spectra. This dichotomous behavior supports recent theories that the rapid migration, disruption, and/or thinning of condensate clouds at K occur at altitudes that are coincident with the regions of - through -band emission but are well below the -band and -band “photospheres.” The and luminosities of the early-T dwarfs do not exhibit the pronounced humps or inflections noted by others in the through bands, but insufficient data exist for types L6–T5 to assert that and are strictly monotonic within this range of types.
We used our photometry, flux-calibrated spectra, and recently published trigonometric parallaxes to compute , BCK, and for ultracool dwarfs. We find that BCK is a well behaved function of spectral type with a dispersion of mag for types M6–T5. BCK is significantly more scattered among the later T dwarfs, which may indicate the sensitivity of H2 CIA in the -band to varying surface gravity for K. BCK is neither a monotonic nor single-valued function of – because of the color reversal induced by the onset of CH4 aborption at 2.2–m at spectral type L8. BCK is a single-valued function of – except at –, which corresponds to the L–T transition. declines steeply and monotonically for types M6–L7 and T4–T9, but is nearly constant at K for types L7–T4 with assumed ages of Gyr. Our photometry and bolometric calculations indicate that Kelu-1 (L3) and SDSS J0423–0414 (T0) are probable binary systems. We compute log and –750 K for 2MASS J0415–0935 (T9), making it the least luminous and coolest brown dwarf presently known.
We have compared the measured absolute magnitudes of L3–T9 dwarfs with those predicted by the precipitating-cloud models of Marley et al. for varying surface gravities, , and sedimentation efficiencies, . The models spanning and , 5, and “” (no clouds) reproduce well the and of all the dwarfs in our sample. The models indicate that the L3–T4.5 dwarfs generally have higher gravities (log –5.5) than the T6–T9 dwarfs (log –5.0). The lower-gravity models underestimate for the late-T dwarfs by 0.5–1 mag. This overestimation of the luminosity for K is attributed to absorption at 4.5–m by CO, which is not expected under the condition of thermochemical equilibrium assumed in the models. The impact of nonequilibrium chemistry on the broadband near-infrared fluxes of cool brown dwarfs has only recently been appreciated. Consequently, the effective-temperature limits of space-based m searches for infra-T dwarfs and EGPs, such as those planned with the recently-launched Spitzer Space Telescope, will be somewhat higher than originally expected.
References
- Ackerman & Marley (2001) Ackerman, A. S., & Marley, M. S. 2001, ApJ, 556, 872
- Allard et al. (2001) Allard, F., Hauschildt, P. H., Alexander, D. R., Tamanai, A., Schweitzer, A. 2001, ApJ, 556, 357
- Baraffe et al. (1998) Baraffe, I., Chabrier, G., Allard, F., & Hauschildt, P. H. 1998, A&A, 337, 403
- Basri et al. (1998) Basri, G., Martín, E., Ruiz, M. T., Delfosse, X., Forveille, T., Epchtein, N., Allard, F., & Leggett, S. K. 1998, ASP Conf. Ser. 154, The Tenth Cambridge Workshop on Cool Stars, Stellar Systems and the Sun, eds. R. A. Donahue & J. A. Bookbinder (San Francisco: ASP), 1819
- Basri et al. (2000) Basri, G., Mohanty, S., Allard, F., Hauschildt, P. H., Delfosse, X., Martín, E. L., Forveille, T., & Goldman, B. 2000, ApJ, 538, 363
- Becklin & Zuckerman (1988) Becklin, E. E., & Zuckerman, B. 1988, Nature, 336, 656
- Burgasser et al. (2002a) Burgasser, A. J., Kirkpatrick, J. D., Brown, M. E., Reid, I. N., Burrows, A., Liebert, J., Matthews, K., Gizis, J. E., Dahn, C. C., Monet, D. G., Cutri, R. M., & Skrutskie, M. F. 2002a, ApJ, 564, 421
- Burgasser et al. (2000) Burgasser, A. J., Kirkpatrick, J. D., Cutri, R. M., McCallon, H., Kopan, G., Gizis, J. E., Liebert, J., Reid, I. N., Brown, M. E., Monet, D. G., Dahn, C. C., Beichman, C. A., & Skrutskie, M. F. 2000, ApJ, 531, L57
- Burgasser et al. (2003a) Burgasser, A. J., Kirkpatrick, J. D., Liebert, J., & Burrows, A. 2003a, ApJ, 594, 510
- Burgasser et al. (2003b) Burgasser, A. J., Kirkpatrick, J. D., McElwain, M. W., Cutri, R. M., Burgasser, A. J., & Skrutskie, M. F. 2003b, AJ, 125, 850
- Burgasser et al. (2003c) Burgasser, A. J., Kirkpatrick, J. D., Reid, I. N., Brown, M. E., Miskey, C. L., & Gizis, J. E. 2003c, ApJ, 586, 512
- Burgasser et al. (2002b) Burgasser, A. J., Marley, M. S., Ackerman, A. S., Saumon, D., Lodders, K., Dahn, C. C., Harris, H. C., & Kirkpatrick, J. D. 2002b, ApJ, 571, L151
- Burrows et al. (2001) Burrows, A., Hubbard, W. B., Lunine, J. I., & Liebert, J. 2001, Rev. Mod. Phys., 73, 719
- Burrows et al. (1993) Burrows, A., Hubbard, W. B., Saumon, D., & Lunine, J. I. 1993, ApJ, 406, 158
- Burrows et al. (1997) Burrows, A., Marley, M., Hubbard, W. B., Lunine, J. I., Guillot, T., Saumon, D., Freedman, R., Sudarsky, D., & Sharp, C. 1997, ApJ, 491, 856
- Burrows & Sharp (1999) Burrows, A., & Sharp, C. M. 1999, ApJ, 512, 843
- Burrows, Sudarsky, & Lunine (2003) Burrows, A., Sudarsky, D., & Lunine, J. I. 2003, ApJ, 596, 587
- Chabrier et al. (2000) Chabrier, G., Baraffe, I., Allard, F., & Hauschildt, P. 2000, ApJ, 542, 464
- Clarke, Tinney, & Covey (2002) Clarke, F. J., Tinney, C. G.., & Covey, K. R. 2002, MNRAS, 332, 361
- Cooper et al. (2003) Cooper, C. S., Sudarsky, D., Milsom, J. A., Lunine, J. I., & Burrows, A. 2003, ApJ, 586, 1320
- Cruz et al. (2003) Cruz, K. L., Reid, I. N., Liebert, J., Kirkpatrick, J. D., & Lowrance, P. J. 2003, AJ, 126, 2421
- Dahn et al. (2002) Dahn, C. C., Harris, H. C., Vrba, F. J., Guetter, H. H., Canzian, B., Henden, A. A., Levine, S. E., Luginbuhl, C. B., Monet, A. K. B., Monet, D. G., Pier, J. R., Stone, R. C., Walker, R. L., Burgasser, A. J., Gizis, J. E., Kirkpatrick, J. D., Liebert, J., & Reid, I. N. 2002, AJ, 124, 1170 (D02)
- Epchtein (1997) Epchtein, N. 1997, in The Impact of Large Scale Near-IR Sky Surveys, eds. F. Garzón, N. Epchtein, A. Omont, W. B. Burton, and P. Persei (Dordrecht: Kluwer), 15
- ESA (1997) ESA 1997, The Hipparcos and Tycho Catalogues, ESA SP-1200 (Noordwijk: ESA)
- Fegley & Lodders (1996) Fegley, B., & Lodders, K. 1996, ApJ, 472, L37
- Freed, Close, & Siegler (2003) Freed, M., Close, L. M., & Siegler, N. 2003, ApJ, 584, 453
- Geballe et al. (2002) Geballe, T. R., Knapp, G. R., Leggett, S. K., Fan, X., Golimowski, D. A., Anderson, S., Brinkmann, J., Csabai, I., Gunn, J. E., Hawley, S. L., Hennessy, G., Henry, T. J., Hill, G. J., Hindsley, R. B., Ivesić, Ž., Lupton, R. H., McDaniel, A., Munn, J. A., Narayanan, V. K., Peng, E., Pier, J. R., Rockosi, C. M., Schneider, D. P., Smith, J. A., Strauss, M. A., Tsvetanov, Z. I., Uomoto, A., York, D. G., & Zheng, W. 2002, ApJ, 564, 466 (G02)
- Geballe et al. (2001) Geballe, T. R., Saumon, D., Leggett, S. K., Knapp, G. R., Marley, M. S., & Lodders, K. 2001, ApJ, 556, 373
- Gizis et al. (2000) Gizis, J. E., Monet, D. G., Reid, I. N., Kirkpatrick, J. D., Liebert, J., & Williams, R. J. 2000, AJ, 120, 1085
- Gizis, Reid, & Hawley (2002) Gizis, J. E., Reid, I. N., & Hawley, S. L. 2002, AJ, 123, 3356
- Gliese & Jahreiss (1991) Gliese, W., & Jahreiss, H. 1991, Preliminary Version of the Third Catalogue of Nearby Stars (Heidelberg: Astronomisches Rechen–Institut)
- Goldman et al. (1999) Goldman, B., Delfosse, X., Forveille, T., Afonso, C., Alard, C., Albert, J. N., Andersen, J., Ansari, R., Aubourg, É., Bareyre, P., Bauer, F., Beaulieu, J. P., Borsenberger, J., Bouquet, A., Char, S., Charlot, X., Couchot, F., Coutures, C., Derue, F., Ferlet, R., Fouqué, P., Glicenstein, J. F., Gould, A., Graff, D., Gros, M., Haissinski, J., Hamilton, J. C., Hardin, D., de Kat, J., Kim, A., Lasserre, T., Lesquoy, É., Loup, C., Magneville, C., Mansoux, B., Marquette, J. B., Martín, E. L., Maurice, É., Milsztajn, A., Moniez, M., Palanque-Delabrouille, N., Perdereau, O., Prévot, L., Regnault, N., Rich, J., Spiro, M., Vidal-Madjar, A., Vigroux, L., & Zylberajch, S. 1999, A&A, 351, L5
- Griffith & Yelle (1999) Griffith, C. A., & Yelle, R. V. 1999, ApJ, 519, L85
- Hawley et al. (2002) Hawley, S. L., Covey, K. R., Knapp, G. R., Golimowski, D. A., Fan, X., Anderson, S. F., Gunn, J. E., Harris, H. C., Ivesić, Ž., Long, G. M., Lupton, R. H., McGehee, P. M., Narayanan, V., Peng, E., Schlegel, D., Schneider, D. P., Spahn, E. Y., Strauss, M. A., Szkody, P., Tsvetanov, Z., Walkowicz, L. M., Brinkmann, J., Harvanek, M., Hennessy, G. S., Kleinman, S. J., Krzesinski, J., Long, D., Neilsen, E. H., Newman, P. R., Nitta, A., Snedden, S. A., & York, D. G. 2002, AJ, 123, 3409
- Henry et al. (2002) Henry, T. J., Walkowicz, L. M., Barto, T. C., & Golimowski, D. A. 2002, AJ, 123, 2002
- Hernandez, Valls-Gabaud, & Gilmore (2000) Hernandez, X., Valls-Gabaud, D., & Gilmore, G. 2000, MNRAS, 316, 605
- Jones et al. (1996) Jones, H. R. A., Longmore, A. J., Allard, F., & Hauschildt, P. H. 1996, MNRAS, 280, 77
- Kirkpatrick et al. (1999a) Kirkpatrick, J. D., Allard, F., Bida, T., Zuckerman, B., Becklin, E. E., Chabrier, G., & Baraffe, I. 1999a, ApJ, 519, 834
- Kirkpatrick et al. (2001) Kirkpatrick, J. D., Dahn, C. C., Monet, D. G., Reid, I. N., Gizis, J. E., Liebert, J., & Burgasser, A. J. 2001, AJ, 121, 3235
- Kirkpatrick, Henry, & McCarthy (1991) Kirkpatrick, J. D., Henry, T. J., & McCarthy, D. W. 1991, ApJS, 77, 417
- Kirkpatrick et al. (1999b) Kirkpatrick, J. D., Reid, I. N., Liebert, J., Cutri, R. M., Nelson, B., Beichman, C. A., Dahn, C. C., Monet, D. G., Gizis, J. E., & Skrutskie, M. F. 1999b, ApJ, 519, 802
- Knapp et al. (2004) Knapp, G. R., Leggett, S. K., Fan, X., Marley, M. S., Geballe, T. R., Golimowski, D. A., Finkbeiner, D., Gunn, J. E., Hennawi, J., Ivesić, Ž., Lupton, R. H., Schlegel, D. J., Strauss, M. A., Tsvetanov, Z. I., Chiu, K., Zheng, W., Vrba, F. J., Henden, A. A., Luginbuhl, C. B., Guetter, H. H., Munn, J. A., Canzian, B., Schneider, D. P., & Brinkmann, J. 2004, AJ, in press (astro-ph/0402451) (K04)
- Koerner et al. (1999) Koerner, D. W., Kirkpatrick, J. D., McElwain, M. W., & Bonaventura, N. R. 1999, ApJ, 526, L25
- Leggett et al. (2001) Leggett, S. K., Allard, F., Geballe, T. R., Hauschildt, P. H. & Schweitzer, A. 2001, ApJ, 548, 908
- Leggett, Allard, & Hauschildt (1998) Leggett, S. K., Allard, F., & Hauschildt, P. H. 1998, ApJ, 509, 836
- Leggett et al. (2002a) Leggett, S. K., Golimowski, D. A., Fan, X., Geballe, T. R., Knapp, G. R., Brinkmann, J., Csabai, I., Gunn, J. E., Hawley, S. L., Henry, T. J., Hindsley, R., Ivesić, Ž, Lupton, R. H., Pier, J. R., Schneider, D. P., Smith, J. A., Strauss, M. A., Uomoto, A., & York, D. G. 2002a, ApJ, 564, 452 (L02)
- Leggett et al. (2002b) Leggett, S. K., Hauschildt, P. H., Allard, F., Geballe, T. R., & Baron, E. 2002b, MNRAS, 332, 78
- Leggett et al. (2003) Leggett, S. K., Hawarden, T. G., Currie, M. J., Adamson, A. J., Carroll, T. C., Kerr, T. H., Kuhn, O. P., Seigar, M. S., Varricatt, W. P., & Wold, T. 2003, MNRAS, 345, 144
- Leggett et al. (1999) Leggett, S. K., Toomey, D. W., Geballe, T. R., & Brown, R. H. 1999, ApJ, 517, L139
- Lodders (1999) Lodders, K. 1999, ApJ, 519, 793
- Marley (2000) Marley, M. 2000, ASP Conf. Ser. 212, From Giant Planets to Cool Stars, eds. C. A. Griffith & M. S. Marley (San Francisco: ASP), 152
- Marley et al. (1996) Marley, M. S., Saumon, D., Guillot, T., Freedman, R. S., Hubbard, W. B., Burrows, A., & Lunine, J. I. 1996, Science, 272, 1919
- Marley et al. (2002) Marley, M. S., Seager, S., Saumon, D., Lodders, K., Ackerman, A. S., Freedman, R. S., & Fan, X. 2002, ApJ, 568, 335
- Martín, Brandner, & Basri (1999a) Martín, E. L., Brandner, W. & Basri, G. 1999a, Science, 283, 1718
- Martín et al. (1999b) Martín, E. L., Delfosse, X., Basri, G., Goldman, B., Forveille, T., & Zapatero Osorio, M. R. 1999b, AJ, 118, 2466
- Matthews et al. (1996) Matthews, K., Nakajima, T., Kulkarni, S. R., & Oppenheimer, B. R. 1996, AJ, 112, 1678
- Nakajima et al. (1995) Nakajima, T., Oppenheimer, B. R., Kulkarni, S. R., Golimowski, D. A., Matthews, K., & Durrance, S. T. 1995, Nature, 378, 463
- Noll et al. (2000) Noll, K. S., Geballe, T. R., Leggett, S. K., & Marley, M. S. 2000, ApJ, 541, L75
- Noll, Geballe, & Marley (1997) Noll, K. S., Geballe, T. R., & Marley, M. S. 1997, ApJ, 489, L87
- Oppenheimer et al. (1998) Oppenheimer, B. R., Kulkarni, S. R., Matthews, K., & van Kerkwijk, M. H. 1998, ApJ, 502, 932
- Padgett, O’Linger, & Stapelfeldt (2003) Padgett, D., O’Linger, J., & Stapelfeldt, K. 2003, in IAU Symp. 211, Brown Dwarfs, ed. E. Martín (San Francisco: ASP), 515
- Puxley et al. (1994) Puxley, P. J., Sylvester, J., Pickup, D. A., Paterson, M. J., Laird, D. C., & Atad-Ettedgui, E. I. 1994, Proc. SPIE, 2198, 350
- Ramsay-Howat et al. (2000) Ramsay-Howat, S. K., Ellis, M. A., Gostick, D. C., Hastings, P. R., Strachan, M., & Wells, M. 2000, Proc. SPIE, 4008, 1067
- Reid & Cruz (2002) Reid, I. N., & Cruz, K. L. 2002, AJ, 123, 466
- Reid et al. (2001) Reid, I. N., Gizis, J. E., Kirkpatrick, J. D., & Koerner, D. W. 2001, AJ, 121, 489
- Reid et al. (1999) Reid, I. N., Kirkpatrick, J. D., Liebert, J., Burrows, A., Gizis, J. E., Burgasser, A., Dahn, C. C., Monet, D., Cutri, R., Beichman, C. A., & Skrutskie, M. 1999, ApJ, 521, 613
- Ruiz, Leggett, & Allard (1997) Ruiz, M. T., Leggett, S. K., & Allard, F. 1997, ApJ, 491, L107
- Saumon et al. (1994) Saumon, D., Bergeron, P., Lunine, J. I., Hubbard, W. B., & Burrows, A. 1994, ApJ, 424, 333
- Saumon et al. (2000) Saumon, D., Geballe, T. R., Leggett, S. K., Marley, M. S., Freedman, R. S., Lodders, K., Fegley, B., & Sengupta, S. K. 2000, ApJ, 541, 374
- Saumon et al. (2003) Saumon, D., Marley, M. S., Lodders, K., & Freedman, R. S. 2003, in IAU Symp. 211, Brown Dwarfs, ed. E. Martín (San Francisco: ASP), 345
- Schweitzer et al. (2002) Schweitzer, A., Gizis, J. E., Hauschildt, P. H., Allard, F., Howard, E. M., & Kirkpatrick, J. D. 2002, ApJ, 566, 435
- Simons & Tokunaga (2002) Simons, D. A., & Tokunaga A. T. 2002, PASP, 114, 169
- Skrutskie et al. (1997) Skrutskie, M. F., et al. 1997, in The Impact of Large Scale Near-IR Sky Surveys, eds. F. Garzón, N. Epchtein, A. Omont, W. B. Burton, and P. Persei (Dordrecht: Kluwer), 25
- Stephens (2003) Stephens, D. C. 2003, in IAU Symp. 211, Brown Dwarfs, ed. E. Martín (San Francisco: ASP), 355
- Stephens & Leggett (2004) Stephens, D. C., & Leggett, S. K. 2004, PASP, 116, 9
- Stephens et al. (2001) Stephens, D. C., Marley, M. S., Noll, K. S., & Chanover, N. 2001, ApJ, 556, L97
- Tinney (1996) Tinney, C. G. 1996, MNRAS, 281, 644
- Tinney, Burgasser, & Kirkpatrick (2003) Tinney, C. G., Burgasser, A. J., & Kirkpatrick, J. D. 2003, AJ, 126, 975
- Tinney et al. (1995) Tinney, C. G., Reid, I. N., Gizis, J., & Mould, J. R. 1995, AJ, 110, 3014
- Tokunaga & Kobayashi (1999) Tokunaga, A. T., & Kobayashi, N. 1999, AJ, 117, 1010
- Tokunaga, Simons, & Vacca (2002) Tokunaga, A. T., Simons, D. A., & Vacca, W. D. 2002, PASP, 114, 180
- Tsuji (2002) Tsuji, T. 2002, ApJ, 575, 264
- Tsuji & Nakajima (2003) Tsuji, T., & Nakajima, T. 2003, ApJ, 585, L151
- Tsuji & Ohnaka (1995) Tsuji, T., & Ohnaka, K. 1995, in Elementary Processes in Dense Plasmas, eds. S. Ichimaru and S. Ogata (Reading: Addison-Wesley), 193
- Tsuji, Ohnaka, & Aoki (1995) Tsuji, T., Ohnaka, K., & Aoki, W. 1995, in The Bottom of the Main Sequence and Beyond, ed. C. G. Tinney (Berlin: Springer), 45
- van Altena, Lee, & Hoffleit (1995) van Altena, W. F., Lee, J. T., & Hoffleit, E. D. 1995, The General Catalogue of Trigonometric Stellar Parallaxes (4th ed.; New Haven: Yale Univ. Obs.)
- Vrba et al. (2004) Vrba, F. J., Henden, A. A., Luginbuhl, C. B., Guetter, H. H., Munn, J. A., Canzian, B., Burgasser, A. J., Kirkpatrick, J. D., Fan, X., Geballe, T. R., Golimowski, D. A., Knapp, G. R., Leggett, S. K., Schneider, D. P., & Brinkmann, J. 2004, AJ, in press (astro-ph/0402272) (V04)
- York et al. (2000) York, D. G., et al. 2000, AJ, 120, 1579
| Spectral | (error)bbBased on weighted mean of referenced trigonometric parallaxes. | ReferencesccReferences for principal spectral type, trigonometric parallax, and multiplicity: (1) Kirkpatrick, Henry, & McCarthy 1991, (2) ESA 1997, (3) van Altena, Lee, & Hoffleit 1995, (4) Nakajima et al. 1995, (5) Martín et al. 1999b, (6) Goldman et al. 1999, (7) Henry et al. 2002, (8) Gliese & Jahreiss 1991, (9) G02, (10) Gizis et al. 2000, (11) Tinney 1996, (12) Freed, Close, & Siegler 2003, (13) Tinney et al. 1995, (14) Dahn et al. 2002, (15) Knapp et al. 2004, (16) Reid et al. 2001, (17) Becklin & Zuckerman 1988, (18) Vrba et al. 2004, (19) Leggett et al. 2002b, (20) Koerner et al. 1999, (21) Martín, Brandner, & Basri 1999a, (22) Kirkpatrick et al. 1999b, (23) Kirkpatrick et al. 2001, (24) Tinney, Burgasser, & Kirkpatrick 2003, (25) Burgasser et al. 2003b, (26) Classified on scheme of G02 using spectra of Burgasser et al. 2002a, (27) Burgasser et al. 2003c (28) Burgasser et al. 2000 | ||||
|---|---|---|---|---|---|---|
| NameaaIAU approved designations for 2MASS and SDSS point sources are “2MASS Jhhmmss[.]ssddmmss[.]s” and “SDSS Jhhmmss.ssddmmss.s,” where the equatorial coordinates are given at equinox J2000. Preliminary designations are given for 2MASS sources whose IAU-approved designations are unpublished. | Type | (mas) | (error)bbBased on weighted mean of referenced trigonometric parallaxes. | SpT | Mult. | |
| Gl 229A | M1 | 173.17 ( 1.10) | 1.192 (0.014) | 1 | 2,3 | 4 |
| LHS 102A | M3.5 | 104.7 (11.4 ) | 0.100 (0.236) | 5 | 3 | 6 |
| LHS 315 | M4 | 298.72 ( 1.35) | 2.376 (0.010) | 7 | 2,3 | |
| LHS 11 | M4.5 | 224.8 ( 2.9 ) | 1.759 (0.028) | 1 | 3 | |
| LHS 333AB | M5.5 + M7 | 227.9 ( 4.6 ) | 1.789 (0.044) | 8 | 3 | 8 |
| LHS 36 | M6 | 419.1 ( 2.1 ) | 3.112 (0.011) | 9 | 3 | |
| LHS 292 | M6.5 | 220.3 ( 3.6 ) | 1.715 (0.035) | 9 | 3 | |
| LHS 3003 | M7 | 156.3 ( 3.0 ) | 0.970 (0.042) | 9 | 3 | |
| LP 326–21ddAlso known as 2MASSW J1444171+300214. | M8 | 10 | ||||
| LP 349–25eeAlso known as 2MASSW J0027559+221932. | M8 | 10 | ||||
| LHS 2397aAB | M8 + L7.5 | 68.65 ( 1.87) | 0.817 (0.059) | 8 | 3,11 | 12 |
| TVLM 513–46546 | M8.5 | 94.5 ( 0.6 ) | 0.123 (0.014) | 9ffName abbreviated to T 513 by G02. | 13,14 | |
| LHS 2065 | M9 | 117.3 ( 1.5 ) | 0.346 (0.028) | 9ggMisidentified as “LHS 2025” by G02. | 3 | |
| LHS 2924 | M9 | 92.4 ( 1.3 ) | 0.172 (0.031) | 1 | 3 | |
| BRI 0021–0214 | M9.5 | 84.2 ( 2.6 ) | 0.373 (0.067) | 9hhName abbreviated to BRI 0021 by G02. | 3,13 | |
| 2MASS J03454316+2540233 | L1 | 37.1 ( 0.5 ) | 2.153 (0.029) | 9 | 14 | |
| 2MASS J14392836+1929149 | L1 | 69.6 ( 0.5 ) | 0.787 (0.016) | 15 | 14 | |
| 2MASS J07464256+2000321AB | L1 + L2 | 81.9 ( 0.3 ) | 0.434 (0.008) | 9 | 14 | 16 |
| DENIS-P J1058.7–1548 | L3 | 57.7 ( 1.0 ) | 1.194 (0.038) | 9 | 14 | |
| GD 165B | L3 | 31.7 ( 2.5 ) | 2.495 (0.171) | 9 | 3 | 17 |
| Kelu-1 | L3 | 53.6 ( 2.0 ) | 1.354 (0.081) | 9 | 14 | |
| 2MASS J22244381–0158521 | L3.5 | 87.02 ( 0.89) | 0.302 (0.022) | 15 | 14,18 | |
| 2MASS J00361617+1821104 | L4 | 114.2 ( 0.8 ) | 0.288 (0.015) | 9 | 14 | |
| LHS 102B | L4.5 | 104.7 (11.4 ) | 0.100 (0.236) | 19 | 3 | 6 |
| SDSS J053951.99–005902.0 | L5 | 76.12 ( 2.17) | 0.593 (0.062) | 9 | 18 | |
| SDSS J224953.47+004404.6 | L5 | 9 | ||||
| 2MASS J15074769–1627386 | L5.5 | 136.4 ( 0.6 ) | 0.674 (0.010) | 15 | 14 | |
| SDSS J010752.33+004156.1 | L5.5 | 64.13 ( 4.51) | 0.965 (0.153) | 9 | 18 | |
| DENIS-P J0205.4–1159AB | L5.5 + L5.5 | 50.6 ( 1.5 ) | (0.064) | 9 | 14 | 20 |
| 2MASS J08251968+2115521 | L6 | 94.22 ( 0.88) | (0.020) | 9 | 14,18 | |
| DENIS-P J1228.2–1547AB | L6 + L6 | 49.4 ( 1.9 ) | 1.531 (0.084) | 9 | 14 | 21 |
| 2MASS J08503593+1057156AB | L6 + L8.5 | 33.84 ( 2.69) | 2.353 (0.173) | 22 | 14,18 | 18 |
| 2MASS J16322911+1904407 | L7.5 | 65.02 ( 1.77) | 0.935 (0.059) | 9 | 14 | |
| 2MASS J22443167+2043433 | L7.5 | 15 | ||||
| Gl 584CiiAlso known as 2MASS J15232263+3014562. | L8 | 54.37 ( 1.14) | 1.323 (0.046) | 9 | 2,3,18 | 23 |
| SDSS J003259.36+141036.6 | L8 | 30.14 ( 5.16) | 2.604 (0.372) | 9 | 18 | |
| SDSS J085758.45+570851.4 | L8 | 9 | ||||
| 2MASS J03105986+1648155 | L9 | 9 | ||||
| 2MASS J09083803+5032088 | L9jjClassified as L5 by Cruz et al. (2003) from optical spectrum. | 15 | ||||
| SDSS J080531.80+481233.0 | L9 | 15 | ||||
| SDSS J083008.12+482847.4 | L9 | 76.42 ( 3.43) | 0.584 (0.097) | 9 | 18 | |
| 2MASS J03284265+2302051 | L9.5 | 33.13 ( 4.20) | 2.399 (0.275) | 9 | 18 | |
| SDSS J204749.61–071818.3 | L9.5 | 15 | ||||
| SDSS J042348.57–041403.5 | T0 | 65.93 ( 1.70) | 0.905 (0.056) | 9 | 18 | |
| SDSS J120747.17+024424.8 | T0 | 15 | ||||
| SDSS J015141.69+124429.6 | T1 | 46.73 ( 3.37) | 1.652 (0.157) | 9 | 18 | |
| SDSS J075840.33+324723.4 | T2 | 15 | ||||
| SDSS J125453.90–012247.4 | T2 | 73.96 ( 1.59) | 0.655 (0.047) | 9 | 18,24 | |
| SDSS J102109.69–030420.1 | T3 | 35.35 ( 4.24) | 2.258 (0.260) | 9 | 18,24 | |
| 2MASSI J2254188+312349 | T4 | 15 | ||||
| 2MASS J05591914–1404488 | T4.5 | 96.73 ( 0.96) | 0.072 (0.022) | 9 | 14,18 | |
| 2MASS J15031961+2525196 | T5.5 | 25 | ||||
| 2MASS J15344984–2952274AB | T5.5 + T5.5 | 73.6 ( 1.2 ) | 0.666 (0.035) | 26 | 24 | 27 |
| Gl 229B | T6 | 173.17 ( 1.10) | 1.192 (0.014) | 9 | 2,3 | 4 |
| 2MASSI J0243137–245329 | T6 | 93.62 ( 3.63) | 0.143 (0.084) | 26 | 18 | |
| 2MASS J09373487+2931409 | T6kkLabelled “peculiar” by Burgasser et al. (2002a) because of low -band flux. | 162.84 ( 3.88) | 1.059 (0.052) | 15 | 18 | |
| SDSS J123147.39+084730.7 | T6 | 15 | ||||
| SDSS J162414.37+002915.6 | T6 | 90.73 ( 1.03) | 0.211 (0.025) | 9 | 14,18,24 | |
| 2MASS J12255432–2739466AB | T6 + T8 | 74.79 ( 2.03) | 0.631 (0.059) | 9 | 18,24 | 27 |
| Gl 570DllAlso known as 2MASSW J1457150–212148. | T8 | 170.16 ( 1.45) | 1.154 (0.019) | 9 | 2,3 | 28 |
| 2MASSI J0727182+171001 | T8 | 110.14 ( 2.34) | 0.210 (0.046) | 15 | 18 | |
| 2MASS J12171110–0311131 | T8 | 93.20 ( 2.06) | 0.153 (0.048) | 9 | 18,24 | |
| 2MASSI J0415195–093506 | T9 | 174.34 ( 2.76) | 1.207 (0.034) | 15 | ||
| Name | (error) | Imager | Date | (error) | Imager | Date |
|---|---|---|---|---|---|---|
| SDSS J0032+1410 | 13.35 (0.05) | UIST | 2003 Sep 04 | |||
| SDSS J0151+1244 | 13.54 (0.05) | IRCAM | 2001 Nov 25 | |||
| DENIS J0205–1159AB | 12.10 (0.20) | IRCAM | 2001 Nov 23 | |||
| 2MASS J0243–2453 | 13.25 (0.05) | IRCAM | 2001 Nov 24 | |||
| 2MASS J0328+2302 | 13.33 (0.05) | UIST | 2003 Nov 08 | |||
| 2MASS J0415–0935 | 13.28 (0.05) | IRCAM | 2001 Nov 25 | 12.82 (0.15) | IRCAM | 2001 Nov 25 |
| SDSS J0423–0414 | 11.90 (0.05) | UIST | 2003 Jan 04 | |||
| SDSS J0539–0059 | 11.87 (0.10) | UIST | 2003 Jan 04 | |||
| 2MASS J0727+1710 | 13.68 (0.05) | IRCAM | 2001 Nov 25 | |||
| SDSS J0758+3247 | 11.94 (0.03) | UIST | 2003 Jan 04 | |||
| SDSS J0758+3247 | 12.06 (0.05) | UIST | 2003 Nov 10 | |||
| SDSS J0805+4812 | 12.31 (0.05) | UIST | 2003 Nov 10 | |||
| 2MASS J0908+5032 | 11.37 (0.06) | IRCAM | 2002 Jun 18 | 11.95 (0.20) | UIST | 2002 Dec 06 |
| 2MASS J0937+2931 | 12.34 (0.05) | IRCAM | 2001 Nov 24 | 11.74 (0.10) | IRCAM | 2001 Nov 25 |
| Gl 229A | 4.04 (0.05) | IRCAM | 2001 Nov 23 | |||
| Gl 229B | 12.24 (0.05) | IRCAM | 2001 Nov 23 | 11.74 (0.10) | IRCAM | 2001 Nov 23 |
| SDSS J1021–0304 | 13.64 (0.05) | IRCAM | 2001 Nov 23 | |||
| SDSS J1207+0244 | 12.62 (0.05) | UIST | 2003 May 16 | |||
| SDSS J1231+0847 | 13.52 (0.05) | UIST | 2003 May 16 | |||
| Kelu-1 | 11.22 (0.10) | IRCAM | 2002 Jun 21 | |||
| 2MASS J1439+1929 | 11.13 (0.06) | IRCAM | 2002 Jun 18 | |||
| 2MASS J1503+2525 | 11.91 (0.05) | UIST | 2003 Jan 04 | 12.25 (0.15) | UIST | 2003 May 16 |
| 2MASS J1507–1627 | 10.69 (0.05) | IRCAM | 2002 Jun 18 | |||
| 2MASS J1534–2952AB | 12.58 (0.05) | UIST | 2003 May 17 | |||
| SDSS J2047–0718 | 13.80 (0.05) | IRCAM | 2001 Nov 25 | |||
| 2MASS J2224–0158 | 10.90 (0.05) | IRCAM | 2002 Jul 15 | 11.32 (0.05) | UIST | 2003 Jun 04 |
| 2MASS J2244+2043 | 12.11 (0.03) | UIST | 2003 Jan 04 | |||
| SDSS J2249+0044 | 12.71 (0.07) | UIST | 2003 Jun 18 | |||
| 2MASS J2254+3123 | 13.24 (0.05) | IRCAM | 2001 Nov 24 |
| Name | Spectral Type | (error)aaBased on weighted mean trigonometric parallaxes. See Table 1. | (error) | – (error) | – (error) |
|---|---|---|---|---|---|
| Gl 229Abb from Leggett et al. (2002b). | M1 | 5.25 (0.05) | 4.06 (0.05) | 0.09 (0.07) | 0.02 (0.07) |
| LHS 102Acc from Leggett et al. (2002b). | M3.5 | 7.63 (0.24) | 7.53 (0.05) | 0.20 (0.06) | |
| LHS 315 | M4 | 7.62 (0.01) | 5.24 (0.01) | 0.41 (0.04) | |
| LHS 11 | M4.5 | 8.08 (0.08) | 6.32 (0.07) | 0.33 (0.08) | |
| LHS 333AB | M5.5 + M7 | 7.42 (0.07) | 5.63 (0.05) | 0.45 (0.06) | |
| LHS 36dd from Reid & Cruz (2002). | M6 | 8.82 (0.05) | 5.71 (0.05) | 0.35 (0.06) | 0.14 (0.06) |
| LHS 292dd from Reid & Cruz (2002). | M6.5 | 9.16 (0.06) | 7.45 (0.05) | 0.50 (0.06) | 0.20 (0.07) |
| LHS 3003 | M7 | 9.40 (0.05) | 8.43 (0.03) | 0.50 (0.05) | |
| LP 326–21ee from Reid & Cruz (2002). | M8 | 10.09 (0.07) | 0.30 (0.12) | ||
| LP 349–25ee from Reid & Cruz (2002). | M8 | 9.15 (0.07) | 0.24 (0.12) | ||
| LHS 2397aAB | M8 + L7.5 | 9.21 (0.06) | 10.03 (0.02) | 0.66 (0.04) | |
| TVLM 513–46546 | M8.5 | 9.92 (0.08) | 10.04 (0.08) | 0.65 (0.09) | |
| LHS 2065e,fe,ffootnotemark: | M9 | 9.74 (0.08) | 9.39 (0.07) | 0.52 (0.05) | 0.23 (0.10) |
| LHS 2924 | M9 | 9.95 (0.04) | 10.12 (0.03) | 0.60 (0.05) | |
| BRI 0021–0214 | M9.5 | 9.41 (0.15) | 9.78 (0.13) | 0.75 (0.14) | |
| 2MASS J0345+2540 | L1 | 9.86 (0.10) | 12.01 (0.10) | 0.65 (0.11) | |
| 2MASS J1439+1929 | L1 | 10.01 (0.05) | 10.80 (0.05) | 0.67 (0.06) | 0.33 (0.08) |
| 2MASS J0746+2000ABdd from Reid & Cruz (2002). | L1 + L2 | 9.24 (0.03) | 9.67 (0.03) | 0.76 (0.04) | 0.35 (0.08) |
| DENIS J1058–1548 | L3 | 10.43 (0.11) | 11.62 (0.10) | 0.93 (0.11) | |
| GD 165B | L3 | 10.43 (0.18) | 12.93 (0.07) | 1.16 (0.08) | |
| Kelu-1 | L3 | 9.43 (0.17) | 10.78 (0.15) | 1.00 (0.16) | 0.44 (0.18) |
| 2MASS J2224–0158gg from Knapp et al. (2004). | L3.5 | 10.60 (0.05) | 10.90 (0.05) | 1.08 (0.06) | 0.42 (0.07) |
| 2MASS J0036+1821 | L4 | 10.37 (0.05) | 10.08 (0.05) | 0.96 (0.06) | 0.27 (0.07) |
| LHS 102Bcc from Leggett et al. (2002b). | L4.5 | 10.51 (0.24) | 10.41 (0.05) | 0.95 (0.06) | |
| SDSS J0539–0059 | L5 | 10.73 (0.08) | 11.32 (0.05) | 1.08 (0.06) | 0.55 (0.11) |
| SDSS J2249+00 | L5 | 12.71 (0.07) | 1.69 (0.08) | ||
| 2MASS J1507–1627 | L5.5 | 10.65 (0.03) | 9.98 (0.03) | 1.31 (0.04) | 0.71 (0.06) |
| SDSS J0107+0041 | L5.5 | 11.10 (0.17) | 12.06 (0.07) | 1.52 (0.08) | |
| DENIS J0205–1159AB | L5.5 + L5.5 | 9.96 (0.12) | 11.44 (0.10) | 1.55 (0.10) | 0.66 (0.22) |
| 2MASS J0825+2115 | L6 | 11.40 (0.04) | 11.53 (0.03) | 1.40 (0.04) | |
| DENIS J1228–1547AB | L6 + L6 | 9.89 (0.13) | 11.42 (0.10) | 1.29 (0.11) | |
| 2MASS J0850+1057AB | L6 + L8.5 | 10.59 (0.18) | 12.94 (0.05) | 1.41 (0.06) | |
| 2MASS J1632+1904 | L7.5 | 11.60 (0.08) | 12.54 (0.05) | 1.43 (0.07) | |
| 2MASS J2244+2043gg from Knapp et al. (2004). | L7.5 | 12.11 (0.03) | 1.79 (0.04) | ||
| Gl 584C | L8 | 11.54 (0.07) | 12.86 (0.05) | 1.49 (0.07) | |
| SDSS J0032+1410 | L8 | 10.75 (0.38) | 13.35 (0.05) | 1.64 (0.07) | |
| SDSS J0857+5708 | L8 | 11.31 (0.05) | 1.63 (0.06) | 0.19 (0.11) | |
| 2MASS J0310+1648 | L9 | 12.54 (0.05) | 1.64 (0.06) | ||
| 2MASS J0908+5032gg from Knapp et al. (2004). | L9 | 11.37 (0.06) | 1.52 (0.07) | 0.58 (0.21) | |
| SDSS J0805+4812 | L9 | 12.31 (0.05) | 1.20 (0.06) | ||
| SDSS J0830+4828 | L9 | 11.40 (0.11) | 11.98 (0.05) | 1.70 (0.06) | |
| 2MASS J0328+2302 | L9.5 | 10.93 (0.28) | 13.33 (0.05) | 1.54 (0.06) | |
| SDSS J2047–0718gg from Knapp et al. (2004). | L9.5 | 13.80 (0.05) | 1.54 (0.06) | ||
| SDSS J0423–0414 | T0 | 10.55 (0.08) | 11.45 (0.05) | 1.51 (0.06) | 0.45 (0.07) |
| SDSS J1207+0244gg from Knapp et al. (2004). | T0 | 12.62 (0.05) | 1.54 (0.06) | ||
| SDSS J0151+1244 | T1 | 11.89 (0.16) | 13.54 (0.05) | 1.64 (0.07) | |
| SDSS J0758+3247g,hg,hfootnotemark: | T2 | 11.97 (0.03) | 1.90 (0.04) | ||
| SDSS J1254–0122 | T2 | 11.60 (0.07) | 12.25 (0.05) | 1.59 (0.06) | 0.40 (0.21) |
| SDSS J1021–0304 | T3 | 11.38 (0.26) | 13.64 (0.05) | 1.62 (0.07) | |
| 2MASS J2254+3123gg from Knapp et al. (2004). | T4 | 13.24 (0.05) | 1.79 (0.06) | ||
| 2MASS J0559–1404 | T4.5 | 12.07 (0.05) | 12.14 (0.05) | 1.59 (0.06) | 0.01 (0.16) |
| 2MASS J1503+2525gg from Knapp et al. (2004). | T5.5 | 11.91 (0.05) | 2.08 (0.06) | 0.34 (0.16) | |
| 2MASS J1534–2952ABgg from Knapp et al. (2004). | T5.5 + T5.5 | 11.91 (0.06) | 12.58 (0.05) | 2.33 (0.06) | |
| Gl 229B | T6 | 13.43 (0.05) | 12.24 (0.05) | 2.12 (0.06) | 0.50 (0.11) |
| 2MASS J0243–2453gg from Knapp et al. (2004). | T6 | 13.11 (0.10) | 13.25 (0.05) | 2.09 (0.06) | |
| 2MASS J0937+2931gg from Knapp et al. (2004). | T6 | 13.40 (0.07) | 12.34 (0.05) | 3.05 (0.08) | 0.60 (0.11) |
| SDSS J1231+0847gg from Knapp et al. (2004). | T6 | 13.52 (0.05) | 1.94 (0.06) | ||
| SDSS J1624+0029 | T6 | 13.39 (0.05) | 13.60 (0.04) | 2.01 (0.06) | |
| 2MASS J1225–2739AB | T6 + T8 | 12.59 (0.10) | 13.22 (0.08) | 2.06 (0.09) | |
| Gl 570D | T8 | 14.13 (0.05) | 12.98 (0.05) | 2.54 (0.07) | |
| 2MASS J0727+1710gg from Knapp et al. (2004). | T8 | 13.89 (0.07) | 13.68 (0.05) | 2.01 (0.06) | |
| 2MASS J1217–0311 | T8 | 13.81 (0.07) | 13.96 (0.05) | 1.96 (0.06) | |
| 2MASS J0415–0935gg from Knapp et al. (2004). | T9 | 14.49 (0.06) | 13.28 (0.05) | 2.55 (0.06) | 0.46 (0.16) |
| Polynomial coefficients | |||||||||
|---|---|---|---|---|---|---|---|---|---|
| aa | RMSbbUnits are magnitudes except where noted. | ||||||||
| – | 0.49 | 4.0760e+00 | 1.9467e+01 | 2.1584e+01 | 1.1235e+01 | 1.9583e+00 | |||
| – | 0.43 | 8.2327e+00 | 6.9722e+00 | 3.3255e+00 | 6.5907e01 | ||||
| M1 SpTccFit requires numerical translation of spectral types: M1–M9.5 1–9.5, L0–L9.5 10–19.5, T0–T9 20–29. T9 | 0.35 | 4.3095e+00 | 1.1450e+00 | 8.0385e02 | 2.4832e03 | 2.2539e05 | |||
| M1 SpTccFit requires numerical translation of spectral types: M1–M9.5 1–9.5, L0–L9.5 10–19.5, T0–T9 20–29. T9 | 0.45 | 3.5211e+00 | 1.1826e+00 | 6.4508e02 | 1.2549e03 | ||||
| BCK | M6 SpTccFit requires numerical translation of spectral types: M1–M9.5 1–9.5, L0–L9.5 10–19.5, T0–T9 20–29. T9 | 0.13 | 3.9257e+00 | 3.8338e01 | 5.3597e02 | 2.6550e03 | 4.0859e05 | ||
| M6 SpTccFit requires numerical translation of spectral types: M1–M9.5 1–9.5, L0–L9.5 10–19.5, T0–T9 20–29. T9 | 124 K | 1.4322e+04 | 5.1287e+03 | 9.0951e+02 | 8.3099e+01 | 4.0323e+00 | 9.8598e02 | 9.5373e04 | |
| Spectral | (error)bbBased on weighted mean of referenced trigonometric parallaxes. | Measured | Estimatedcc estimated from dwarfs in Table 1 with similar spectral types and colors. Errors include dispersions from fits to – versus spectral type (§4.1) of 0.06 mag (M dwarfs), 0.15 mag (L dwarfs), and 0.16 mag (T dwarfs). | ReferencesddReferences for spectral type, trigonometric parallax, and photometry: (1) G02, (2) V04, (3) L02, (4) K04, (5) Classified on scheme of G02 using spectra of Burgasser et al. 2002a, (6) Tinney, Burgasser, & Kirkpatrick 2003 | ||||
|---|---|---|---|---|---|---|---|---|
| NameaaNaming protocol as described in Table 1. | Type | (mas) | (error)bbBased on weighted mean of referenced trigonometric parallaxes. | (error) | (error) | SpT | ||
| SDSS J225529.09-003433.4 | M8.5 | 16.19 ( 2.59) | 3.954 (0.347) | 10.33 (0.35) | 9.68 (0.36) | 1 | 2 | 3 |
| SDSS J144600.60+002452.0 | L5 | 45.46 ( 3.25) | 1.712 (0.155) | 12.09 (0.16) | 10.83 (0.23) | 1 | 2 | 3 |
| SDSS J132629.82–003831.5 | L5.5 | 49.98 ( 6.33) | 1.506 (0.275) | 12.66 (0.28) | 11.25 (0.32) | 1 | 2 | 4 |
| SDSS J083717.21–000018.0 | T0.5 | 33.70 (13.45) | 2.362 (0.867) | 13.62 (0.87) | 12.04 (0.88) | 1 | 2 | 3 |
| SDSS J175032.96+175903.9 | T3.5 | 36.24 ( 4.53) | 2.204 (0.271) | 13.82 (0.28) | 12.11 (0.32) | 1 | 2 | 3 |
| SDSS J020742.83+000056.2 | T4.5 | 34.85 ( 9.87) | 2.289 (0.615) | 14.33 (0.62) | 12.54 (0.64) | 1 | 2 | 3 |
| 2MASSI J2356547–155310 | T6 | 68.97 ( 3.42) | 0.807 (0.108) | 14.92 (0.11) | 12.98 (0.19) | 5 | 2 | 4 |
| SDSS J134646.45-003150.4 | T6 | 69.07 ( 2.09) | 0.804 (0.066) | 14.93 (0.08) | 12.87 (0.18) | 1 | 2,6 | 3 |
| 2MASSI J1047538+212423 | T6.5 | 98.75 ( 3.30) | 0.027 (0.073) | 16.17 (0.08) | 13.67 (0.18) | 1 | 2,6 | 3 |
| (K) | ||||||
|---|---|---|---|---|---|---|
| Name | Spectral Type | (error) | BCK (error) | log (error) | RangeaaRange of for assumed ages of 0.1–10 Gyr and known parallax uncertainties. The ages of Gl 229AB, LHS 102AB, GD 165B, Gl 584C, Gl 570D, and Kelu-1 have been further constrained observationally (see footnote 13). | 3 Gyrbb at age Gyr, unless otherwise noted. |
| Gl 229Acc, BCK and log from Leggett et al. (2002b). | M1 | 7.97 (0.09) | 2.63 (0.07) | 1.29 (0.02) | 3750–3775 | 3755 |
| LHS 102Acc, BCK and log from Leggett et al. (2002b). | M3.5 | 10.55 (0.25) | 2.72 (0.06) | 2.32 (0.10) | 3200–3300 | 3275 |
| LHS 36 | M6 | 12.18 (0.08) | 3.01 (0.07) | 2.97 (0.02) | 2650–2900 | 2900 |
| LHS 292 | M6.5 | 12.65 (0.09) | 2.98 (0.07) | 3.16 (0.03) | 2475–2750 | 2725 |
| LHS 3003 | M7 | 12.95 (0.09) | 3.05 (0.07) | 3.28 (0.03) | 2350–2650 | 2600 |
| SDSS J2255–0034dd estimated from spectral type and colors (§4.3). | M8.5 | 13.51 (0.36) | 3.18 (0.07) | 3.50 (0.14) | 2000–2525 | 2400 |
| TVLM 513–46546 | M8.5 | 13.73 (0.08) | 3.16 (0.07) | 3.59 (0.02) | 2025–2325 | 2300 |
| LHS 2065 | M9 | 13.47 (0.09) | 3.21 (0.07) | 3.49 (0.02) | 2150–2425 | 2400 |
| BRI 0021–0214 | M9.5 | 13.37 (0.10) | 3.21 (0.07) | 3.45 (0.03) | 2150–2475 | 2425 |
| 2MASS J0345+2540 | L1 | 13.75 (0.08) | 3.24 (0.07) | 3.60 (0.02) | 2000–2325 | 2300 |
| 2MASS J1439+1929 | L1 | 13.88 (0.07) | 3.20 (0.06) | 3.66 (0.02) | 1950–2275 | 2250 |
| 2MASS J0746+2000AB | L1 + L2 | 13.26 (0.07) | 3.26 (0.06) | 3.41 (0.02) | 1900–2225eeAssuming uneclipsed components of equal luminosity. | 2200eeAssuming uneclipsed components of equal luminosity. |
| DENIS J1058–1548 | L3 | 14.73 (0.09) | 3.37 (0.07) | 4.00 (0.03) | 1600–1950 | 1900 |
| GD 165B | L3 | 14.90 (0.19) | 3.31 (0.07) | 4.06 (0.07) | 1750–1925 | 1850 |
| Kelu-1 | L3 | 13.74 (0.11) | 3.31 (0.07) | 3.59 (0.04) | 2100–2350 | 2300ff synthesized from spectra of G02. |
| 2MASS J2224–0158 | L3.5 | 15.14 (0.07) | 3.46 (0.06) | 4.15 (0.02) | 1475–1800 | 1750 |
| 2MASS J0036+1821 | L4 | 14.67 (0.07) | 3.34 (0.06) | 3.97 (0.02) | 1650–1975 | 1900 |
| LHS 102Bcc, BCK and log from Leggett et al. (2002b). | L4.5 | 14.89 (0.25) | 3.43 (0.06) | 4.05 (0.10) | 1750–1975 | 1850 |
| SDSS J0539–0059 | L5 | 15.12 (0.09) | 3.31 (0.06) | 4.15 (0.03) | 1475–1800 | 1750 |
| SDSS J1446+0024dd estimated from spectral type and colors (§4.3). | L5 | 15.43 (0.18) | 3.34 (0.07) | 4.27 (0.07) | 1300–1725 | 1650 |
| 2MASS J1507–1627 | L5.5 | 15.16 (0.07) | 3.20 (0.06) | 4.16 (0.02) | 1475–1800 | 1750 |
| SDSS J0107+0041 | L5.5 | 15.93 (0.17) | 3.32 (0.06) | 4.47 (0.06) | 1175–1550 | 1475 |
| SDSS J1326–0038dd estimated from spectral type and colors (§4.3). | L5.5 | 15.94 (0.28) | 3.28 (0.06) | 4.48 (0.11) | 1150–1600 | 1475 |
| DENIS J0205–1159AB | L5.5 + L5.5 | 14.71 (0.09) | 3.20 (0.06) | 3.98 (0.03) | 1350–1700eeAssuming uneclipsed components of equal luminosity. | 1650eeAssuming uneclipsed components of equal luminosity. |
| 2MASS J0825+2115 | L6 | 16.10 (0.07) | 3.30 (0.06) | 4.54 (0.02) | 1175–1475 | 1425 |
| DENIS J1228–1547AB | L6 + L6 | 14.50 (0.11) | 3.32 (0.07) | 3.90 (0.04) | 1400–1775eeAssuming uneclipsed components of equal luminosity. | 1700eeAssuming uneclipsed components of equal luminosity. |
| 2MASS J1632+1904 | L7.5 | 16.23 (0.11) | 3.19 (0.07) | 4.59 (0.03) | 1150–1450 | 1375 |
| Gl 584C | L8 | 16.20 (0.11) | 3.17 (0.09) | 4.58 (0.04) | 1300–1400 | 1350ff given for middle of age range given in footnote 13. |
| SDSS J0032+1410dd estimated from spectral type and colors (§4.3). | L8 | 15.46 (0.39) | 3.07 (0.09) | 4.28 (0.15) | 1250–1800 | 1650 |
| SDSS J0830+4828 | L9 | 16.19 (0.13) | 3.09 (0.08) | 4.58 (0.05) | 1125–1475 | 1400 |
| 2MASS J0328+2302dd estimated from spectral type and colors (§4.3). | L9.5 | 15.53 (0.29) | 3.06 (0.08) | 4.31 (0.11) | 1250–1750 | 1625 |
| SDSS J0423–0414 | T0 | 15.11 (0.10) | 3.05 (0.08) | 4.14 (0.04) | 1450–1825 | 1750 |
| SDSS J0837–0000dd estimated from spectral type and colors (§4.3). | T0.5 | 16.50 (0.87) | 2.88 (0.09) | 4.70 (0.35) | 900–1600 | 1300 |
| SDSS J0151+1244 | T1 | 16.46 (0.19) | 2.93 (0.09) | 4.68 (0.07) | 1050–1425 | 1300 |
| SDSS J1254–0122 | T2 | 16.08 (0.10) | 2.90 (0.08) | 4.54 (0.04) | 1150–1500 | 1425 |
| SDSS J1021–0304 | T3 | 15.76 (0.28) | 2.76 (0.09) | 4.40 (0.11) | 1200–1650 | 1525 |
| SDSS J1750+1759dd estimated from spectral type and colors (§4.3). | T3.5 | 16.35 (0.29) | 2.53 (0.09) | 4.64 (0.11) | 1050–1475 | 1350 |
| 2MASS J0559–1404 | T4.5 | 16.07 (0.13) | 2.41 (0.13) | 4.53 (0.05) | 1150–1500 | 1425 |
| SDSS J0207+0000dd estimated from spectral type and colors (§4.3). | T4.5 | 16.80 (0.63) | 2.47 (0.13) | 4.82 (0.25) | 875–1450 | 1200 |
| 2MASS J0243–2453 | T6 | 17.45 (0.15) | 2.25 (0.13) | 5.08 (0.06) | 825–1150 | 1025 |
| 2MASS J0937+2931 | T6 | 17.96 (0.16) | 1.51 (0.14)ggStrongly depressed -band flux produces atypical BCK. | 5.28 (0.05) | 725–1000 | 900 |
| 2MASS J2356–1553dd estimated from spectral type and colors (§4.3). | T6 | 17.26 (0.17) | 2.34 (0.13) | 5.00 (0.06) | 875–1200 | 1075 |
| Gl 229Bcc, BCK and log from Leggett et al. (2002b). | T6 | 17.77 (0.08) | 2.22 (0.07) | 5.21 (0.02) | 850–1050 | 950 |
| SDSS J1346–0031dd estimated from spectral type and colors (§4.3). | T6 | 17.25 (0.15) | 2.32 (0.13) | 5.00 (0.06) | 875–1200 | 1075 |
| SDSS J1624+0029 | T6 | 17.64 (0.14) | 2.24 (0.13) | 5.16 (0.05) | 800–1100 | 975 |
| 2MASS J1225–2739AB | T6 + T8 | 16.86 (0.14) | 2.21 (0.13) | 4.85 (0.05) | 800–1100eeAssuming uneclipsed components of equal luminosity. | 975eeAssuming uneclipsed components of equal luminosity. |
| 2MASS J1047+2124 | T6.5 | 18.13 (0.15) | 1.96 (0.13) | 5.35 (0.06) | 725–950 | 900 |
| 2MASS J0727+1710 | T8 | 18.14 (0.14) | 2.24 (0.13) | 5.35 (0.05) | 725–950 | 900 |
| 2MASS J1217–0311 | T8 | 18.05 (0.14) | 2.28 (0.13) | 5.32 (0.05) | 725–975 | 900 |
| Gl 570D | T8 | 18.57 (0.14) | 1.90 (0.13) | 5.53 (0.05)hh is weighted mean of values listed in Table 2. | 784–824hhlog and from Geballe et al. (2001). | 800 |
| 2MASS J0415–0935 | T9 | 19.07 (0.13) | 2.03 (0.13) | 5.73 (0.05) | 600–750 | 700 |