Discovery of Face-On Counterparts of Chain Galaxies in the Tadpole ACS Field
Abstract
The background field of the Tadpole galaxy image taken with the Hubble Space Telescope ACS contains 87 clump-clusters that are probably low-inclination versions of the 69 chain galaxies we found in a previous paper. This conclusion follows from the similarity in colors and apparent magnitudes of the brightest clumps in the clump-clusters and chain galaxies, and from the similarity between the distribution of axial ratios for the combined sample and the distribution for normal disk galaxies. These distributions are consistent with chains and clump-clusters being disks viewed at random angles with intrinsic axial ratios of or less. The disks appear to be gas-rich galaxies at z=1 to 2 that are forming an early generation of stars in a small number of very large star complexes.
1 Introduction
Deep high resolution images of distant galaxy fields, such as the GOODS fields (Giavalisco et al. 2004) which include the Hubble Deep Field North (Williams et al. 1996) and the Chandra Deep Field South (Volonteri, Saracco, & Chincarini 2000), and the Hubble Deep Field South (Casertano et al. 2000), provide direct evidence for processes related to galaxy formation and evolution. A variety of unusual morphologies is evident, including linear structures called chain galaxies (Cowie, Hu, & Songaila 1995; van den Bergh et al. 1996). In the GOODS-South field, Moustakas et al. (2004) identified 275 extremely red objects and classified 41 of them as “others,” which included chain and low surface brightness galaxies. The spectral energy distributions of these “others” from U through K band did not distinguish between elliptical, disk, and irregular types even though their visual appearances varied greatly.
To study chain galaxies in more detail, we surveyed faint linear features in the Hubble Space Telescope Advanced Camera for Surveys (HST ACS) field of the Tadpole galaxy, UGC 10214, finding 69 chain galaxies, 37 double-core galaxies, 21 tadpole-shaped galaxies, and 32 edge-on normal galaxies distinguished by a central bulge and approximately exponential disk (Elmegreen et al. 2004; hereafter Paper I). All of the chain, double, and tadpole systems were shown to have similarly bright clumps, probably the result of star formation, that are bluer and fainter than the centralized bulges of most normal galaxies. The chain galaxies were also shown to dominate all linear types at apparent I-band AB magnitudes fainter then 24th mag. We suggested that chains are edge-on irregular galaxies that have no bulges or exponential disks (see also Dalcanton & Schectman 1996, Reshetnikov, Dettmar, & Combes 2003). Two possible examples of faint face-on chains were shown.
We have now surveyed the ACS field of the Tadpole Galaxy for all faint objects larger than 0.5 arcsec, not only those with linear structures. These include 87 possible face-on versions of chain galaxies, 191 normal spiral galaxies of all inclinations, and 34 round, centrally-concentrated galaxies that could be ellipticals. The face-on versions of chain galaxies appear mostly as small collections of blue clumps with very faint emission between. To avoid the presumption that they are complete galaxies before spectra or deeper images are available, we call them “clump-clusters,” as in Paper I. The normal galaxies are distinguished by their bright central concentrations of light, which are presumably bulges, and by their approximately exponential disks.
We show here that the clumps in clump-clusters have the same colors and magnitudes as the clumps in linear chain galaxies, that both types of clumps are distinct from the bulges in normal galaxies (which are apparently brighter and extend to redder colors), and that clump-clusters are slightly brighter than chain galaxies – presumably as a result of projection – even though their average surface brightnesses are comparable or slightly fainter. We also show that the distribution of axial ratios for chain galaxies and clump-clusters is similar to the distribution for local disk galaxies. These observations demonstrate that chain galaxies are edge-on irregular disks, and their face-on counterparts are visible as clump-clusters. The properties of the chain/clump-cluster systems are then reviewed.
2 Observations
Archival HST ACS images of UGC 10214 (Tran et al. 2003) were visually surveyed in the V (F606W) and I (F814W) filters to examine galaxies in the deep background field. All objects with a major axis greater than 10 pixels (0.5 arcsec) were included, 470 total. Axial ratios were determined from contour levels above sky noise. Photometry was done in each of the g (F475W), V, and I filters using the IRAF task imstat to define a box encompassing each galaxy at the contour level, which corresponds to a surface brightness of 25.5 mag arcsec-2. Conversions to AB magnitudes are given in Paper I. Photometry was also done on any bright or centralized bulges or hotspots. Radial profiles were made in I band along the major axis of each galaxy using the IRAF task pvector with 3-pixel-wide strips. Galaxies were divided into the four morphological categories of Paper I based on the V and I-band images, profiles, and contour maps. These categories are: chain (70 galaxies), double (49), tadpole (39), and spiral (191), in addition to elliptical (34) and clump-cluster (87).
3 Results
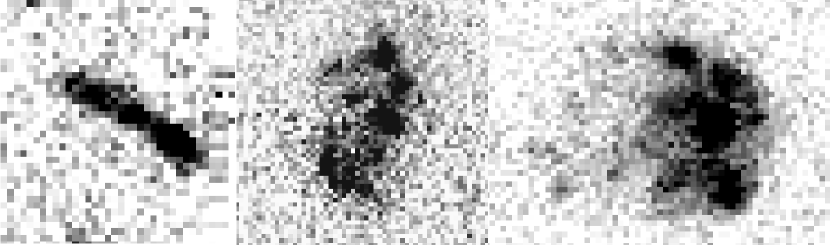
Figure 1 shows a sample chain galaxy on the left and two sample clump-clusters on the right (see also Paper I for other examples). The pixel sizes are 0.05” and the fields measure 1.8”, 2.85”, and 3.05” in the left-right dimension. As is typical for chain galaxies and clump-clusters, all three systems are dominated by a small number of very large blue clumps. We are proposing here that chain galaxies are edge-on projections of the clump-clusters, and if this is the case, then the overall properties of the clumps and whole systems should be similar.
Figure 2 shows color-magnitude diagrams (CMD) of the brightest clumps in chain galaxies and clump-clusters (on the top left) and of the whole chain and clump-cluster systems (top right), with different types distinguished by different symbols. The bottom panels show the CMDs for centralized clumps in normal galaxies and for the whole normal galaxies in the same deep field. The clumps in chain galaxies and clump-clusters have the same distribution of colors and magnitudes, and these colors overlap the distribution in normal galaxies, which have a prominent red component in addition. The region of overlap is somewhat blue, suggesting that clumps in chains, clump-clusters, and normal galaxies are star-forming regions. The clumps in chain and clump-cluster systems average about 1 magnitude fainter than in the normal galaxies, as do the whole chain and clump-cluster systems compared to the whole galaxies.
Figure 3 shows the I-band AB magnitude distributions for all the clumps and whole galaxies. As suggested by Figure 2, the clumps in the chain and clump-cluster systems are virtually identical and they are about 1 magnitude fainter than in normal galaxies. Whole chain galaxies are also fainter than whole clump-clusters by about 1 magnitude. This is to be expected if chain galaxies are edge-on projections of clump-clusters: the larger projected surface areas of the clump-clusters give them a higher absolute brightness because of extinction in the edge-on disks, even though clump-clusters can have slightly fainter average surface brightnesses because of the smaller line-of-sight path lengths through their disks (Paper I). In fact, the average clump cluster included here has about the same surface brightness as the average chain galaxy: 24.0 mag arcsec-2; this is likely to be a reflection of their dominance near the brightness limit of the survey (which is 25.5 mag arcsec-2 at ; Paper I). Figure 3 also indicates that whole galaxies are brighter than chains and clump-clusters (in the right-hand figure) by about the same margin as for the clumps (in the left-hand figure), suggesting a closer distance or larger size for normal galaxies.
The distribution of the ratio of axes is shown in Figure 4. For a uniform population of thin disks viewed at random angles, this distribution should be flat between 0 and 1. For a thick ellipsoidal disk with intrinsic ratio of axes , it should follow the curve (Sandage, Freeman, & Stokes 1970), which is constant for , for and for . A dispersion in for a sample of galaxies broadens the singularity at into a bump with comparable breadth. The distribution for combined chains + clump-clusters is shown on the top left in Figure 4 and the distribution for all galaxies in the Third Reference Catalogue of Bright Galaxies (RC3, de Vaucouleurs et al. 1991) is shown in the rest of the figure, with different lines for different disk types ( for Sa, for Sm, etc). The combined chain + clump-cluster type has a distribution of axial ratios that has about the same shape as the distribution for nearby disk galaxies: somewhat flat at , a bump at , and a fall off at . Evidently, the chain galaxies are the mostly edge-on members of a somewhat uniform population of irregular disk galaxies: the clump-clusters fill in the near-uniform distribution for more face-on orientations. For the chain + clump-cluster systems the minimum axial ratio in our sample is , which should be comparable to the intrinsic relative disk thickness convolved with the instrument resolution. For nearby normal galaxies, the minimum value is smaller for . Local irregulars of type are apparently not disky because their axial ratio distribution rises for large ratios.
4 Discussion
Chain galaxies appear to be edge-on versions of clumpy, disky, nearly-circular irregular galaxies. They have no prominent bulges or exponential disks like the normal galaxies in the same deep field (Paper I), and there are no obvious spiral arms, bars, or rings as in modern disk galaxies. They contain 3 to 5 enormous clumps, which appear to be star-forming regions pc in size given the blue colors and likely range of cosmological between 1 and 2. These redshifts are consistent with photometric and spectroscopic redshifts of chain galaxies with similar angular sizes measured in the HDF, as noted by comparing our objects with objects in the online interactive redshift images of the HDF North (Fernandez-Soto, Lanzetta, & Yahil 1999) and South (Yahata et al. 2000). At these redshifts, the I passband corresponds to rest frame ultraviolet where local late-type galaxies also have prominent star formation (e.g., Windhorst et al. 2002), although generally with smaller regions.
The disk-like structure of chains and clump-clusters inferred from the distribution of axial ratios suggests that most of them did not form by dissipationless mergers of pre-existing clumps. Such mergers would make more spheroidal systems. On the other hand, numerical simulations of young galaxy disks show gravitational instabilities forming M⊙ clumps like those observed here; the intermediate stages resemble our clump-clusters and the clumps eventually merge into bulges (Noguchi 1999). Our observations are consistent with this picture. The large sizes of our star-forming regions suggest that gaseous velocity dispersions are high during disk instabilities, perhaps 20-40% of the rotation speeds (the ratio of the velocity dispersion to the rotation speed is approximately equal to the square root of the intrinsic ratio of axes). The prominence of clumps rather than spiral arms suggests further that gaseous densities are much higher than the critical tidal density from the rotation curve, i.e., background shear is slow compared to unstable growth. Most likely, the disks are nearly pure gas when the instabilities begin (Noguchi 1999). If the observed clumps do not merge into bulges, then they could form the old stellar disks of today’s galaxies. With high velocity dispersions, these old disk components should be thick.
We are grateful to J. Blakeslee, H. Ford, and J. Mack for providing reduced images of the Tadpole field, and to an anonymous referee for helpful comments. B.G.E. is grateful to NSF for support under the grant AST-0205097.
References
- (1) Casertano, S. et al. 2000, AJ, 120, 2747
- (2) Cowie, L., Hu, E., & Songaila, A. 1995, AJ, 110, 1576
- (3) Dalcanton, J.J., & Schectman, S.A. 1996, ApJ, 465, L9
- (4) de Vaucouleurs, G., de Vaucouleurs, A., Corwin, H., Buta, R., Paturel, G., & Fouque, P. 1991, Third Reference Catalogue of Galaxies, New York: Springer-Verlag
- (5) Elmegreen, D.M., Elmegreen, B.G., & Sheets, C. 2004, ApJ, 603, in press (Paper I; astro-ph/0401364)
- (6) Fernandez-Soto, A., Lanzetta, K., & Yahil, A. 1999, ApJ, 513, 34
- (7) Giavalisco, M. et al., 2004, ApJ, 600, L93
- (8) Moustakas, L. et al. 2004, ApJ, 600, L131
- (9) Noguchi, M. 1996, ApJ, 514, 77
- (10) Reshetnikov, V., Dettmar, R.-J., & Combes, F. 2003, A&A, 399, 879
- (11) Sandage, A., Freeman, K.C., & Stokes, N.R. 1970, ApJ, 160, 831
- (12) Tran, H. et al. 2003, ApJ, 585, 750
- (13) van den Bergh, S., Abraham, R.G., Ellis, R.S., Tanvir, N.R., Santiago, B.X., & Glazebrook, K.G. 1996, AJ 112, 359
- (14) Volonteri, M., Saracco, P., & Chincarini, G. 2000, A&AS, 145, 111
- (15) Williams, R., et al. 1996, AJ, 112, 1335
- (16) Windhorst, R.A., et al. 2002, ApJS, 143, 113
- (17) Yahata, N. et al. 2000, ApJ, 538, 493