731
P.A. Caraveo
Geminga: a tale of two tails, and much more
Abstract
We report on the deep (100 ksec) XMM-Newton/EPIC observation of the field of the Geminga pulsar. The unprecedented throughput of the instrument allowed to detect two elongated parallel x-ray tails trailing the neutron star. They are aligned with the object’s supersonic motion, extend for 2’, and have a nonthermal spectrum produced by electron-synchrotron emission in the bow shock between the pulsar wind and the surrounding medium. Electron lifetime against synchrotron cooling matches the source transit time over the x-ray features’ length. Such an x-ray detection of a pulsar bow shock allows us to gauge the pulsar electron injection energy and the shock magnetic field while constraining the angle of Geminga’s motion and the local matter density. We give also preliminary results on the timing and spectral analysis of the 63,000 photons collected from the neutron star.
keywords:
Pulsars: individual (Geminga) – Stars: neutron – X-ray: stars – X-ray: ISM1 Introduction
Geminga is a nearby, middle-aged isolated neutron star (Bignami & Caraveo, 1996). Proximity is a key-parameter for understanding the multiwavelength behaviour of this source discovered in high-energy gamma-rays and later identified in X-rays (Bignami et al., 1983) and optical wavelengths (Bignami et al., 1988). The smoking gun, confirming the previous work based on the interpretation of positional coincidence, came with the ROSAT discovery of a 237 msec periodicity (Halpern & Holt, 1992), immediately seen also at higher energy in contemporary EGRET data (Bertsch et al. 1992) as well as in COS-B archival data (Bignami & Caraveo, 1992). At the same time, significant proper motion was discovered at optical wavelengths (Bignami et al., 1993), definitely linking the proposed counterpart to a fast-moving, pulsar-like object, the distance to which was later nailed down to 160 pc through its optical parallax (Caraveo et al., 1996). Thus, Geminga qualifies as a pulsar, and as such is listed in the pulsar catalogue111http://www.atnf.csiro.au/research/pulsar/psrcat/, although it has not been detected at radio wavelengths. Indeed, the absence of a radio signal prompted Caraveo, et al. (1996b) to use this source as the prototype of a new class of pulsars: the radio-quiet ones, now encompassing the so called “dim sources” (Treves et al., 2000), the CCO (Pavlov et al., 2002), the next Geminga (Halpern et al., 2002) and other potential candidates, including a number of proposed counterparts of EGRET sources. Gamma-ray emission is not a common characteristics of these radio quiet INSs. Rather, their common denominator is their thermal soft X-ray emission coupled with very faint (if any) optical radiation. Here we report on the XMM-Newton/EPIC data of a long Geminga exposure which almost triples the number of soft photons available from this source. Such improved statistics allows to study the object’s light curve as a function of the photon energy. The total (average) source spectral shape can be assessed using three independent instruments, while the time-tagging of photons allows, for the first time, to follow the evolution of the source spectral shape as a function of phase.
2 The EPIC data
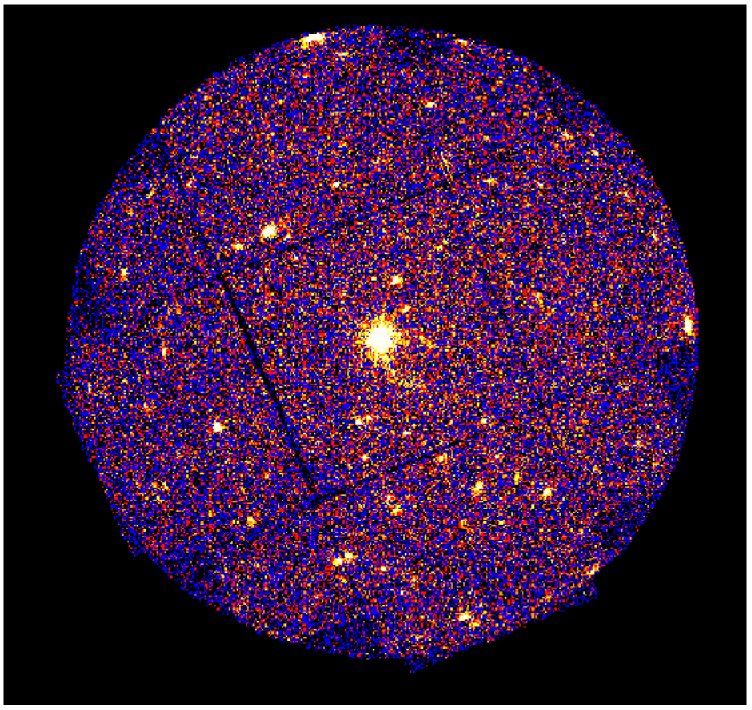
XMM-Newton performed a 100 ksec exposure on Geminga on April 4th, 2002. While the two MOS EPIC cameras were operated with the medium filter in their “full frame” mode (Turner et al. 2001), the pn camera was operated with the thin filter in “small window” mode to allow for accurate timing of source photons (Strüder et al., 2001). Data were processed with the XMM Newton Science Analysis Software (SAS version 5.4.1). After removing time intervals with high particle background and correcting for the dead time, we obtain a net exposure time of 55.0 ksec for the pn camera and 76.9 and 77.4 ksec for the MOS1 and MOS2, respectively. The Geminga count rates (0.2E7 keV) are 0.8070.004 counts s-1 for the pn and 0.1190.001 counts s-1 and 0.1230.001 counts s-1 for the MOS1 and MOS2, respectively. The sum of the MOS1 and MOS2 images is shown in Figure 1. Besides Geminga, which shines at the center of the image, more than 100 serendipitous sources have been detected. Identification work is in progress on such sources and will be reported elsewhere. For a thorough discussion of the “tails”, which are seen by EPIC for the first time as trailing Geminga and well aligned with the source proper motion, the reader is referred to Caraveo et al. (2003). Briefly, we recall here the most important characteristics of this newly-discovered X-ray feature of Geminga.
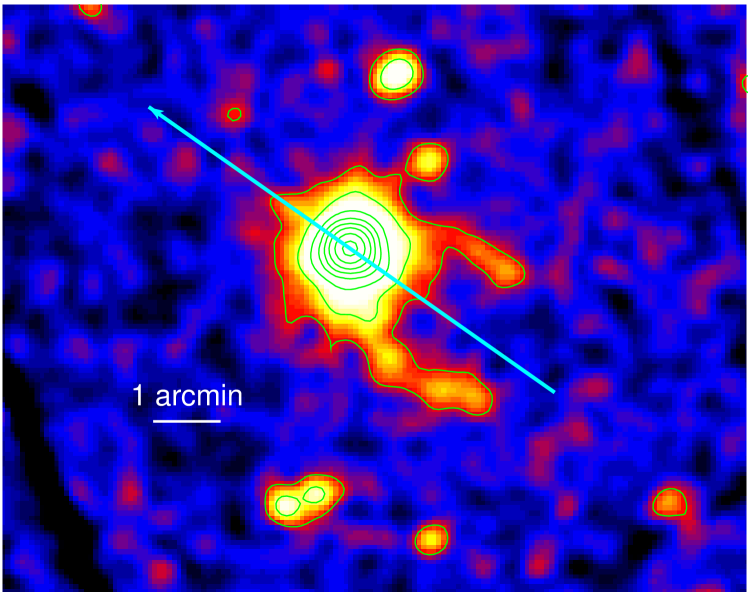
The tails are two patterns of diffuse emission, originating close to Geminga (they cannot be resolved in proximity of the bright point source closer than 40′′ at most) and extending up to arcmin away from the pulsar, well aligned with the NS proper motion, with a thickness of . Their spectrum is well reproduced by a slightly absorbed () power law with photon index . At the pulsar distance (160 parsecs), their unabsorbed 0.3-5 keV flux corresponds to a luminosity of 6.5 erg s-1 ( of Geminga’s rotational energy loss). Possible contributions from point sources are estimated to be negligible.
The shape of the tails is reminiscent of the projection on the plane of the sky of an empty paraboloid of X-ray emission, the edges of which show up brighter because of a limb effect. Such a morphology is naturally explained in terms of a bow-shock formed between the pulsar relativistic wind and the dynamical pressure generated by its supersonic motion through the interstellar medium.
The hard, power-law spectrum of the tails can be explained by synchrotron emission of high-energy electrons accelerated by the pulsar, girating in the shocked interstellar magnetic field. Such an interpretation provides a direct gauge of the pulsar wind injection energy, demonstrating that Geminga accelerates electrons up to 1014 eV, a value very close to the upper limits expected on the basis of the pulsar’s energetics, allowing also to constrain the local interstellar magnetic field in the range 2-3 . The Larmor radius of the emitting electrons in the bow-shock magnetic field ( at the distance of Geminga) is found to be in excellent agreement with the observed thickness of the tails. Moreover, electron lifetime against synchrotron emission ( years) matches the pulsar transit time over the X-ray features’ length ( years, on the basis of the well known proper motion of Geminga), supplying a final, independent consistency check to our model.
The observed geometry of the tails, compared to a 3-D bow-shock model assuming a spherical pulsar wind in an homogeneous ISM, allows also to constrain the angle of the source motion with respect to the plane of the sky to be less than , and therefore to assess its 3-D space velocity. The detection of the pulsar bow-shock represents also an important way to probe the interstellar medium, constraining its density to be in the range 0.06-0.15 atoms cm-3, in good agreement with the expected value of the ISM density for the region around Geminga (Gehrels & Chen 1993).

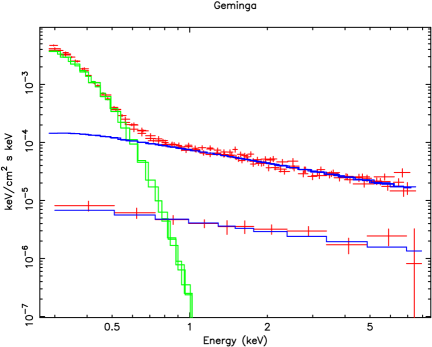
The good EPIC statistics allows for an accurate spectrum to be drawn, for the first time, of both the pulsar and its tails, in the range 0.2 to 7 keV. Fig.2 shows such time-averaged spectrum of both the pulsar (upper curve) and its surrounding diffuse emission, drawn on the source energy flux scale. Note that the upper curve plots both the pn and the 2 MOS data (superimposed and undistinguishable), while the lower curve for the extended emission (tails) contains MOS data only, since the pn camera was used in “small window” mode. While a more detailed interpretation of the source physics as portrayed by Fig.2 will be the topic of an upcoming work, we propose here a few qualitative, obvious comments. The point-source spectrum (upper curve) shows with a striking clarity that two different mechanisms are at work. Below keV, the emission is undoubtely thermal, well fit by a temperature of 43 eV, implying an emitting surface of km at 160 parsec. For the whole energy decade 0.7-7 keV, Geminga’s spectrum is equally well fit by a single power law, with photon index 1.85. The simplest interpretation of such hard power law (already suggested by the ROSAT data of Halpern & Holt, 1992) is that of synchrotron emission by energetic electrons radiating in the pulsar magnetic field.
For the diffuse emission from the tails (lower curve of Fig.2) a striking similarity is apparent with the hard spectral shape of the point source. This points to a similar physical origin between the source and the tails hard X-ray photons. The latter, however, must necessarily be created by the high energy (1014 eV) end of the pulsar electron spectrum, since they radiate in the compressed IS magnetic field of G.
3 Timing analysis
Exploiting the much improved EPIC energy resolution with respect to both ASCA and ROSAT, our data allow, for the first time, to render apparent the pulsar light curve morphology variation as a function of photon energy.
Fig. 3 shows such energy-resolved time curves for four different energy ranges: 0.15-0.35, 0.35-0.7, 0.7-2.0 and 2.0-6.0 keV. The light curve morphology variation is apparent. The lower energy, thermal emission has a smooth light curve featuring a single, wide peak. At high energy, two peaks are present during each phase interval, separated by 0.4 phase. It is, at the moment, not possible to relate in absolute phase the EPIC X-ray peaks to the EGRET -ray peaks; however, we note the striking similarity between the two non-thermal light curves of the same object. A phase shift of about 0.3 phase is also obviously present between the single peak of the thermal emission and the highest of the two non-thermal peaks. As expected, the “intermediate” energy range (0.35 to 0.7 keV) shows a somewhat mixed behaviour due to the symultaneous presence of the two components. Such components are obviously of very different physical origin, also possibly in terms of production zone. Finally, we note that the pulsed fraction of the radiation as a function of energy does not seem to show the spectacular variation proposed by Jackson et al. (2002) on the basis of ASCA data. In particular, the EPIC data do not confirm a pulsed fraction as high as, e.g., 80% or greater at high energy (E4 keV). A final analysis of all aspects of light curve morphology variation with energy is currently in progress and will be published elsewhere.
4 An EPIC remark
The EPIC observation yielded a total of 63,000 photons. The vast majority of the EPIC harvest is due to the pn detector with 44,400 photon with the MOS1 and MOS2 detectors contributing 9,150 and 9520 photons respectively. The tails, which are made up by few hundreds photons, are not included in this budget. When compared with the 27,000 soft X-ray photons gathered during the ROSAT lifetime in the energy range (0.1-2.4 keV) and the 6,500 collected by ASCA in the energy range (0.7-8 keV), our EPIC observations stands out for its much improved statistics. Since the part of the spectrum benifitting most from the high troughput of the XMM-Newton telescope is the “high energy” one, it comes as no surprise that the EPIC spectrum constrain much better the high energy part of the source spectrum as well as its time-resolved behaviour.
References
- Bertsch et al. (1992) Bertsch, D. L. et al. 1992, Nature, 357, 306
- Bignami & Caraveo (1992) Bignami, G. F. & Caraveo, P. A. 1992, Nature, 357, 287
- Bignami & Caraveo (1996) Bignami G.F. & Caraveo P.A., 1996, ARA&A, 34, 331
- Bignami et al. (1983) Bignami G. F., Caraveo P. A., & Lamb R. C., 1983, ApJL, 272, L9
- Bignami, Caraveo, & Mereghetti (1993) Bignami, G. F., Caraveo, P. A., & Mereghetti, S. 1993, Nature, 361, 704
- Bignami, Caraveo, & Paul (1988) Bignami, G. F., Caraveo, P. A., & Paul, J. A. 1988, A&A, 202, L1
- Caraveo et al. (2003) Caraveo, P. A., Bignami, G. F., DeLuca, A., Mereghetti, S., Pellizzoni, A., Mignani, R., Tur, A., & Becker, W. 2003, Science, 301, 1345
- Caraveo, Bignami, Mignani, & Taff (1996) Caraveo, P. A., Bignami, G. F., Mignani, R., & Taff, L. G. 1996, ApJ, 461, L91
- Caraveo, Bignami, & Trumper (1996) Caraveo, P. A., Bignami, G. F., & Trumper, J. E. 1996b, A&A Rev., 7, 209
- Gehrels & Chen (1993) Gehrels, N. & Chen, W. 1993, Nature, 361, 706
- Halpern, Gotthelf, Mirabal, & Camilo (2002) Halpern, J. P., Gotthelf, E. V., Mirabal, N., & Camilo, F. 2002, ApJ, 573, L41
- Halpern & Holt (1992) Halpern, J. P. & Holt, S. S. 1992, Nature, 357, 222
- Jackson, Halpern, Gotthelf, & Mattox (2002) Jackson, M. S., Halpern, J. P., Gotthelf, E. V., & Mattox, J. R. 2002, ApJ, 578, 935
- Pavlov, Sanwal, Garmire, & Zavlin (2002) Pavlov, G. G., Sanwal, D., Garmire, G. P., & Zavlin, V. E. 2002, ASP Conf. Ser. 271: Neutron Stars in Supernova Remnants, 247
- Strüder et al. (2001) Strüder, L. et al. 2001, A&A, 365, L18
- Taylor, Manchester, & Lyne (1993) Taylor, J. H., Manchester, R. N., & Lyne, A. G. 1993, ApJS, 88, 529
- Treves, Turolla, Zane, & Colpi (2000) Treves, A., Turolla, R., Zane, S., & Colpi, M. 2000, PASP, 112, 297
- Turner et al. (2001) Turner, M. J. L. et al. 2001, A&A, 365, L27