731
A. De Luca \mailvia Bassini 15, 20133 Milano
The EPIC/MOS view of the 2-8 keV Cosmic X-ray Background Spectrum
Abstract
We have measured the spectrum of the Cosmic X-ray Background (CXB) in the 2-8 keV range with the high throughput EPIC/MOS instrument onboard XMM-Newton. A large sample of high galactic latitude observations was used, covering a total solid angle of 5.5 square degrees. Our study is based on a very careful characterization and subtraction of the instrumental background, which is crucial for a robust measurement of the faintest diffuse source of the X-ray sky. The CXB spectrum is consistent with a power law having a photon index , with a 2-10 keV flux of (2.240.16) erg cm-2 s-1 deg-1 (90% confidence level, including the absolute flux calibration uncertainty). Our results are in excellent agreement with two of the most recent CXB measurements, performed with BeppoSAX LECS/MECS data (Vecchi et al. 1999) and with an independent analysis of XMM-Newton EPIC/MOS data (Lumb et al. 2002), providing a very strong constrain to the absolute sky surface brightness in this energy range, so far affected by a 40% uncertainty. Our measurement immediately implies that the fraction of CXB resolved by the recent deep X-ray observations in the 2-10 keV band is of % (1), suggesting the existence of a new population of faint sources, largely undetected within the current sensitivity limits of the deepest X-ray surveys.
keywords:
X-rays: diffuse background – Cosmology: diffuse radiation – Surveys – Instrumentations: detectors1 Introduction
The discovery of a diffuse background radiation in the X-ray sky
dates back
to the birth of X-ray astronomy: the first evidence was obtained by
during the same rocket experiment which led to the
discovery of Sco X-1, the first extra-solar X-ray source (Giacconi
et al. 1962).
Later observations have demonstrated that the bulk of Cosmic X-ray
Background (CXB)
above energies of 2 keV is of extragalactic origin, due to
sources
below the detection threshold.
The first wide band measures of the CXB were
made by HEAO1 (1977): the CXB spectrum in the 210 keV
range was
well described by a simple power law with photon index
1.4 (Marshall et al. 1980).
More recently, several measurements of the CXB spectrum
have been obtained at energies below 10 keV. While the results on
the spectral
shape confirmed a power law with , the normalization
of the CXB
remained highly uncertain as a consequence of large discrepancies
(well beyond
the statistical errors) among the different determinations. A
difference as
large as % is found from the highest measured value
(Vecchi et al. 1999, using SAX data) to the lowest one (the
original HEAO-1 experiment, Marshall et al. 1980).
Barcons et al. (2000)
showed that cosmic variance cannot account for the differences
among the
previous measures of the CXB intensity, concluding that systematic
errors and cross-calibration differences must have some
role. Measurements published after the analysis of Barcons et al.
(2000), namely Lumb et al. (2002) with XMM-Newton EPIC and
Kushino et
al. (2002) with ASCA/GIS, while differing by 15% only,
either because of
the small covered solid angle (Lumb et al. 2002), or because of
large
uncertainties in
the stray light assessment (Kushino et al. 2002), do not allow to
constrain the
value
of the CXB normalization to a much narrower range.
Such an uncertainty on the intensity represents a severe limit
to the definition of a big picture, explaining which are the
sources of the CXB and
constraining their cosmological properties, in spite of the wealth
of information coming from the deep pencil-beam
X-ray surveys (Chandra Deep Field North, Brandt et al. 2001;
Chandra Deep Field
South, Giacconi et al. 2002), medium-deep wide angle X-ray surveys
(HELLAS2XMM,
Baldi et al. 2002) and their multiwavelength follow-up
Campaigns. Even a basic information such
as the resolved fraction of the CXB cannot be firmly evaluated.
We have obtained a new measurement of the CXB spectrum in the 2-8
keV range with the EPIC/MOS111 the pn camera,
having different characteristics, will require a different
approach cameras onboard XMM-Newton.
Our study of the CXB is based on a large sample of high galactic latitude
pointings for a total
solid angle of 5.5 square degrees, reducing the effects of
cosmic variance. Our analysis includes a very robust characterization
of the instrumental background properties, which is crucial for a
robust measurement of the faintest diffuse source of the
X-ray sky. Here we shall briefly report on some highlights of our
study. The reader is referred to De Luca & Molendi (2004) for more
details.
2 The EPIC/MOS instrumental background
The EPIC/MOS cameras (Turner et al., 2001) have appropriate characteristics to study extended sources with low surface brighteness, offering a large collecting area ( cm2) and good spectral resolution (2% @ 6 keV) over a broad energy range (0.212 keV) and a wide field of view ( 15 arcmin radius). However such detectors suffer a rather high instrumental background (Non X-ray Background, NXB).
2.1 Different components of the MOS NXB
The EPIC NXB can be divided into two parts: an electronic noise component, which is important only at the lower energies (below 0.3 keV), and a particle-induced component which dominates above 0.3 keV and is due to the interaction of particles in the orbital environment with the detectors and the structures that surround them. The particle-induced NXB is the sum of two different components:
-
•
Low energy particles (E a few tens of keV) accelerated in the Earth magnetosphere can reach the detectors scattering through the telescope mirrors, generating events which are almost indistinguishable from valid X-ray photons. When a concentrated cloud of such particles is channeled by the telescope mirrors to the focal plane, a sudden increase (up to three orders of magnitude) of the quiescent count rate is observed (the so-called “soft proton flares”) An extreme time variability (time scale ranging from s to several hours) is the fingerprint of this background component; it will be hereafter called the “flaring” NXB or “Soft Proton” (SP) NXB.
An additional component of background can be generated by a steady flux of low energy particles, reaching the detectors through the telescope optics at a uniform rate. -
•
High energy particles (E a few MeV) generate a signal which is mostly discarded on-board on the basis of an upper energy thresholding and of a PATTERN analysis of the events (see e.g. Lumb et al. 2002). The unrejected part of this signal represent an important component of the MOS NXB. Its temporal behaviour is driven by the flux of energetic particles; its variability has therefore a time scale much larger than the length of a typical observation. We will refer to this NXB component as to the “quiescent” background.
2.2 How to deal with the MOS NXB
It is quite easy to identify the flaring background: a light curve can
immediately show the time
intervals affected by an high background count rate. Such intervals
are unusable for the analysis of faint diffuse sources and have to
be
rejected with the so-called Good Time Interval (GTI) filtering.
After the application of the GTI, a residual component of soft
proton
background may survive. Low-amplitude flares, yielding
little
variations to the quiescent count rate, could be missed by the GTI
threshold. Moreover, a slow time variability could hamper the
identification of a “flare” by means of a
time
variability analysis. In such cases the unrejected NXB component
may
be revealed with a surface brightness analysis. As stated before,
low
energy particles are focused by the mirrors and therefore the
spatial
distribution of the induced NXB varies across the plane of the
detectors.
A rather large portion of the MOS detectors is not exposed to the sky
(hereafter called “out Field Of View”, out FOV) and
therefore
neither cosmic X-ray photons nor low energy particle induced events
are
collected there.
A comparison of the out FOV and in FOV surface brightness
allows to identify and reject the
observations affected by an anomalous low-energy particle NXB.
The final step required to remove the effects of NXB is to account
for
the quiescent component. The only way to solve the problem is
to get an independent
measurement of its spectrum.
Its subtraction from the total (CXBquiescent
NXB) spectrum yields the pure
CXB spectrum. The crucial problem is that the NXB spectrum,
resulting
from a non-symultaneous measurement, must be representative of the
actual
quiescent NXB which is present in a typical observation of the sky.
There are two ways to measure the quiescent NXB in the MOS.
Firstly,
through the
analysis of the out FOV regions, where neither X-ray photons nor
soft
protons
can reach the focal plane through reflections/scatterings by the
telescope
optics. Secondly, through the study of the observations with
the filter wheel in closed position: an
aluminium window prevents X-ray photons and low energy particles
from
reaching the detectors.
Our analysis (see De Luca & Molendi 2004 for details) fully confirmed
the feasibility of such approach, favouring the
choice of the closed observations over the out FOV, as the former
provides an NXB spectrum better suited to study the CXB.
3 Data preparation and analysis
Our study is based on a rather large sample of MOS data including
calibration, performance verification and granted time
observations;
public observations retrieved through the XMM-Newton Science
Archive
facility were also used. The initial dataset consist of a
compilation
of (mostly) blank sky fields observations and a list of
observations
performed with the filter wheel in closed position.
We selected only high galactic latitude fields
(). We avoided pointings towards the Magellanic Clouds,
Cluster of Galaxies, as well as observations of very bright
targets. The selected fields were observed between revolution number 57
and revolution number 437. We retrieved the closed observations
performed
in the same time interval, between revolution 25 and 462.
In our analysis we included all of the serendipitous sources detected
in the sky fields. We cut out only the bright target (if any) of the
observation in order to get an unbiased measure of the CXB.
We have developed an ad-hoc
pipeline to perform the different steps of the analysis,
from raw data to the extraction of the spectra, in an
automated way.
A detailed description of such algorithm is given by De Luca & Molendi
(2004) and will not be reported here.
4 Spectral analysis and results
The final dataset includes 42 sky fields for the MOS1 camera and 43 for the
MOS2. The total exposure time is of 1.15 Ms per camera. The solid angle
covered by the data, summing the contribution of each observation (accounting
for the differences in field of view due to the readout mode or to the
excision
of the central target) is of 5.5 square degrees (34 different pointing
directions) per camera.
The closed data amount to 430 ksec per camera.
The 2-8 keV range was selected for the analysis. Lower energies were not used
to
avoid (i) contaminations by the soft galactic component of the CXB (emerging
below 1 keV) and (ii) possible artefacts due to an imperfect subtraction
of the bright internal Al-K and Si-K fluorescence lines in the 1-2 keV range.
Above 8 keV the collected CXB signal is marginal.
The spectral analysis was performed within XSPEC v11.0.
The spectral model was a simple absorbed power law. The interstellar
absorption
was fixed to the exposure-weighted average of the values of the
selected fields.
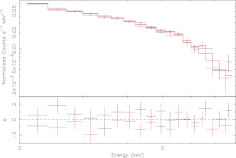
The spectrum of the cosmic X-ray background as seen by the MOS instruments is
shown in Fig. 1.
The two cameras yield fully consistent results within the statistical
uncertainties. A symultaneous fit to the data
(, 72 d.o.f.) yields a photon index of 1.410.04 and
a
normalization of photons cm-2 s-1 sr-1
keV-1
at 3 keV (to be corrected for the stray light, i.e. the contribution to the
collected flux due to photons coming from out-of-field angles). The quoted
uncertainties
are the statistical errors at the 90% confidence level for a single
interesting parameter.
A careful study of the possible sources of errors (see De Luca & Molendi, 2004) led us to compute the overall
uncertainty (systematics included) to be of 4% for the photon index and of
3.5% for the normalization.
After correcting for the stray light (72% of the collected flux, according to Lumb et al. 2002), the MOS results on the 2-8 keV CXB spectrum are:
where the normalization is expressed in photons cm-2 s-1 sr-1 keV-1 at 3 keV.
The resulting flux in the 2-10 keV energy range is of
(2.240.16) erg
cm-2 s-1 deg-2.
The error (90% confidence) includes also an extra 5% uncertainty as an
estimate
of the absolute flux calibration accuracy of the MOS cameras.
To ease a comparison with previous works, the
corresponding normalization at 1 keV is of 11.6 photons cm-2
s-1
sr-1 keV-1.
5 Discussion

We have plotted in Figure 2 our measurement of the CXB intensity,
together with previous determinations. Our value is fully compatible with
the results of Vecchi et al. (1999) on BeppoSAX LECS/MECS data (total
solid angle square degrees) and with the independent
analysis of XMM-Newton EPIC/MOS data by Lumb et al. (2002) (
square degrees).
The ASCA/GIS measure of Kushino et al. (2002) is marginally consistent
with ours. Such study was performed over a rather large solid
angle ( square degrees)
but the absolute flux determination accuracy was
limited to 10% by the large stray light component
(% of the collected flux) affecting ASCA data.
Very recently, Revnivtsev et al. (2003) published a new measurement
of the CXB spectrum performed with the PCA instrument onboard RXTE,
reporting an intensity consistent with the results of Kushino et al. (2002).
They used data from nearly all the sky ( square
degrees); the instrumental background spectrum was extracted from only
25 ksec of dark Earth observation.
The original HEAO-1 measurement (Marshall et al., 1980) is significantly
lower than ours. Such measurement is very robust as for solid angle
coverage ( square degrees); however, all of the subsequent
determinations yielded invariably higher values of the CXB intensity,
casting some doubts on the absolute flux calibration of the HEAO-1
instruments.
In our analysis, we used a compilation of sky fields covering a solid angle
of square degrees, reducing the cosmic variance below the overall
quoted uncertainty. Our measurement, performed with the well-calibrated
EPIC/MOS instrument, relies on a very careful study and subtraction of the
NXB, as well as on a detailed analysis of all the possible sources of errors.
In conclusion, we believe that our measure, fully consistent with two
of the most recent CXB determinations, set a very strong constrain on the
CXB intensity in the 2-8 keV range, significantly higher than the former result from
HEAO-1 data, assumed more than 20 years ago as a reference.
We can now compare our value of the CXB intansity with the source number
counts derived from recent X-ray surveys, both deep/pencil-beam and
medium-deep/wide-angle (Moretti et al., 2003).
Our measurement of the CXB intensity,
FCXB=(2.240.10) erg cm-2 s-1 deg-1
( error, including the absolute flux uncertainty),
implies that 80% of the cosmic X-ray background has been
resolved into discrete sources in the 2-10 keV band. The resolved fraction
rises only to 84% when extrapolating the LogN/LogS down to fluxes of erg cm-2 s-1, a factor of 10
below the sensitivity limits of the deepest X-ray surveys.
Such a result suggests the existence of a new class of X-ray sources
(possibly heavily absorbed AGNs, or star-forming galaxies, see Moretti
et al. 2003 and references therein) emerging at fluxes fainter than
erg cm-2 s-1 and accounting for the
remaining part of unresolved CXB.
References
- Baldi et al. (2002) Baldi, A., Molendi, S., Comastri, A., et al. 2002, ApJ, 564, 190
- Barcons et al. (2000) Barcons, X., Mateos, S. & Ceballos, M.T. 2000, MNRAS, 316, L13
- Brandt et al. (2001) Brandt, W.N., Alexander, D.M., Hornschemeier, A.E., et al. 2001, AJ, 122, 2810
- (4) De Luca, A. & Molendi, S. 2004, A&A in press, astro-ph/0311538
- Gendreau et al. (1995) Gendreau, K., Mushotzky, R., Fabian, A.C. et al. 1995, PASJ, 47, L5
- Giacconi et al. (1962) Giacconi, R., Gursky, H., Paolini, F.R. & Rossi, B.B. 1962, Phys.Rev.Lett., 9, 439
- Hasinger et al. (2001) Hasinger, G., Altieri, B., Arnaud, M., et al. 2001, A&A, 365, L45
- Kushino et al. (2002) Kushino, A., Ishisaki, Y., Morita, U., et al. 2002, PASJ, 54, 327
- Lumb et al. (2002) Lumb, D.H., Warwick, R.S., Page, M., & De Luca, A., 2002, A&A, 389, 93
- Marshall et al. (1980) Marshall, F.E., Bolt, E.A., Holt, S.S., et al. 1980, ApJ, 235, 4
- McCammon et al. (1983) McCammon, D., Burrows, D.N., Sanders, W.T. & Kraushaar, W.L. 1983, ApJ, 269, 107
- Miyaji et al. (1998) Miyaji, T., Ishisaki, Y., Ogasaka, Y., et al. 1998, A&A, 334, L13
- Moretti et al. (2003) Moretti, A., Campana, S., Lazzati, D. & Tagliaferri, G. 2003, ApJ 588, 696
- Revnivtsev et al. (2003) Revnvitsev, M., Gilfanov, M., Sunyaev, R., Jahoda, K., Markwardt, C., 2003, A&A 411, 329
- Turner et al. (2001) Turner, M.J.L, Abbey, A., Arnaud, M., et al. 2001, A&A, 365, L27
- Ueda et al. (1999) Ueda, Y., et al. 1999, ApJ, 518, 656
- Vecchi et al. (1999) Vecchi, A., Molendi, S., Guainazzi, M., Fiore, F. & Parmar, A.N. 1999, A&A, 349, L73