731
G.F. Bignami
22institutetext: Università degli Studi di Pavia, Dipartimento di Fisica Nucleare e Teorica, Via Bassi 6, 27100 Pavia, Italy
33institutetext: INAF/IASF “G. Occhialini”, Via Bassini 15, 20133 Milano, Italy
44institutetext: Università di Milano Bicocca, Dipartimento di Fisica, P.za della Scienza 3, 20126 Milano, Italy
55institutetext: ESO, Karl Schwarzschild Strasse 2, D-85740, Garching, Germany
1E1207.4-5209 - a Unique Object
Abstract
The discovery of deep spectral features in the X-ray spectrum of 1E1207.4-5209 focussed the attention of the astronomical community on this radio-quiet NS, making it the most intensively observed INS ever. The harvest of X-ray photons, collected mainly by XMM-Newton, unveiled a number of unique characteristics, raising questions on this source very nature.
keywords:
Pulsars: individual (1E 1207.4-5209) – Stars: neutron – X-ray: stars1 Introduction
Neutron star atmosphere models predicted the presence of
absorption features depending on atmospheric composition, but high
quality spectra, collected both by Chandra and by XMM-Newton, did
not yield evidence for any such feature (see Pavlov et al. 2002a
and Becker and Aschenbach 2002 for recent reviews).
INS spectra are well fitted
by one or more black-body curves with, possibly, a power law
contribution at higher energies, but with no absorption or
emission features.
The spectrum of 1E1207.4-5209, on the
contrary, appeared from the start as dominated by two broad absorption features seen, at
0.7 and 1.4 keV, both by Chandra (Sanwal et al, 2002) and
XMM-Newton (Mereghetti et al, 2002). To better understand the
nature of such features, XMM-Newton devoted two orbits
to 1E1207.4-5209, for a total observing time of 257,303 sec. In the two
MOS EPIC cameras the source yielded 74,600 and 76,700 photons in
the energy range 0.2 - 3.5 keV, while the pn camera recorded
208,000 photons, time-tagged to allow for timing studies. Analysis
of this long observation, while confirming the two
phase-dependent absorption lines at 0.7 and 1.4 keV, unveiled a
statistically significant third line at 2.1 keV, as well
as a possible fourth feature at 2.8 keV. The nearly perfect 1:2:3:4
ratio of the line centroids, as well as the phase variation,
naturally following the pulsar B-field rotation, strongly suggest
that such lines are due to cyclotron resonance scattering
(Bignami et al. 2003). A year after the XMM-Newton observation, 1E 1207.4–5209 was deeply scrutinized by Chandra for 300 ksec, thus logging an
overall effective exposure slightly larger than that devoted
to the most popular NSs so far, such as Crab, Vela and RX J1856.5-3754.
The release of a new, and improved, instrument calibration software prompted us to revisit the XMM-Newton data set. Here we shall briefly report on some highlights of our new spectral and temporal analysis (see De Luca et al. 2004 for details). In addition, the “best” X-ray positional information is used, in conjunction with a new optical observation, to investigate the source optical behaviour.
2 Timing Analysis
After converting the arrival times of the 208,000 pn photons to the Solar System Barycenter, we searched the period range from 424.12 to 424.14 ms using both a folding algorithm with 8 phase bins and the Rayleigh test. The best period value and its uncertainty (P = 424.130760.00002 ms) were determined following the procedure outlined in Mereghetti et al. (2002). Comparing the new period measurement of 1E 1207.4–5209 with that obtained with Chandra in January 2000 (Pavlov et al. 2002b), we obtain a period derivative =(1.40.3)10-14 s s-1. However, Fig. 1 (left panel) shows that the value rests totally on the first Chandra period measurement. Using only the 3 most recent values, the period derivative is unconstrained. Thus, we cannot exclude that the observed spin-down, based on only a few sparse measurements, be affected by glitches or Doppler shifts induced by orbital motion. Questioning the object’s would have far reaching consequences for the understanding of 1E1207.4-5209 since the serious discrepancy between the pulsar characteritic age ( yrs) and the SNR age ( kyrs) is entirely based on the value inferred from the measurements summarized in Fig. 1 (left panel).


To study the energy dependence of the pulse profile, we divided the data in four channels with approximately 52,000 counts each: 0.2-0.52 keV, 0.52-0.82 keV, 0.82-1.14 keV and 1.14-3.5 keV. The pulse profiles in the different energy ranges (Fig. 1, right panel) show a broad, nearly sinusoidal shape, with a pulsed fraction varying from 3 to 11 % in the four energy intervals. It is worth noting that the minimum pulsed fraction is found in the 0.20-0.52 keV energy range, the only portion of the spectrum free from absorption lines. Indeed, Fig. 1 (right panel) is an independent confirmation of the findings of Bignami et al (2003) who ascribed the source pulsation to the absorption lines phase variation.
Finally, comparing the shapes of the light curves of Fig. 1 (right panel), we see for the first time a phase shift of nearly 90∘ between the profile in the lowest energy range (0.52 keV) and those at higher energies.
3 Spectral analysis

The improved understanding of the instruments (concerning, e.g., its Quantum Efficiency, its Charge Transfer Inefficiency, and its redistribution function) implemented in the most recent SAS release used here (SAS v5.4.1) yields rather significant differences in the low energy (E0.6 keV) part of the spectrum with respect to our previous analysis (Bignami et al. 2003). This allowed for an update of the best fitting parameters for both the continuum and the lines. The reader is referred to De Luca et al. (2004) for a complete discussion of the spectral analysis of the three EPIC cameras. Here we shall focus on the pn data set, which contributes more than half of the source statistics. The best fitting continuum model comes from the sum of two blackbody functions. The cooler one has a temperature kT= keV and an emitting radius R= km, while the hotter one has kT= and R= km. Four absorption features are clearly seen in the spectrum of 1E 1207.4–5209 (see Fig 2) at the harmonically spaced energies of 0.7 keV, 1.4 keV, 2.1 keV and 2.8 keV. The different spectral continuum model, resulting from the improved calibrations, yields also a more significant detection of the third and fourth features with respect to our previous analysis. Using a simple gaussian in absorption, we estimated with an F-test that the 2.1 keV and the 2.8 keV features have a chance occurrence probability of 10-9 and , respectively.
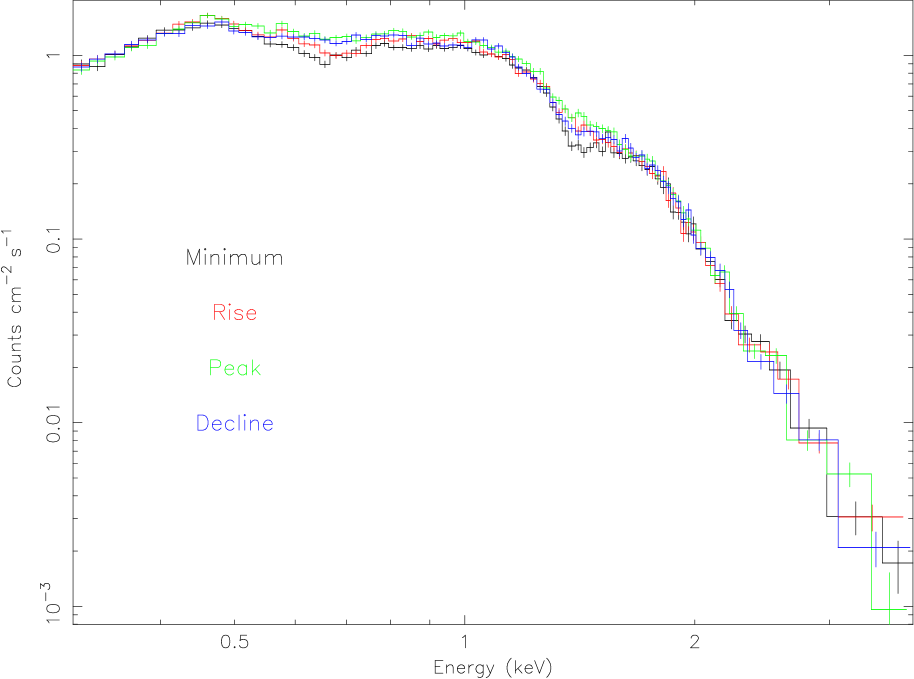
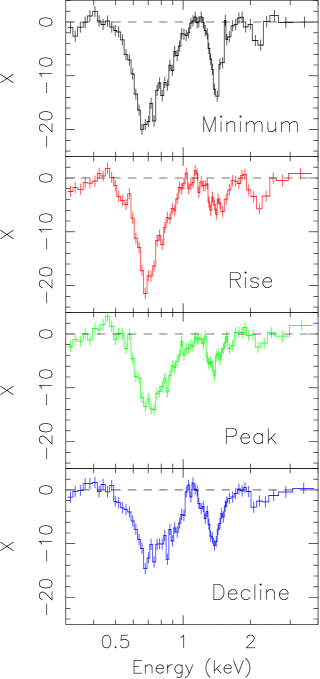
As a further step, we have studied the variations of the spectrum of 1E 1207.4–5209 as a function of the pulse phase. Following Bignami et al. (2003), we selected the phase intervals corresponding to the peak (phase interval 0.40-0.65 with respect to Fig. 1, right panel), the declining part (phase 0.65-0.90), the minimum (phase 0.90-1.15) and the rising part (phase 0.15-0.40) of the folded light curve. The resulting spectra (see Fig. 3) were fitted allowing both the thermal continuum and the lines to vary. The main results can be summarized as follows:
-
•
The two components of the continuum vary slightly both in temperature and in flux with the pulse phase, accounting at most for 3-5% of the source pulsation. An inspection of Fig. 3 clearly shows that the phase variation of the features is largely responsible for the observed pulsation of the source.
-
•
the features are strongly dependent on the pulse phase and show significant variations in width, depth and shape The central energy of the 0.7 keV feature varies by 6% at most, while displacements of the other features are not significant. The 2.8 keV feature is only marginally detected during the minimum and the rise intervals.
-
•
The relative intensity of the first three features varies with the phase.
4 Optimizing the X-ray position
To derive the sky coordinates of 1E 1207.4-5209, we computed independently for the MOS1 and MOS2 cameras the boresight correction to be applied to the default EPIC astrometry. We used the Guide Star Catalog II (GSC-II111http://www-gsss.stsci.edu/gsc/gsc2/GSC2home.htm) to select, amongst our 200 serendipitous detections, 6 sources with a stellar counterpart to be used to correct the EPIC astrometry. The rms error between the refined X-ray and GSC-II positions is 1 arcsec per coordinate. The resulting MOS1 position of 1E 1207.4–5209 is , with an overall error radius of 1.5 arcsec. The MOS2 position is , , also with an uncertainty of 1.5 arcsec, fully consistent with the MOS1 coordinates.
In order to obtain an independent measurement on the position of 1E 1207.4-5209, we have retrieved from the Chandra Data Archive a public dataset relative to a recent (June 2003) ACIS observation (20 ksec in imaging mode) of the target. As in the case of the EPIC data, we used the positions of the serendipitous sources in the field to refine the astrometry (see De Luca et al. 2004 for details). The best Chandra/ACIS position of 1E 1207.4–5209 is , with an uncertainty of 0.6′′. The more accurate Chandra position lies inside the intersection of the MOS1 and MOS2 error circles, confirming the correctness of the analysis and the absence of systematics.
5 Search for the optical counterpart
The field of 1E 12075209 was observed with the 8.2-meter UT-1
Telescope (Antu) of the ESO VLT (Paranal Observatory).
Observations were performed with the the FOcal Reducer and
Spectrograph 1 (FORS1) instrument. Images were acquired
through the Bessel and filters for a total
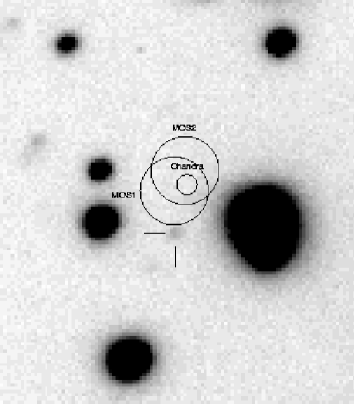
integration time of 2 and 3 hrs, respectively. Fig. 4
shows the inner portion of the combined FORS1
-band image centered on the target position, with the ACIS, MOS1 and
MOS2 error circles superimposed. A faint object (marked with
the two ticks in Fig. 4) is detected just outside the southern
edge of the MOS1 error circle. It showed variability during the
time span covered by our observations. Also, its position falls more
than 2 arcsec away from the most probable region. For both reasons, we can rule it out as a
potential counterpart of 1E 1207.4–5209 .
No
candidate counterpart is detected within the Chandra error circle
(nor in the intersection of the MOS ones)
down to R27.1 and V27.3, which we assume as
upper limits on the optical flux of 1E 12075209.
For an X-ray derived interstellar absorption of at b and a
distance of 2 kpc, our VLT u.l. rules out any hypothetical “normal” stellar
companion (M15 both in R and in V). If we assume
that 1E 1207-5209 is indeed isolated, we can derive a neutron
star optical luminosity erg s-1 or of its rotational energy loss, a value similar to those of
middle-aged INSs. Since the VLT flux upper limits are higher than the extrapolation of the XMM-Newton blackbody (De Luca et
al. 2004), they do not constrain our object’s optical spectrum.
6 Conclusions
1E 1207.4–5209 is a radio-quiet NS at the center of a well known SNR. However, the longer we observe such an object, the harder it becomes to make it fit into a known class of the NS family. The long observations devoted to 1E 1207.4–5209 both by Chandra and by XMM-Newton have unveiled a number of unique and somewhat contradictory characteristics that, at the moment, defy standard theoretical interpretations.
The first and outmost problem seems to be the interpretation of the period evolution. The usual, simplistic, monotonic fit yields a =(1.40.3)10-14 s s-1 that, combined with the period value, makes 1E 1207.4–5209 much too old ( 50 times) for its SNR. Moreover, the value of the star’s magnetic field inferred on the basis of the classical dipole braking formula (B=2.60.3 G) is significantly different from the value obtained from the cyclotron absorption lines interpreted both in terms of electrons (B G) as well as protons (B G).
More creative interpretations of the period evolution (e.g. De Luca et al. 2004, Zavlin et al. 2004) require scenarios such as bynary system or peculiar glitching. However, such types of behaviour are already tightly constrained by the lack of an optical counterpart.
Are the unique characteristics of 1E 1207.4–5209 pointing towards a new class of NSs?
References
- Bignami et al. (2003) Bignami, G.F., Caraveo, P.A., De Luca, A., Mereghetti, S. 2003 Nature, 423, 72
- Becker & Aschenbach (2002) Becker W. and Aschenbach, B. 2002, in Neutron Stars, Pulsars, and Supernova Remnants, W. Becker et al. eds., p.64
- De Luca et al. (2004) De Luca, A., Mereghetti, S., Caraveo, P.A., Moroni, M., Mignani, R.P., Bignami, G.F. 2004, A&A, in press
- Mereghetti et al. (2002) Mereghetti, S., De Luca, A., Caraveo, P.A., Becker, W., Mignani, R., Bignami, G.F. 2002, ApJ, 581, 1280
- Pavlov et al. (2002a) Pavlov, G.G., Zavlin, V.E., Sanwal, D. 2002a, in Neutron Stars, Pulsars, and Supernova Remnants, W. Becker et al. eds., p.273
- Pavlov et al. (2002b) Pavlov G.G., Zavlin, V.E., Sanwal, D., Truemper, J. 2002b, ApJL, 569, L95
- Sanwal et al. (2002) Sanwal D., Pavlov G.G., Zavlin V.E & Teter M.A. 2002, ApJL, 574, L61
- Zavlin et al. (2004) Zavlin V.E, Pavlov G.G., Sanwal D. 2004, submitted to ApJ, astro-ph/0312096