2003 \SetConfTitleCompact Binaries in the Galaxy and Beyond
A New View of the Supersoft X-Ray Source Cal 87 Observed with XMM-Newton
Abstract
Cal 87 was observed with with XMM-Newton in April of 2003. The source shows a rich emission spectrum, where lines can be identified if they are red-shifted by 700-1200 km s-1. These lines seem to have been emitted in a wind from the system. The eclipse is observed to be shifted in phase by 0.03 , where is the phase of the optical light curve.
Stars: binaries, white dwarfs \addkeywordX-rays: stars
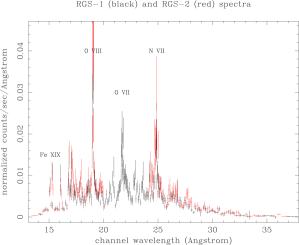
0.1 The observed X-ray spectrum
Cal 87 was observed with XMM Newton on April 18-19 2003, for 21.8 hours (two full orbital cycles). The background corrected count rate measured in the two RGS-1 and RGS-2 instruments in the 0.33-2.5 Å range is 0.07640.0012 and 0.06530.0011 cts s-1, respectively. The spectrum clearly appears to be an emission line one. There is an obvious similarity with the X-ray grating spectra of this source, (Motch et al. 2002, Bearda et al. 2002), however Cal 87 displays a much softer spectrum. Tentative line identification for the emission features in the RGS spectra indicates a red shift of several identifiable lines with velocities in the 700-1200 km s-1 range. We conclude that these lines must be originated in a wind. The EPIC spectra, despite pile-up effects that cannot be completely corrected for, offer a broader energy range (0.2-10 keV), and allow us to conclude that the central white dwarf is not visible at any time, even outside of eclipse.
0.2 The light curve
The eclipse already observed in X-rays is observed again with XMM-Newton. It is more definite and deeper in the EPIC in the RGS light curve, not only because of the better S/N, but also because the depth of the eclipse is greater at lower energy. It is shifted by =0.03 with respect to the eclipse observed at optical wavelengths. We speculate that this may be so because the X-rays are emitted by the Accretion Disk Corona, while the optical radiation originates instead from the disk.
References
- (1) Bearda, H., et al. 2002, A&A, 385, 511
- (2) Motch, C., Bearda H., and Neiner C. 2002, 385, 91