L1521E: the first starless core with no molecular depletion
L1521E seems unique among starless cores. It stands out in a distribution of a ratio that we define to asses core evolution, and which compares the emission of the easily-depleted C18O molecule with that of the hard to deplete, late-time species N2H+. While all cores we have studied so far have ratio lower than 1, L1521E has an value of 3.4, which is 8 times the mean of the other cores. To understand this difference, we have modeled the C18O and N2H+ abundance profiles in L1521E using a density distribution derived from 1.2mm continuum data. Our model shows that the C18O emission in this core is consistent with constant abundance, and this makes L1521E the first core with no C18O depletion. Our model also derives an unusually low N2H+ abundance. These two chemical peculiarities suggest that L1521E has contracted to its present density very recently, and it is therefore an extremely young starless core. Comparing our derived abundances with a chemical model, we estimate a tentative age of yr, which is too short for ambipolar diffusion models.
Key Words.:
ISM: abundances – ISM: clouds –ISM: molecules – stars: formation – ISM: individual(L1521E)1 Introduction
Observations of starless dense cores over the last few years have shown that molecular depletion onto cold dust grains is a common feature in low-mass star-forming regions (e.g., Caselli et al. 1999; Tafalla et al. 2002). As a core contracts, the amount of depletion of certain molecules like CS and CO increases with time (e.g., Bergin & Langer 1997; Aikawa et al. 2003), so we can expect that depletion will provide an accurate clock for core evolution when its details are well understood. Even before this is a reality, depletion can be used as a qualitative time marker, in the sense that evolved cores should be more depleted of certain species than younger cores. When we attempt to build a sequence of cores having different amounts of depletion, however, we find that the population of undepleted (or lightly) depleted cores is missing. These undepleted cores should represent the earliest stages of core contraction, and probably they have not been identified so far because of an observational bias. Given the interest of young cores for studies of core contraction, finding a member of this population is an urgent challenge.
To identify cores with low degree of depletion, we have started a systematic study of cores with weak NH3 lines in the survey of Benson & Myers (1989), as previous observations of cores bright in NH3 have only found cases of strong depletion (e.g., Caselli et al. 1999; Tafalla et al. 2002). Among our targets, the L1521E core in Taurus has revealed itself as a core with negligible depletion, and here we report a preliminary analysis of its properties. This core has already been identified as a very young core by Hirota et al. (2002), who found it very prominent in carbon-chain molecules, comparable to TMC-1 (see also Aikawa et al. 2003). In this paper we show that L1521E has the lowest measured level of C18O depletion, and in a forthcoming article we will present the results of an ongoing chemical survey of this core.
2 Observations
We observed L1521E in C18O(1–0) and N2H+(1–0) with the FCRAO 14m telescope during 2002 March. The observations were done with the SEQUOIA array in on-the-fly position switching mode. The facility correlator provided a velocity resolution of about 0.07 km s-1, and all data were converted into the main beam brightness scale assuming an efficiency of 0.55. The telescope beam size was approximately .
We observed L1521E with the IRAM 30m telescope in 2003 September (lines) and October (continuum). The line observations consisted of maps in N2H+(1–0) and C18O(2–1), and crosses in C17O(1–0), C17O(2–1), and C34S(2–1). All data were taken in frequency switching mode with a velocity resolution of 0.03 km s-1, and were converted into main beam brightness units using standard efficiencies. The 1.2mm continuum observations were done with MAMBO-2 in on the fly mode. Sky dips were used to measure the atmospheric extinction, and observations of planets were used for calibration. The resolution of the 30m telescope varies from for N2H+(1–0) to for C18O(2–1) and the 1.2mm continuum.
3 The ratio and the uniqueness of L1521E
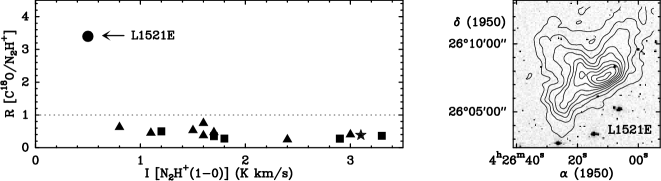
To search for cores at the earliest stages of contraction, it is convenient to define a simple observable that measures depletion without the need of a complicated radiative transfer calculation. One possibility is to compare the emission of two molecules known to have different depletion behaviors at typical core densities, and for this we choose C18O and N2H+. C18O is a heavy depleter at densities of a few cm-3, while N2H+ seems to remain in the gas phase up to densities of about cm-3 (e.g., Caselli et al. 1999; Tafalla et al. 2002). Thus, if we define C18O/N2H ( hereafter) as the ratio between the integrated intensities of C18O and N2H+ at the center of a core, we expect to be a sensitive indicator of depletion. In particular, we expect to be low in cores with strong C18O depletion and high in cores with little C18O depletion.
Our definition of has the additional advantage that it compares two molecules with different gas-phase formation time scales: C18O forms relatively quickly in the core history while N2H+ is a late-time molecule (e.g., Aikawa et al. 2003). Thus, if chemical youth is correlated with lack of depletion, the ratio should be further enhanced in young cores because of their relatively lower N2H+ abundances. A signature of youth and lack of depletion, therefore, is the combination of a large and a relatively low N2H+ intensity.
To calibrate the ratio, we test its behavior in a sample of cores selected for their strong N2H+ or NH3 emission, and therefore likely to be evolved. This sample includes the 5 cores studied in Tafalla et al. (2002), a set of 8 additional cores from an unpublished survey, and a core with an embedded YSO, B335. All these cores have been mapped in C18O and N2H+ with the FCRAO telescope, and their ratio has been estimated at the position of maximum N2H+ emission. In addition and as a reference, we have estimated the ratio for the 5 Monte Carlo core models with constant C18O abundance in Tafalla et al. (2002), finding an average value of 1.0.
As Figure 1 illustrates, all cores in our sample lie below the line despite their factor of 4 spread in N2H+(1–0) integrated intensity. The sample has a mean value of 0.43 with an rms of 0.14, and its location under the line is suggestive of strong C18O depletion (a conclusion supported by detailed radiative transfer modeling of some objects). This systematic behavior suggests that can be taken as a reasonable boundary between cores with and without C18O depletion, and that a search for undepleted cores should look for objects above the line. Thus, over the last few years we have carried out a search for high- cores using the FCRAO telescope, mapping core candidates both in N2H+(1–0) and C18O(1–0). Although the search is still ongoing and several candidates seem promising, one object stands out because it combines the highest value and the lowest N2H+ intensity. This core, L1521E, shown in Fig. 1 as the outlying point labeled with its name, has , which is 8 times larger than the mean or 20 times the rms. These characteristics make L1521E the best candidate we know of to an undepleted core, and as we will in the following section, a detailed analysis of its molecular composition confirms this interpretation.
4 The internal structure of L1521E
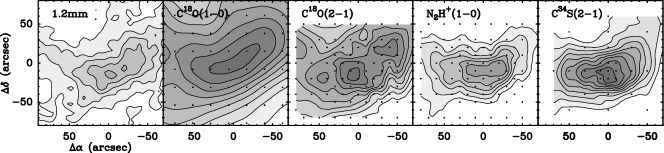
The high ratio of L1521E can arise from a high central C18O abundance, a low N2H+ fraction, a combination of both, or some excitation effect (after all, the two molecules have very different dipole moments). To discern between these options, we now solve the radiative transfer of the two species and determine their abundance profiles. For this, we rely on observations of the 1.2mm continuum, C18O(1–0), C18O(2–1), C17O(1–0), C17O(2–1), and N2H+(1–0), shown in part in Figure 2.
4.1 Physical parameters
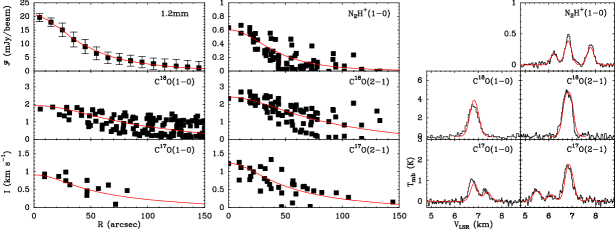
We first derive the density profile of L1521E from its distribution of the 1.2mm continuum emission. This emission is optically thin and appears unaffected by chemical differentiation or excitation effects, so it can be easily inverted into a density distribution (e.g., André et al. 1996). As Fig. 2 shows, the 1.2mm emission (like that of the molecules) is elongated NW-SE, and therefore deviates from spherical symmetry. Thus, to derive a density distribution that can be used by our spherically-symmetric Monte Carlo radiative transfer analysis (see below), we first average elliptically the observed emission, assuming an aspect ratio of 2:1 and a position angle of . Then, we find an analytic density profile that after simulating an on-the-fly observation predicts the correct radial profile of 1.2mm continuum emission (see Tafalla et al. 2002 for details). For consistency with previous work, we assume a dust emissivity cm2 g-1 and a dust temperature of 10 K (see below). In this way, we derive a density distribution of the form where cm-3, cm ( at 140 pc), and . Fig. 3 shows that this profile provides a reasonable fit to the observed 1.2mm continuum emission.
The NH3 emission from L1521E is extremely weak (Benson & Myers 1989; Hirota et al. 2002), so we rely on C17O to determine the gas kinetic temperature. C17O seems undepleted at the core center (see below), and fits to its hyperfine structure indicate that the emission is optically thin. Thus, we can convert the observed central 2–1/1–0 intensity ratio () into an excitation temperature ( K) which we approximate as 10 K. The 2–1/1–0 line ratio seems constant with radius, so the excitation temperature must also be close to constant. Given the low dipole moment of C17O (0.1 D), this excitation temperature should be a good approximation to the gas kinetic temperature, and we will assume in our modeling a constant gas temperature of 10 K.
Finally, we characterize the velocity field of L1521E using hyperfine fits to its N2H+(1–0) emission. These fits indicate an intrinsic N2H+ linewidth of 0.3 km s-1, which means a nonthermal component of about 0.27 km s-1 (FWHM). When modeling the C18O(1–0) lines, a slightly larger linewidth is needed in the outer core, and we have parametrized this behavior as a linear increase in the non thermal component up to 0.58 km s-1 at cm (the core outer radius in our model).
4.2 Molecular abundance profiles
We solve the radiative transfer for N2H+ and the CO isotopomers to derive their radial profiles of abundance. For this, we use a Monte Carlo code (Bernes 1979; Tafalla et al. 2002, 2004) and fit simultaneously both the radial profiles of integrated intensity and the emergent spectra of all transitions (the radial profiles have been derived with the same elliptical average as used for the continuum). Given the previous parameterization of the L1521E core, the only free parameters to fit the data are the abundances of each species.
To determine the N2H+ abundance we use the 1–0 transition. This transition has 7 hyperfine components, and our model treats each component as a separate line, taking explicitly into account the hyperfine splitting of the first 3 rotational levels (see Tafalla et al. 2004 for further details). We have run this model assuming constant N2H+ abundance, and as Figure 3 shows, the predicted emission for a value of fits simultaneously the radial profile of integrated intensity and the central emerging spectrum. A constant N2H+ abundance is also found in other cores, but the value we derive for L1521E is about 8 times lower than that derived for the L1498 and L1517B cores using the same code (Tafalla et al. 2004). This difference is highly significant and makes L1521E the starless core with the lowest N2H+ abundance (note that the N2H+ abundances estimated by Tafalla et al. 2002 are artificially low because of their simplified treatment of the hyperfine structure). The low N2H+ abundance explains the location of L1521E in the far left of Fig. 1.
To determine the abundance of the CO isotopomers, we now fit the radial profiles and emergent spectra of C18O(1–0), C18O(2–1), C17O(1–0), and C17O(2–1). We first fix the C18O/C17O abundance ratio to its ISM value (3.65, Penzias 1981), so we are left with one abundance profile as free parameter. In contrast with what is found in other cores, the L1521E data can be fit with a model of constant CO abundance. This is illustrated in Fig. 3 and makes L1521E the first core with no sign of CO depletion. Our best-fit abundance is X(C18O) = 0.7 , very similar to that found in the outer parts of L1498 and L1517B, although about 2.5 times lower than the standard determination by Frerking et al. (1982). This lower value may indicate a slight error in the dust parameters or that the Frerking et al. (1982) abundances need revision. In any case, it is the combination of high CO and low N2H+ abundances what causes the hight ratio of L1521E.
Although an analysis of the CS emission in L1521E is out of the scope of this paper, we note that preliminary models indicate that this species also has constant abundance all the way to the core center (already suggested by the C34S(2–1) emission in Fig. 2). CO and CS, therefore, seem not depleted in L1521E.
5 An extremely young core
The absence of CO (and CS) depletion in L1521E seems not to result from molecules finding it harder to freeze out in this core. Its central density is typical, as well as is its gas temperature of 10 K (the dust temperature cannot be much higher given the observed central density). The very low abundance of the late-time molecule N2H+ further suggests that the lack of depletion in L1521E results from this core being less chemically processed than others, as it has also been argued by Hirota et al. (2002) and Aikawa et al. (2003). L1521E, in fact, combines the lowest C18O depletion and lowest N2H+ abundance, so it appears to be the less processed and therefore youngest core known.
To estimate how young L1521E is, we compare our observations with the predictions from the recent model of Aikawa et al. (2003), who have studied the evolution of a core undergoing Larson-Penston contraction taking into account both gas-phase and grain-surface chemical reactions. Although the exact form of contraction is unclear, this model seems preferable because it covers the chemical evolution of the gas since time prior to molecular depletion when it has an initial density of cm-3. Thus, we have taken the model abundance profiles at the earliest time calculated by the authors ( yr, their Fig. 2a) and predicted intensities for the conditions of L1521E. In addition of having to multiply the predicted abundances by to approximately fit the data, we find that for C18O the slight central drop predicted by the chemical model is barely consistent with the data, and that the predicted central increase of N2H+ abundance is already too pronounced (the central density at this early time is close to our estimate). This indicates that the model predicts more chemically processing at time yr than observed, even for the relatively fast Larson-Penston flow. With the caveat that the time estimate depends sensitively on the assumed sticking probabilities, we conclude that the comparison implies a contraction age of yr.
Our contraction age for L1521E seems consistent with the estimate by Lee & Myers (1999) that the typical lifetime of starless cores is 0.3-1.6 Myr, as this core is younger than others. This age, however, seems incompatible with models of core formation via ambipolar diffusion, as they require evolutionary times of the order of 1 Myr in the most favorable conditions (e.g., Ciolek & Basu 2001). Thus, if L1521E has significantly contracted on a time scale as short as suggested by chemical models, a more dynamical picture seems needed. The collision of supersonic flows, as proposed by the supersonic turbulence scenario (e.g., Mac Low & Klessen 2003), however, seems also inconsistent with the observations, given that the turbulent component of the linewidth ( km s-1) is still subsonic, and that the velocity differences across the L1521E core are only of the order of the sound speed (a description of the core velocity structure will presented in a future paper). Clearly further analysis of L1521E is needed to understand its apparent rapid formation and lack of molecular depletion. At this point, it is suggestive to speculate that L1521E belongs to an up to now overlooked population of extremely young cores.
Acknowledgements.
We thank the staffs of FCRAO and IRAM for help during the observations and Yuri Aikawa for advice on chemical models. MT acknowledges support from grant AYA2000-0927 of the Spanish DGES. The DSS was produced at the Space Telescope Science Institute under US Government grant NAG W-2166.References
- Aikawa et al. (2003) Aikawa, Y., Ohashi, N., & Herbst, E. 2003, ApJ, 593, 906
- André et al. (1996) André, P., Ward-Thompson, D., & Motte, F. 1996, A&A, 314, 625
- Bergin & Langer (1997) Bergin, E.A., & Langer, W.D. 1997, ApJ, 486, 316
- Bernes (1979) Bernes, C. 1979, A&A, 73, 67
- Benson & Myers (1989) Benson, P.J., & Myers, P.C. 1989, ApJS, 71, 89
- Caselli et al. (1999) Caselli, P., Walmsley, C.M., Tafalla, M., Dore, L., Myers, P.C. 1999, ApJ, 523, L165
- Ciolek & Basu (2001) Ciolek, G.E. & Basu, S. 2001, ApJ, 547, 272
- Frerking et al. (1982) Frerking, M. A., Langer, W. D., & Wilson, R. W. 1982, ApJ, 262, 590
- Hirota et al. (2002) Hirota, T., Ito, T., & Yamamoto, S. 2002, ApJ, 565, 359
- Lee & Myers (1999) Lee, C.W. & Myers, P.C. 1999, ApJS, 123, 233
- Mac Low & Klessen (2003) Mac Low, M.-M. & Klessen, R.S. 2003, Rev. Mod. Phys., in press (astro-ph/0301093)
- Penzias (1981) Penzias, A.A. 1981, ApJ, 249, 518
- Tafalla et al. (2002) Tafalla, M., Myers, P.C., Caselli, P., Walmsley, C.M., & Comito, C. 2002, ApJ, 569, 815
- Tafalla et al. (2004) Tafalla, M., Myers, P.C., Caselli, P., & Walmsley, C.M. 2004, A&A, in press