Abstract
We present a stroboscopic system developed for optical observations of pulsars and its application in the CLYPOS survey. The stroboscopic device is connected to a GPS clock and provides absolute timing to the stroboscopic shutter relative to the pulsar’s radio ephemerides. By changing the phase we can examine the pulsar’s light curve. The precisely timed stroboscope in front of the CCD camera can perform highly accurate time resolved pulsar photometry and offers the advantages of CCD cameras, which are high quantum efficiency as well as relatively large field of view, which is important for flux calibrations.
CLYPOS (Cananea Ljubljana Young Pulsar Optical Survey) is an extensive search for optical counterparts of about 30 northern hemisphere radio pulsars. It is a collaboration between the INAOE, Mexico and the Faculty of Mathematics and Physics of the University of Ljubljana. Stroboscopic observations were done between December 1998 and November 2000 at the 2.12 m telescope of the Observatory Guillermo Haro in Cananea, Sonora. The first results of the survey are presented. Analyzed data indicate that there is no optical counterpart brighter than .
1 Introduction
Today more than 1000 radio pulsars are known. The interest for detection of their optical counterparts has increased in the last decade, mainly due to bigger and better telescopes and due to improved detectors with high temporal resolution (Fordham et al. 2000, Dhillon et al. 2001, Moon et al. 2001, Straubmeier et al. 2001). Despite all efforts the number of detected optical counterparts has enlarged only to nine (Mignani et al. 2000, Mignani et al. 2002). Almost all of them are weak optical sources, with a magnitude of . Moreover, until now there has been no systematic search for optical counterparts of young radio pulsars. The Clypos survey, a mexican-slovene collaboration project, was an attempt to systematically search for optical counterparts of radio pulsars. The goal of this survey was to detect new optical pulsars or at least to determine magnitude limits for their detection and thus set stronger observational constraints on theoretical high-energy emission models for pulsars.
2 Stroboscopic observations
Periodic optical signals from pulsars can be detected only with a device that has sufficient temporal resolution on subsecond or even millisecond time scale. Pulsar photometry is usually performed with high-speed photometers (Chakrabarty et al. 1998, Golden et al. 2000). Recently the use of frame transfer technique has also increased the temporal resolution of CCD cameras (Kern et al. 2002, Fordham et al. 2003). We introduced the use of a precisely timed stroboscope in front of a normal CCD camera (Čadež et al. 1996). The stroboscopic technique is based on a shutter that opens with the prescribed frequency and phase and thus controls when the light beam from a telescope passes to a CCD detector. The advantages of this method are that it makes full use of the high quantum efficiency and the detailed field of the CCD camera, which enables good flux calibrations.
Our stroboscopic system (Kotar et al. 2002) is schematically shown in Figure 1. The stroboscopic shutter is a rotating blade with out-cuts whose width determines a duty cycle of the stroboscope, that is the fraction of the period during which a CCD camera is illuminated. While observing, the rotating frequency of the blade is synchronized with the pulsar’s frequency, calculated from published radio ephemerides (Taylor et al. 1993). The GPS clock timing can also be used to synchronize the phase of the blade with the absolute radio phase of the pulsar, if it is known in advance.

In our survey the duty cycle of the stroboscope was set to % and to % in only a few observation runs. This decision was made under the assumption that optical pulsar light curves are similar to the one of the Crab. The exact window function of the stroboscope depends on the width of the blade out-cut and the position of the blade with respect to the focal plane of the telescope. The window function together with the Crab pulsar pulse shape obtained by Fordham et al. (2003) is schematically shown in Figure 2a. The result of the fit of our data to data of Fordham et al. is shown in Figure 2b.


Knowing the stroboscopic window function we can calculate (at least for the Crab pulsar) the magnitude of the pulsar as a function of the stroboscopic phase. The result is shown in Figure 3, where the magnitude scale is gauged to the average magnitude of the pulsar. The maximum magnitude enhancement of 1.8 magnitude is reached, when the stroboscope window is completely centered on the emission peak. One should note that broader main emission peak results in a smaller magnitude enhancement.


3 Clypos survey
27 young isolated radio pulsars that were observable from Cananea (its geographic latitude is ) were included in the Clypos survey. We present the preliminary results for 12 of them. We were looking for the brightest possible candidates, so our choosing criteria was the pulsar’s rotation power . Assuming that the optical efficiency of pulsars is the same as that of the Crab, we obtained the expected magnitudes of optical counterparts as:
where we used the , , and values for the Crab (16.5, 33.4 ms, , 2.2 pc). The results for the sample of 12 pulsars are shown in Table I.
: Characteristics for 12 radio pulsars monitored in Clypos survey. The rotation power, is presented in units of the Crab pulsar. We calculated the expected magnitude assuming that chosen pulsars are Crab like.
| Name | V | |||||||
|---|---|---|---|---|---|---|---|---|
| PSR J 0056+4756 | 13. | 311 | -0. | 101 | 3. | 00 | 28. | 8 |
| PSR J 0108-1431 | 7. | 780 | -0. | 001 | 0. | 01 | 29. | 6 |
| PSR J 0117+5914 | 61. | 941 | -3. | 570 | 495. | 88 | 24. | 9 |
| PSR J 0157+6212 | 2. | 672 | -0. | 215 | 1. | 29 | 30. | 7 |
| PSR J 0454+5543 | 18. | 440 | -0. | 128 | 5. | 30 | 27. | 7 |
| PSR J 0538+2817 | 43. | 890 | -1. | 124 | 110. | 60 | 26. | 1 |
| PSR J 0614+2229 | 18. | 760 | -3. | 340 | 140. | 52 | 28. | 0 |
| PSR J 0631+1036 | 21. | 836 | -7. | 939 | 388. | 80 | 27. | 6 |
| PSR J 1705-1906 | 21. | 015 | -0. | 291 | 13. | 71 | 27. | 5 |
| PSR J 1825-0935 | 8. | 171 | -0. | 556 | 10. | 20 | 27. | 5 |
| PSR J 1833-0827 | 73. | 675 | -7. | 922 | 1308. | 91 | 26. | 0 |
| PSR J 1908+0734 | 29. | 588 | -0. | 115 | 7. | 63 | 30. | 4 |
Observations were carried out at the 2.12 m telescope of the Observatory Guillermo Haro in Cananea during several observation runs between December 1998 and November 2000. The field of view of the EEV P8603 CCD detector, using the LFOSC focal reducer (), was arcmin, with the size of one pixel arcsec. No filters were used to maximize the light input. The observing strategy was as follows. The exposure time for each image was 5 min, effectively 30 sec due to the 10% stroboscopic duty cycle. For each pulsar 24 consecutive images 1/8 in phase apart were taken. The whole phase cycle was thus scanned 3 times. In this way we spent hours per pulsar, some pulsars were observed during several observation runs. A detected pulsar would show up as a periodic signal at the radio position of the pulsar. The brightest magnitude at the most favorable phase would be enhanced by at most magnitudes with respect to the average magnitude. Since the absolute radio phase of observed pulsars was not known the starting stroboscope phase was chosen randomly.
3.1 Limiting magnitude
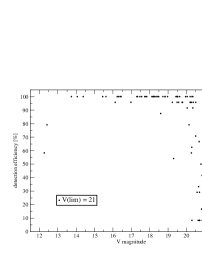
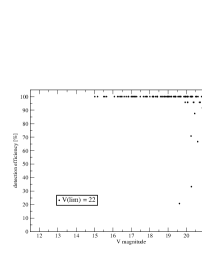
It is important to set the limiting magnitude for pulsar detection. It depends on many factors. The average sky brightness in Cananea is 20.5 and the average FWHM of the star PSF is around 3 arcsec. The quantum efficiency of the CCD camera at the wavelength of 700 nm is 45%. The effective exposure time per image was 30 s and 3 images were taken with each phase. For each pulsar field we took one V filter image in order to calibrate the brightness of stars in the image. The magnitudes were calibrated against the gsc2 catalog and also using photometric standards from Landolt (1992). The limiting magnitude was determined statistically as follows. We checked how often any star on 24 images was detected. Two examples of such detection efficiency are shown in Figure 4. The efficiency is very close to 100% for bright stars and it suddenly drops for stars with magnitudes higher than a certain value which we interpret as magnitude limit. The limiting magnitude varies for different observation runs between and , due to changing sky conditions that mainly affect the width of the PSF.
We can conclude that a Crab like pulsar with an average magnitude of 22-24 would in the best possible scenario appear 1.8 magnitude brighter on every image and so could be detected.
3.2 Periodicity test
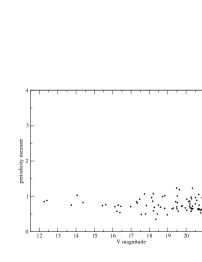
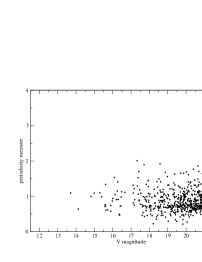
As already mentioned, we observed in such a way that a pulsar was expected to appear on every image in the set of 24. To look for such a periodic signal we construct a set of 8 phase bins and compute the average magnitude and its sigma for each bin. We divide into two classes, those with higher and the ones with lower magnitude than average. For each class we calculate average magnitude values () and their sigmas (). We define the periodicity measure as:
Figure 5 presents the periodicity measure versus magnitude for stars from two pulsar fields. Its values are scattered around the average value of , scattering is stronger for higher magnitudes. Each star with the periodicity measure much over the average value is a possible candidate for the pulsar optical counterpart only if its position agrees with the error box of the radio pulsar position. On the sample of 12 pulsars no periodic signal that would be a signature of a pulsar optical counterpart was detected.
4 Conclusion
With the analysis described above no optical counterpart with an average magnitude of 22-24 on the sample of 12 radio pulsars was detected. Optical counterparts already discovered are very faint. The limiting magnitude that we reached with the Clypos survey is most probably not high enough for any new detection. However, the stroboscopic method is a useful observational technique since it enables not only detection but also periodicity identification of optical counterparts. Once the absolute phase of the pulsar is known one can synchronize the stroboscope and thus fully use the reduction of the sky brightness contribution resulting from magnitude enhancement. For example, with the VLT using active optics and in stroboscopic mode we would expect that 0.01 photometry of a 25 average magnitude pulsar would be allowed in 10 minutes.
Acknowledgements
We thank Dick Manchester and David Nice for help with the TEMPO program and the technical staff of the Guillermo Haro Observatory for professional support and friendly atmosphere. This program was supported in part by the Ministry of Education, Science and Sport of the Republic of Slovenia and in part by CONACyT grant 25539E.
References
- 1 Chakrabarty D., Kaspi V. M.: 1998, Astrophys. J. 498, 37.
- 2 Čadež A., Galičič M.: 1996, Astron. Astrophys. 306, 443.
- 3 Dhillon V., Marsh T.: 2001, New Astron. Rev. 45, 91.
- 4 Fordham et al.: 2000, Mon. Not. R. Astr. Soc. 319, 414.
- 5 Fordham et al.: 2003, Astrophys. J., in press.
- 6 Golden A., Shearer A., Beskin G. M.: 2000, Astrophys. J. 535, 373.
- 7 Kern B., Martin C.: 2002, Nature 417, 527.
- 8 Kotar J., Vidrih S., Čadež A.: 2002, Rev. Sci. Instr., submitted.
- 9 Landolt A. U.: 1992, Astron. J. 104, 340.
- 10 Mignani R., Caraveo P. A., Bignami G. F.: 2000, The Messenger 99, 22.
- 11 Mignani R. et al.: 2002, Astrophys. J. Lett. 580, L147.
- 12 Moon D., Pirger B. E., Eikenberry S. S.: 2001, Publ. Astr. Soc. Pacific 113, 646.
- 13 Observatory Guillermo Haro: http://www.inaoep.mx/ astrofi/cananea/
- 14 Straubmeier C., Kanbach G., Schrey F.: 2001, Exp. Astron. 11, 157
- 15 Taylor J. H., Manchester R. N., Lyne A. G.: 1993, Astrophys. J. Suppl. 88, 529.
- 16 TEMPO: http://pulsar.princeton.edu/tempo/index.html
- 17