Intrinsic Absorption in the Spectrum of Mrk 279: Simultaneous Chandra, FUSE and STIS Observations
Abstract
We present a study of the intrinsic X-ray and far-ultraviolet absorption in the Seyfert 1.5 galaxy Markarian 279 using simultaneous observations from the Chandra X-ray Observatory, the Space Telescope Imaging Spectrograph aboard the Hubble Space Telescope, and the Far Ultraviolet Spectroscopic Explorer (FUSE). We also present FUSE observations made at three additional epochs. We detect the Fe K emission line in the Chandra spectrum, and its flux is consistent with the low X-ray continuum flux level of Mrk 279 at the time of the observation. Because of low signal-to-noise ratios (S/N) in the Chandra spectrum, no O vii or O viii absorption features are observable in the Chandra data, but the UV spectra reveal strong and complex absorption from H i and high-ionization species such as O vi, N v, and C iv, as well as from low-ionization species such as C iii, N iii, C ii, and N ii in some velocity components. The far-UV spectral coverage of the FUSE data provides information on high-order Lyman series absorption, which we use to calculate the optical depths and line and continuum covering fractions in the intrinsic H i absorbing gas in a self-consistent fashion. The UV continuum flux of Mrk 279 decreases by a factor of 7.5 over the time spanning these observations and we discuss the implications of the response of the absorption features to this change. From arguments based on the velocities, profile shapes, covering fractions and variability of the UV absorption, we conclude that some of the absorption components, particularly those showing prominent low-ionization lines, are likely associated with the host galaxy of Mrk 279, and possibly with its interaction with a close companion galaxy, while the remainder arises in a nuclear outflow.
1 Introduction
Approximately one-half of all low-redshift active galactic nuclei (AGNs) show absorption edges due to highly ionized gas, “warm absorbers”, in their X-ray spectra (Reynolds 1997; George et al. 1998). Among these objects, there is a one-to-one correspondence with those that show high-ionization UV absorption lines in their spectra Crenshaw et al. (1999). This correlation indicates that the two phenomena are closely related, but the exact relationship remains unclear.
This problem has been addressed by the use of high-resolution spectroscopy in the UV and/or X-ray, which has provided a variety of detailed information on the physical state of the intrinsic gas in several AGNs: Mrk 509 (Kriss et al. 2000a; Kraemer et al. 2003; Yaqoob et al. 2003); NGC 3516 (Kraemer et al. 2002); NGC 3783 (Kraemer, Crenshaw, & Gabel 2001; Kaspi et al. 2001; Blustin et al. 2002; Gabel et al. 2003a,b); NGC 4151 (Crenshaw et al. 2000; Kraemer et al. 2001); NGC 5548 (Mathur et al. 1999; Crenshaw & Kraemer 1999; Brotherton et al. 2002; Kaastra et al. 2002; Steenbrugge et al. 2003); and NGC 7469 (Kriss et al. 2000b; Kriss et al. 2003; Blustin et al. 2003). In general, it is difficult to associate a particular UV absorption component with the X-ray absorber unambiguously, in part because the ionization modeling is sensitive to the shape of the UV-to-X-ray continuum (Kaspi et al. 2001), and observations to date have not always been performed simultaneously in the UV and X-ray.
The intrinsic absorption lines are typically blueshifted with respect to the systemic redshift of the AGN, indicating radial outflow. The UV absorption is often highly variable, due either to changes in the ionization state of the absorbing gas in response to changes in the continuum flux of the AGN (Krolik & Kriss 1995; Shields & Hamann 1997; Crenshaw et al. 2000; Kraemer et al. 2002) or to bulk motion of the gas in the direction transverse to the line of sight (Crenshaw & Kraemer 1999; Kraemer et al. 2001). These properties, along with measurements of partial coverage of the continuum and broad emission line region (BELR) for some absorbers, indicate that this gas is indeed intrinsic to the AGN.
Measurements of the covering fractions of the absorbers are important for an accurate determination of the column density of the gas, for building a picture of the geometry of the absorbing structures, and for testing physical models. Covering fractions less than 1 indicate partial covering of the continuum source or BELR (Barlow & Sargent 1997; Hamann et al. 1997) by the absorbing gas. It is generally not possible to measure covering fractions for the continuum and BELR separately along with absorption optical depths, though doublets and saturated regions in Lyman series lines have been used as tools for disentangling these quantities (Hamann et al. 1997; Ganguly et al. 1999; Gabel et al. 2003a). Additionally, covering fractions vary along the absorption profiles and these velocity-dependent covering fractions play a key role in determining the profile shapes (Arav, Korista, & de Kool 2002), though some caution that finite instrumental resolution limits the ability to determine these quantities accurately in the profile wings (Ganguly et al. 1999).
In models of intrinsic absorption in AGNs, the gas responsible for the UV and X-ray absorption arises either in a wind emanating from the accretion disk (Königl & Kartje 1994; Murray et al. 1995), or in a wind driven off the obscuring torus (Krolik & Kriss 1995, 2001). In each of these scenarios, the absorbing material lies in different orientations with respect to the BELR and at different distances from the AGN central engine. Observations of variability in the intrinsic absorption in response to changes in the AGN continuum flux provide information on the distance of the absorbers from the continuum-emitting region, allowing one to distinguish between these two models.
Mrk 279 (, see § 4.3) has been studied at wavelengths ranging from the X-ray to the radio and is among the brightest Seyfert galaxies in the UV and X-rays. As part of an X-ray and far-UV monitoring campaign of several low-redshift AGNs, we have obtained spectra of Mrk 279 using the High Energy Transmission Grating Spectrometer on the Chandra X-ray satellite, the Space Telescope Imaging Spectrograph (STIS) onboard the Hubble Space Telescope, and the Far Ultraviolet Spectroscopic Explorer (FUSE). We observed Mrk 279 at four epochs over a period of 2.4 yr with FUSE, simultaneously with STIS and with Chandra for the most recent of the FUSE observations. The Chandra data cover spectral regions that may be expected to show absorption features due to highly ionized silicon, magnesium, neon, iron, oxygen, and nitrogen. In particular, the absorption lines and edges from O vii and O viii are useful diagnostics of the ionization state of the absorbing gas, since the FUSE spectra cover the O vi 1032,1038 doublet. The spectral coverage of FUSE also provides information on H i absorption in Ly and higher order Lyman transitions, and C iii 977, and the STIS observations cover Ly and the N v 1238, 1242, Si iv 1393, 1402, and C iv 1548, 1550 doublets. This data set is unique in several respects: the information on high-order Lyman series absorption from the FUSE spectra allows us to calculate optical depths and line and continuum covering fractions in the absorbers; the UV observations made at different epochs permit us to investigate the effects of UV continuum variability on the intrinsic absorption; and the simultaneous UV and X-ray observations we have obtained give us the ability, in principle, to perform photoionization modeling of the warm absorber with a self-consistent UV-to-X-ray spectral energy distribution.
2 Observations
2.1 X-ray: Chandra
We observed Mrk 279 on 2002 May 18-19 with the High Energy Transmission Grating Spectrometer (HETGS) on the Chandra X-Ray Observatory. The HETGS -11-11-11For further details on Chandra instruments, see http://cxc.harvard.edu/proposer/POG. provides high resolving power, up to 1000, from 0.4 keV to 10.0 keV through the use of a Rowland design and two gratings: (1) the Medium Energy Grating (MEG), which intercepts X-rays from the two outer mirror shells of the High Resolution Mirror Assembly (HRMA) and gives good spectral coverage from 0.4 keV to 5.0 keV (2.5-31 Å); and (2) the High Energy Grating (HEG), which intercepts X-rays from the two inner shells of the HRMA and is optimized for the 0.8-10.0 keV (1.2-15 Å) spectral region. We reduced the X-ray spectra using CIAO version 2.3, filtering on energy ( keV), hot columns, and grade(0, 2, 3, 4, 6). We removed streak events from CCD 8 using destreak. We extracted the order spectra from a spatial region wide, centered on the peak of the zeroth-order image. We flux-calibrated the spectra using the aspect histogram and standard grating response matrix functions. See Table 1 for a summary of the Chandra observation details.
Mrk 279 was in a low flux state during the Chandra observation, and the resulting S/N in the individual MEG and HEG spectra is low. Therefore, we combined the MEG and HEG spectra at MEG resolution and rebinned adaptively to fit the continuum model. We fixed the bin width at energy so that , but we restricted the width to be no larger than 5% wide. Many bins with keV and keV have SNR . We show the merged spectrum in Figure 1.
2.2 Ultraviolet: FUSE and STIS
FUSE (Moos et al. 2000; Sahnow et al. 2000) consists of four primary mirrors feeding four Rowland circle spectrographs and two, two-dimensional, photon-counting microchannel plate detectors. Two of the mirror/spectrograph pairs employ optics coated with Al+LiF for efficient spectral coverage from 990 to 1187 Å, while two use optics coated with SiC for coverage down to 905 Å. The data were recorded in photon-address mode, which delivers a time-tagged list of event positions in the downlinked data stream.
We observed Mrk 279 at four different epochs with FUSE through the low-resolution aperture. See Table 1 for the details of the observations. Because the two 2002 January observations were made within several hours of each other, we combined the two spectra. As a result of mirror alignment problems during the 2002 May observation, we are only able to analyze data from the LiF1 channel. We used the standard FUSE calibration pipelines (see Sahnow et al. 2000), to extract the spectra, to subtract dark current, and to perform wavelength and flux calibrations. We used CALFUSE version 2.0.5 for the 1999 and 2000 data, and we used CALFUSE version 2.1.6 for the 2002 data. However, Mrk 279 was in a low state during the 2002 observations, resulting in a low signal-to-noise ratio (S/N) in the 2002 January spectra in particular, because their exposure times were relatively short. Therefore, because improved background subtraction algorithms were implemented in later versions of CALFUSE, we re-reduced the 2002 January data using CALFUSE version 2.2.3. We combined the spectra from each detector and binned by 3-8 pixels, improving the S/N while preserving the full spectral resolution, 20 km s-1.
To correct the wavelength scale of the FUSE spectra for zero-point offsets due to placement of the target in the aperture, we measure the positions of low-ionization Galactic absorption lines from species such as Ar i, Fe ii, O i, and and compare these with the Galactic 21 cm H i spectrum along the line of sight to Mrk 279 (Wakker et al. 2001). The H i emission has a complex profile with multiple peaks. The brightness-temperature-weighted mean heliocentric velocity is km s-1. Correcting the spectra from the individual observation epochs to this value required shifts of 0.05 to 0.10 Å. We estimate that the residual systematic errors in the FUSE wavelength scale are on the order of 10 km s-1, and that the flux scale is accurate to 10%.
We also obtained a spectrum of Mrk 279 with the STIS FUV-MAMA contemporaneously with the 2002 May 18 FUSE observation in a five-orbit exposure through the aperture using the medium-resolution E140M echelle grating covering 1150-1730 Å. See Table 1 for other details of the STIS observation. We used CALSTIS version 2.12a to process the spectra. This version automatically corrects for echelle scattered light using the Lindler & Bowers (2000) two-dimensional algorithm as implemented in the CALSTIS pipeline. Several ISM absorption features from our own Galaxy (Si iii 1206, Si ii 1260, C ii 1334) are saturated in the line troughs, with residual fluxes consistent with zero to within 1.5% of the adjacent continuum levels. This indicates a reasonable scattered light correction given that the one-dimensional algorithm used previously had been found to result in residual saturated-line core fluxes of up to 10% of the adjacent continuum levels (Lindler & Bowers 2000; Crenshaw et al. 2000). We extracted the individual echelle orders from each exposure and summed them using a set of IRAF scripts to produce the merged spectrum. As described above, we measure the positions of lines from low-ionization species, S ii, Si ii, O i, C ii, and Fe ii in the STIS spectrum, and we compare these with the mean heliocentric velocity of the H i 21 cm emission. We find that no correction to the wavelength scale derived by the CALSTIS pipeline is necessary. We obtained the STIS spectrum and the 2002 May FUSE spectrum simultaneously with the Chandra data described in Section 2.1.
We fit the FUSE and STIS spectra with power-law continua and Gaussian emission lines. The full spectra are shown in Figures 3 and 3. The emission features we identify in the FUSE spectra include C iii 977, N iii 989, Ly, O vi 1032,1038, S iv1063,1073, and He ii 1085. In the STIS spectrum, we identify emission lines from Ly, N v 1238, 1242, Si iv 1393, 1402, C iv 1548, 1550, and others. We discuss the continuum and emission line fits to the spectra in more detail in Section 4.1 below.
We find intrinsic absorption in these UV spectra extending from 580 to +160 km s-1. Figure 5 shows a close-up view of the Ly and O vi absorption profiles in each FUSE spectrum, and Figure 5 shows close-up views of the Ly, N v, and C iv absorption profiles in the STIS spectrum. In Ly, we find five distinct components of absorption, named 1-5 from the strongest and reddest component blueward. We also identify two subcomponents of Component 2, which we label 2a and 2b, and one subcomponent of Component 4, which we label 4a. These components and subcomponents are discerned most clearly in the Ly and C iii 977 profiles in the 1999 December spectrum, which are shown with these components labeled in the first panel of Figure 6 and the second panel of Figure 7, respectively. A slight excess in the flux is visible in the 2002 January and May FUSE spectra at 1069-1070 Å, in the bottom two panels of Figure 5. The lack of a corresponding feature at 1063.5 rules out a component of narrow O vi emission, so perhaps this is due to a complex of N i airglow lines in this region appearing more prominently in the low flux state spectra. In any case, the unabsorbed continuum is fitted well otherwise, so we contend that this has no significant impact on our results. The intrinsic UV absorption is discussed further in Section 4.3.
3 Analysis of the Chandra Spectrum
3.1 Continuum Fit and Spectral Features
During the Chandra observation, the 2-10 keV flux was ergs cm-2 s-1. This is a low flux state for Mrk 279, as the flux in this band varies between and (Weaver, Gelbord & Yaqoob 2001). Previous low flux levels occurred in 1979 (HEAO-1) and 1991 (BBXRT). Dividing the Chandra dispersed MEG and HEG data into 1000 s bins, we find a 10-15% decrease in the count rate starting 75 ks into the observation and lasting 20 ks.
The best-fit continuum model consists of two power laws modified by absorption due to a Galactic hydrogen column of cm-2 (Dickey & Lockman 1990), giving = 306/327. The two power laws have photon indices and and normalizations and photons cm-2 s-1 keV-1 at 1 keV in the emitted frame. We included additional multiplicative model components to account for calibration effects. We use: (1) an ad hoc correction for ACIS pileup effects, which also reduces the effect of the Ir-M edge (Marshall et al. 2004a); (2) a correction to bring the front-side-illuminated chip quantum efficiencies into agreement with the back-side-illuminated chip quantum efficiencies (Marshall et al. 2004a); and (3) an ACIS contamination correction (Marshall et al. 2004b).
The most significant emission feature we identify in the combined MEG and HEG spectrum is the Fe K emission line redshifted to 1.99 Å, which we discuss in further detail below in Section 3.2. We do not detect O viii Ly absorption at 18.98 Å rest, or the strongest O vii line at 21.60 Å. We use the flux error array and the continuum fit discussed above to derive 3 equivalent width limits at the expected locations of these features, 0.06 and 0.14 Å, respectively. Assuming absorption on the linear part of the curve of growth, we derive upper limits on the column densities of O vii and O viii, which are both 5 cm-2. However, the column density of either of these species could be substantially larger if either line is below the equivalent width threshold and saturated, which is the case for the 3 limits quoted above if the X-ray absorbers have Doppler parameters typical of intrinsic UV absorbers, 100-200 km s-1. (See Fig. 2 of Gabel et al. 2003a.) For km s-1, and unity covering fraction, the equivalent width limits for O vii and O viii imply (O vii) cm-2 and (O viii) cm-2.
3.2 Fe K Line
The most significant line that appears in the X-ray spectrum is the fluorescent Fe K emission line at a rest-frame energy of keV ( Å). This feature is marked in Figure 1. The best Gaussian fit to the Fe K line in the HEG spectrum has an intrinsic velocity width of km s-1 FWHM, and the width of the instrumental line spread function at the position of the line is 1500 km s-1. The corresponding line flux and equivalent width are photons s-1 cm-2 and eV, respectively.
Spectra of Mrk 279 from the Advanced Satellite for Cosmology and Astrophysics (ASCA) revealed variability of the Fe i K profile on 10 ks timescales as the 2-10 keV continuum flux increased by 20% (Weaver et al. 2001). The X-ray continuum source of Mrk 279 was at least twice as bright during the 1995 ASCA observations compared with the 2002 Chandra observation. Because the best-fit line width from the Chandra spectrum is comparable to that obtained with ASCA, we can make direct comparisons. The line flux is approximately one-half the strength it was in the ASCA observation. Since the continuum is also one-half as strong, this indicates that the line flux has scaled with the continuum flux. With ASCA, the peak energy of the line changed from 6.3 keV in the low state to 6.5 keV in the high state. The peak energy of the line observed with Chandra is located at the average of these two energies. At 90% confidence the low-state energy measured by ASCA, keV, is consistent with the energy measured here with Chandra/HETGS. There appears to be a blueward asymmetry to the line profile, but the current data do not warrant detailed modeling with accretion disk line profiles. The S/N in this region is such that we cannot place meaningful constraints on a Compton reflection component.
4 Analysis of the FUSE and STIS Spectra
4.1 Continuum and Emission Lines
We use the IRAF-10-10-10IRAF is distributed by the National Optical Astronomy Observatories, which are operated by the Association of Universities for Research in Astronomy, Inc., under cooperative agreement with the National Science Foundation. task specfit (Kriss 1994) and spectral regions unaffected by absorption features to fit the continuum and emission lines in the FUSE and STIS spectra of Mrk 279. For the continuum, we fit a power law of the form , and for the emission lines, we fit Gaussian profiles. The continuum and emission line fits at each of the four observation epochs are plotted in Figures 3 and 3 and the fit parameters are tabulated in Tables 2 and 3.
We include the Galactic extinction law of Cardelli, Clayton & Mathis (1989) with R and E(B-V)=0.016 (Schlegel, Finkbeiner, & Davis 1998) in the continuum fits. The flux at 1000 Å faded by 21% between the 1999 December and 2000 January observations. The fitted spectral index to the 927-1187 Å range is bluer for the brighter spectrum by a factor of 1.5. By 2002, the continuum flux of Mrk 279 at 1000 Å was 7.5 times fainter than observed in 1999 December.
Since the 2002 May FUSE and STIS spectra were taken simultaneously, we combine them into a single spectrum for the continuum and emission line fits. The fits to the STIS spectrum are shown in Figure 3. The emission features fitted in each FUSE spectrum include broad (FWHM 7000-10,000 km s-1) Ly, O vi 1032,1038, S vi 933,944, C iii 977, N iii 991, S iv 1063, 1073, and He ii 1085. (See, e.g. Zheng et al. 2001, Telfer et al. 2002.) These are labeled in Figure 3. The Ly contributions to the O vi emission complexes were required to achieve a good fit to the profiles, consistent with the results of Laor et al. (1994, 1995). Also included in the fit are Ly and O vi 1032,1038 components of intermediate velocity width (FWHM 1200-2000 km s-1). We include a narrow component of Ly, primarily because the emission line fit to the STIS spectrum described below requires this narrow component in Ly to achieve a reasonable fit. We allow its flux to vary in all fits but keep the centroid and FWHM fixed to values found from the fit to the 2002 May FUSE and STIS spectra, in which the width of the narrow component is restricted to a range that is consistent with widths found for narrow, forbidden [Oiii]5007, 600-700 km s-1 (Heckman et al. 1981; Feldman et al. 1982). We fix the relative intensities of all doublets to the optically thin ratio of 2:1.
In the STIS portion of the spectrum we fit broad emission features due to Si ii 1192, Ly, N v 1238, 1242, Si ii 1260, O i + Si ii 1304, C ii 1335, Si iv 1393, 1402, O iv] 1402, C iv 1549, and He ii 1640. We also include intermediate velocity width (FWHM 2000 km s-1) components of Ly, N v, and C iv, and a narrow (FWHM 700 km s-1) component of Ly in the fit, as discussed above. These features are labeled in Figure 3.
4.2 Interstellar and Intergalactic Absorption Features
The interstellar medium (ISM) in the direction of Mrk 279 is kinematically complex, as this line of sight intersects the high-velocity cloud Complex C (Wakker et al. 2001; Collins, Shull, & Giroux 2002). We find eight components of the ISM absorption in a prominent but unsaturated line such as O i 936 at heliocentric velocities of -145, -109, -85, -57, -30, -9, 5, and 20 km s-1. We fit three different models to the interstellar lines that contaminate the intrinsic absorption features using specfit. The first of these employs the published oscillator strengths of the ISM lines (Morton 1991; Howk et al. 2000). The second model uses average ratios from best fit ISM models to six other FUSE spectra of AGNs that show no intrinsic absorption: Mrk 335, PKS 0558-504, PG 0804+761, 3C 273, Mrk 1383, and Mrk 817. The third ISM model uses empirically determined ratios from the FUSE spectrum of Mrk 279 itself; the relative -values that give the lowest are adopted. This model is illustrated in Figures 6-14. We use the third model for removing the ISM absorption from the Mrk 279 spectra. However, we will evaluate the systematic errors in the removal of ISM contamination by comparing the results using each of these ISM models. Mrk 279 lies at a reasonably large Galactic latitude, , so its spectrum is uncomplicated by strong molecular hydrogen absorption. The ISM features contaminating the intrinsic Lyman series lines are shown in Figures 6, 8, 10, and 12. The ISM features contaminating the intrinsic metal lines are shown in Figures 7, 9, 11, 13, and 14.
The interstellar absorption contaminating the intrinsic absorption features in the STIS spectrum are shown in Figures 12 and 14. Component 1 of intrinsic Ly absorption is blended with interstellar S ii 1254, which is visible in four prominent velocity components just redward of the intrinsic absorption. Also, the N v 1238 absorption from velocity Component 1 is contaminated with interstellar C i 1277. The velocity components of the intrinsic absorption are described in further detail in Section 4.3 below.
Penton et al. (2000) identify six intergalactic Ly lines in their spectrum of Mrk 279 taken with the Goddard High Resolution Spectrograph on board HST. We note that the features they find at 1243.75, 1241.80, and 1241.50 Å coincide with the positions of intrinsic Si iii 1206 for Components 1, 3, and 4, low-ionization absorption systems, which, as we discuss below, may arise in the host galaxy of Mrk 279. Also, while we see no feature in the STIS spectrum that corresponds to the feature they identify at 1236.9 Å, it lies at the expected wavelength of intrinsic N i 1200 for Component 1.
4.3 Intrinsic Absorption Features
Of our four FUSE spectra of Mrk 279, the 1999 December spectrum has the highest S/N. We therefore use this as a basis for comparison with the other three. The intrinsic absorption features in the FUSE and STIS spectra of Mrk 279 extend over 700 km s-1. We identify five distinct components we label Components 1-5, with subcomponents associated with Components 2 and 4. The delineation of individual velocity components of the intrinsic absorption is problematic and somewhat arbitrary, particularly in cases where low-ionization and high-ionization lines show different absorption trough structures. We will therefore attempt to describe the properties of the intrinsic absorption as a continuous function of velocity, using the individual velocity components for reference purposes, and when speaking of the average properties of the absorption in the line cores. The positions of the individual components in Ly, C iii, and O vi 1032 are listed in Table 4, and the Ly centroids are indicated by bold vertical lines in Figures 6-14.
In our discussion of the intrinsic absorption features in the spectrum of Mrk 279, we use the term intrinsic” to refer to absorption arising in gas associated either with an outflow from the AGN itself, or with the interstellar medium in the host galaxy of the AGN. In fact we shall argue that several velocity components of the intrinsic absorption, namely, the low-ionization species in Components 1, 3, 4, and perhaps 5, are likely to arise in the host galaxy, either in gas associated with the disk or halo, in material analogous to the high-velocity clouds (HVCs) observed in the Milky Way, or in gas participating in an interaction with a companion galaxy to Mrk 279, MCG +12-13-024. In these components, we find H i covering fractions consistent with unity, prominent C iii 977 in most FUSE epochs, and Si iii 1206 lines in the STIS spectrum. Component 4 also shows absorption from other low-ionization species such as N iii, C ii, and N ii. In general, the centroids of these features agree with the centroids of the Ly lines, illustrated by the vertical lines in Figures 6-14. Figures 7, 9, 11, 13, and 14 show that the low-ionization absorption line profiles such as those of C iii and C ii differ from the high-ionization profiles such as O vi, or C iv in the STIS data, in velocity centroids and, to a greater extent, in overall profile shapes. In Figure 16, we show comparisons of the C iii 977 and O vi 1032 flux profiles with Ly in the 1999 December FUSE spectrum. The comparison between C iii 977 and Ly in the top panel shows that the profile shapes are in general agreement, although the C iii 977 lines are narrower in velocity extent by 15 km s-1 on average, and the C iii line in Component 4 is blueshifted with respect to Ly by 10 km s-1. There are distinct differences between Ly and O vi 1032, which we compare in the bottom panel of Figure 16. Component 1 shows little O vi 1032 absorption and the component we have labeled Component 5 forms the blue wing of the O vi profile of Component 4/4a. The Ly and O vi profiles of Components 2-4 are dramatically different in their overall shapes. The O vi/H i ratios in Components 2a and 2b are substantially larger relative to the ratio in Component 2. Also, Component 3 is less well-defined in O vi than in Ly, and the profiles of Components 4 and 4a in these two species are highly offset with respect to one another.
Before we continue with the detailed discussion of the intrinsic absorption in Mrk 279, some words about the systemic redshift of this galaxy are in order. The redshifts listed in the NASA Extragalactic Database span nearly 700 km s-1. If we restrict ourselves to recent references, we find in the Third Reference Catalog of Bright Galaxies (RC3, de Vaucouleurs et al. 1991) and in the Updated Zwicky Catalog (UZC, Falco et al. 1999). The RC3 redshift is a weighted mean of various measurements found in the literature, while the redshifts in the UZC are based on a more homogeneous set of spectra taken as part of the CfA Redshift Survey. However, the UZC measurement is the result of a cross correlation with both absorption line templates and narrow emission line templates, the latter of which may bias the final redshift owing to bulk motions of material in relatively close proximity to the central engine of the AGN. Therefore, we choose a redshift that is measured from the UZC spectral data, but based on absorption lines only. For the systemic redshift of Mrk 279, we adopt (Falco 2003, private communication).
We find intrinsic absorption in the 1999 December FUSE spectrum of Mrk 279 extending from -570 to +145 km s-1. In the strongest components, we identify up to 10 Lyman series absorption features, although to avoid confusion with strong Galactic interstellar lines and with overlapping Lyman series lines from adjacent velocity components, the highest order Lyman series line we use in any one component is Ly-8. The velocity component with the largest blueshift with respect to systemic, Component 5, shows little neutral hydrogen absorption. It is seen only in Ly, where it is blended with interstellar Fe ii 1055, and possibly in Ly. This component is visible mainly in C iii, and as a blue wing on the broad O vi profile. Conversely, Component 1 shows strong Lyman series absorption and strong C iii 977, but a weak O vi doublet. We can identify the Lyman series in this component reliably to Ly-8 at a rest wavelength of 923.15 Å.
At some velocities within the -570 to +145 km s-1 range, Ly and the 1032 Å component of O vi are contaminated by Galactic Fe ii absorption, though the 1038 Å component is unaffected by any ISM features. Absorption due to C iii 977 is present over the entire velocity range of the intrinsic absorption; and notable N iii 989 features are visible at and km s-1, in Components 3 and 4. Absorption features due to intrinsic C ii 1036 and N ii 1084 are identified in Component 4 only. If C ii 1036 is present in Component 1, it is blended with the intrinsic O vi 1038 lines of Component 2, 2a, and 2b. We note, however, that we detect no C ii 1334 absorption at the expected position for Component 1 in the 2002 May STIS spectrum. We show the intrinsic metal lines in Figure 7, with the velocity components defined by the Ly lines, listed in Table 4. As discussed above, the centroids of the C iii features agree with the H i centroids, and the broad O vi profile in Components 4 and 4a is offset in velocity with respect to the Ly profiles. The near-equal depths of the two O vi doublet lines in Components 2 and 5 indicate that the absorption is saturated. Therefore, the nonzero flux levels in the centers of these O vi features imply partial coverage of the O vi-absorbing gas.
In the 2000 January FUSE spectrum, we find the intrinsic absorption extends from -570 to +145 km s-1. Once again, Component 1 is visible down to Ly-8 with strong C iii 977 and weak O vi 1032,1038 features; and Component 5 shows relatively weak Ly, blended with Fe ii 1055, with a prominent O vi doublet, and well-defined C iii 977 absorption. As in the 1999 December spectrum, N iii 989, C ii 1036, and N ii 1084 features are seen in Component 4. The velocity components are tabulated in Table 4, and they are plotted in Figures 8 and 9.
In the 2002 January FUSE spectrum, the low signal-to-noise limits the analysis of the H i lines to Ly and Ly. The intrinsic absorption extends from -595 to +145 km s-1. The above description of Components 1 and 5 still holds at this epoch. We see no significant N iii 989 or N ii 1084 lines, but we do identify C ii 1036 in Component 4. The velocity components are tabulated in Table 4, and the intrinsic features are plotted in Figures 10 and 11. We show the expected positions of all the metal lines discussed above in the 1999 December and 2000 January spectra for reference, even if we do not identify a significant absorption feature.
In the 2002 May FUSE spectrum, the intrinsic Ly absorption extends from -530 to +145 km s-1. Since there is no SiC data for Å for this observation, the analysis is limited to Ly and Ly. The STIS spectrum, taken simultaneously with the 2002 May FUSE spectrum, shows absorption due to Ly extending from -610 to +145 km s-1, as listed in Table 4. We identify two velocity components in Ly that are not visible in the higher-order transitions in the FUSE data: at -155 and -600 km s-1. These components are marked by bold vertical lines in Figure 12. The absorption complex at 1253.4-1253.8 Å is attributed to S ii 1254, indicating the presence of the S ii 1250 line at the position of the -605 km s-1component of the intrinsic Ly. We take this feature into account in our Galactic ISM model and find that the -605 km s-1 feature cannot be accounted for by Milky Way ISM absorption alone.
We show the intrinsic metal lines in Figure 13, with the velocity components defined by the Ly lines, as before. At this epoch, Component 1 still shows strong H i absorption and a weak O vi doublet. Component 5 is also still relatively weak in Ly, but it is reasonably prominent in Ly. This component is coincident in velocity with the bluest edge of the broad O vi absorption profile. We identify no significant N iii 989 features in this spectrum, but Component 4 does show C ii 1036 absorption at this epoch. A possible component of C ii 1036 is seen at -420 km s-1, though this is likely to be due to Ar i 1067 in the ISM, as in the spectra taken at other epochs (see Figures 7 and 9).
The intrinsic metal absorption identified in the STIS spectrum is shown in Figure 14. We find Si iii 1206 in Components 1, 3, and 4, and Si ii 1260 and C ii 1334 in Component 4 only. We identify the N v 1238,1242 and C iv 1558,1550 doublets in all velocity components with the exception of Component 1. In Component 1, the 1548 C iv line is blended with the 1550 line of Component 3, but the absence of the 1550 feature at the velocity of Component 1, combined with the lack of N v 1238,1242 and weak O vi 1032,1038, indicate that there is no significant C iv absorption at this velocity. We find no detectable Si iv features in the STIS spectrum.
4.4 Covering Fractions, Optical Depths and Column Densities
4.4.1 Lyman series
The availability of many lines in the Lyman series of hydrogen allows a direct solution for the line and continuum covering fractions of the absorbing medium and its optical depth. The normalized flux at a position in the absorption profile, , is a function of the optical depth and the covering fraction, including both line and continuum components:
| (1) |
where is the relative flux in the line or continuum and is the covering fraction in the line or continuum, and where in general it is assumed that (Ganguly et al. 1999.)
We determine the best-fit continuum and emission line covering fraction and the optical depth using information from the entire Lyman series. At each velocity position, , we construct the function of merit by summing over the Lyman series components, , in the FUSE and STIS data:
| (2) |
where and are the measured normalized flux and error in Lyman series component at position , and the model is defined by Equation 1, where
| (3) |
The function is minimized using a nonlinear least squares technique to solve for , , and (or ) at each velocity. We use the method described by Savage & Sembach (1991) to compute column density profiles from the optical depth profiles:
| (4) |
In Components 1, 2, 3, and 4 of the 1999 December FUSE spectrum, we use the Lyman series lines Ly, , , Ly-5, and Ly-6 and Equations 1-3 to derive , , and at each resolution element in the intrinsic absorption profile. In Figure 16, we show the Ly absorption profile in the top panel, with the power law continuum and the full continuum plus emission line fit with the ISM absorption model. In the middle and bottom panels on this figure, we show the corresponding profiles in line and continuum covering fractions and Ly optical depth from our solution. The error bars on , , and , shown in the histogram in Figure 16, are 1 confidence limits from . For the fit to Component 1, we add Ly-7 and Ly-8 to the Lyman series lines listed above; and for Component 4, we fit the series down to Ly-7. Component 4a suffers from blending with interstellar features: Ly is blended with Fe ii 1055, Ly with C iii 977, and Ly with N i 965. This blending is even more severe for Component 5, to the extent that it is plausible to attribute the putative Ly component entirely to Fe ii 1055. We note, however, that this component is seen clearly in C iii 977 (Figure 7) and it does appear convincingly in Ly in the 2002 May STIS spectrum (Figure 12). Because of the particularly severe blending of the Ly line of Components 4a and 5 with interstellar O i 976 and C iii 977, we fit Ly through Ly-7, excluding Ly for these components.
The average covering fraction and column density in the core of each velocity component are listed in Table 5. The velocity over which the column density is calculated, , is listed in the final column of the table. We determined for each component so that (1) the is equal for each species for each component; (2) no pixels are summed twice for two different adjacent velocity components of a single species; and (3) the optical depths are summed over the core of each absorption feature, generally avoiding the wings of the lines, particularly for features with large velocity widths.
We use the same Lyman series lines and the procedure outlined above for solving for the covering fractions, optical depths, and H i column densities of the absorbers in the 2000 January FUSE spectrum. For the 2002 May data, the absence of data from the FUSE SiC channels means that we have no coverage of intrinsic lines blueward of Ly. However, the STIS spectrum at this epoch provides coverage of intrinsic Ly which we use for the covering fraction and optical depth solutions. The results of these calculations for the 2000 January and the 2002 May spectra are also listed in Table 5. In some resolution elements, where the absorption is saturated for instance, the optical depth is poorly constrained on the high end and the function has no well-defined minimum. In these cases, we quote a lower limit on the column density summed only from velocity bins with derived optical depths lower than the maximum value that we can reliably measure. We estimate this maximum from the S/N in the spectrum at the location of the absorption component with the lowest optical depth used in the solution. For the H i solutions that extend far down the Lyman series, the maximum Ly optical depth can be as large as 70.
The quantities and are highly correlated, giving rise to large uncertainties in the solutions. With the exception of two velocity bins in the blue wing of Component 4 at 470 km s-1, visible in Figure 16, we find that the line and continuum covering fractions do not differ significantly from one another. Hence, we find no significant difference in the column densities derived if we instead assume and solve for an effective covering fraction, , and optical depth at each point using the minimization described above. This procedure is necessary for the 2002 January FUSE spectrum, because the S/N in the spectrum restricts our analysis to the Ly and Ly lines only. The Ly, , and profiles for each epoch are shown in Figures 18, 18, 20, and 20. In Figure 20, we show the Ly profile from the 2002 May STIS spectrum in addition to Ly. In comparing Figure 18 with Figure 16, we see that the assumption of an effective covering fraction provides better constraints on the covering fraction than the attempt to solve for the line and continuum covering fractions separately. Because this assumption also provides better constraints on the column density solutions, we use the values of (H i) from this procedure in the discussion below. These results are tabulated in Table 6. The histograms of and in Figures18-20 demonstrate that the shapes of the absorption profiles are dictated to a large degree by the velocity-dependent covering fraction (Arav et al. 2002). Note that the trend of decreasing H i covering fraction in the wings of Component 1 in particular is likely due to the convolution of the flux profile with the instrumental line spread function of the FUSE spectrograph.
We plot the H i covering fractions and summed column densities tabulated in Table 6 in Figures 22 and 22. In Figure 22, we show average values of the effective covering fractions within the listed in Table 6 of the velocity centroids of each component, and in Figure 22, we plot the H i column density in each component, summed over . The intrinsic absorption in the first two epochs of observations is similar in terms of both covering fractions and H i column densities. These quantities are largest in Components 1 and 4, where is consistent with unity and, in the 1999/2000 epochs, (H i) cm-2 in Component 1 and (H i) cm-2 in Component 4. The velocity of Component 1, +90 km s-1, is consistent with the systemic redshift of Mrk 279. This fact, the large H i column density, the unity covering fraction, and the weak O vi absorption all indicate that this absorption is due to the ISM of Mrk 279. For all components, the H i column densities in the first two epochs are consistent with one another within the uncertainties.
The H i column densities in Components 2, 2a, and 2b do not vary significantly from the 1999/2000 epochs to the 2002 observations. By contrast, there is a slight drop in (H i) in Components 3 and 5 and (H i) in Components 4 and 4a drops dramatically over this time period. In particular, (H i) in Component 4 drops by a factor of 10 from 2000 January to 2002 May. We will discuss the variability of the absorption components in Section 4.5.2. Like Component 1, Component 4 also shows a unity covering fraction, a high column density of H i, and absorption due to a number of low-ionization species. This suggests that at least some of the gas that contributes to this component does not arise in the AGN outflow. We will discuss this component further in Section 5.
4.4.2 Doublets
For doublets, we define an effective covering fraction, (Ganguly et al. 1999; Gabel et al. 2003a) as outlined in the discussion of the Lyman series above, and require , where and denote the blue and red components of the doublet, respectively. Though applying Equation 1 to each doublet component allows for a direct solution of the two unknowns, and (Hamann et al. (1997)), we choose instead to use the minimization technique described above by Equation 2 so that we are able to restrict the values of and to physically meaningful ranges. In most cases, however, this method gives solutions indistinguishable from the direct solution of Equation 1.
We use the optical depths from this method and Equation 4 to derive the column densities of O vi at all epochs, as well as N v and C iv in the 2002 May STIS data. For Component 1, for which we found no obvious N v lines, we place an upper limit of cm-2 on the N v column density. To do this, we assume that the covering fraction of the N v in this component is equal to the O vi covering fraction. The N v and O vi covering fractions are consistent with one another in the other components, where they are determined independently. For Component 1, the 1548 Å member of the C iv doublet is blended with the 1550 Å line of Component 3. We set an upper limit of cm-2 for the C iv column density in Component 1 using the 1550 Å line and the O vi covering fraction. The C iv and O vi covering fractions are consistent with one another in the other components, with the exception of Component 5, where the C iv covering fraction is 3.5 larger than the O vi covering fraction. For Component 3, we use the 1548 Å line and the O vi covering fraction to derive (C iv) cm-2. We find no detectable Si iv features in the STIS spectrum, so we do not attempt to solve directly for Si iv column densities using the doublet method. Instead, we use the O vi covering fractions to set 3 upper limits on the Si iv column density in each component. The results of these calculations are listed in Table 7.
4.4.3 Other Metals
For metals that do not give rise to doublets, we do not have enough information to solve for the covering fraction and column density self-consistently. In principle, where metal features are coincident in velocity with hydrogen lines, we could assume that the metal absorption in question arises in the same location as the H i and use the covering fractions derived from the hydrogen lines to solve for optical depths in the cores of these metal lines. However, because we cannot unambiguously determine what portion of the H i absorption in any component is due to the host galaxy ISM and what portion is due to an AGN outflow, we cannot make this assumption. However, because the low-ionization lines in Components 1, 3, 4, and 5 are likely to arise in regions far from the AGN in Mrk 279, we simply assume that the covering fractions are unity and use Equation 4 to calculate the column densities of low-ionization species using C iii 977, N iii 989, C ii 1036, and N ii 1084 in the FUSE data, and Si iii 1206, Si ii 1260, and C ii 1334 in the STIS data. In cases where we do not measure a column density of greater than 3 significance, we quote a 3 upper limit. The results of these measurements are listed in Tables 8 and 9.
4.4.4 Foreground Galactic Absorption
As mentioned in Section 4.2, we computed models of foreground Galactic interstellar absorption using three different methods for estimating the ratios of the relevant species. We created the baseline models by using ratios that give the lowest between the modeled interstellar absorption features and the observed spectra. We calculated the other two models, which we now compare with the 1999 December baseline model results, from fits to FUSE spectra of six AGNs that show no intrinsic absorption and from published ratios from Morton (1991) and Howk et al. (2000). We calculated the covering fractions and optical depths of H i, O vi, and C iii for Component 4, and for O vi in Components 1 and 3 using both of these other ISM models. In no case do the results differ by more than 1.5 from the values derived using our fiducial ISM model, and in most cases, the difference is less than 1. We conclude from this that uncertainties in our ISM model are not a significant source of systematic error in our covering fraction and column density calculations.
4.5 Variability
4.5.1 Continuum and Emission Lines
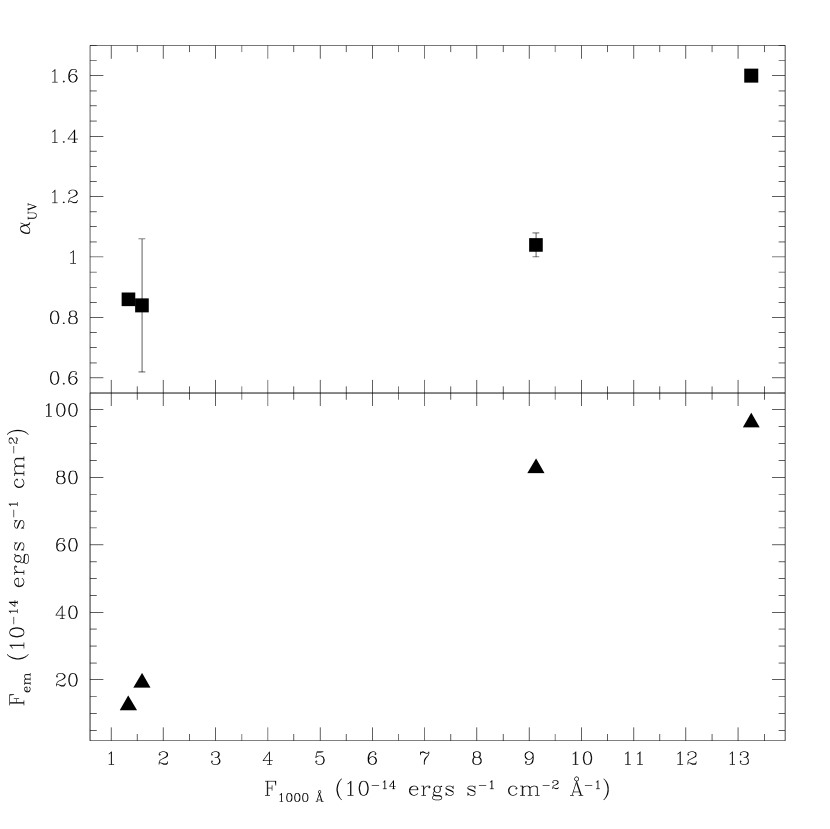
The variability of the 1000 Å flux and the UV spectral index of Mrk 279 with time are shown in Figure 25. The continuum flux drops by a factor of 7.5 from 1999 December to 2002 January and remains at roughly this level in 2002 May. As discussed in Section 3.1, the Chandra spectrum of 2002 May also shows Mrk 279 in a low state. The brighter UV continua are fitted best by bluer power laws, as indicated in the bottom panel of Figure 25. The variation of the flux in the broad O vi emission line with time is shown in Figure 25. The broad line flux varies dramatically in response to the changes in the continuum flux, dropping by a factor of four between 2000 January and 2002 January. The top panel of Figure 25 illustrates the changes in the UV spectral index with continuum flux. As noted above, the continuum of Mrk 279 becomes systematically redder as it becomes fainter.
From studies of large AGN samples (Laor et al. 1995; Zheng, Kriss, & Davidsen 1995; Green 1996; Green, Forster, & Kuraszkiewicz 2001; Dietrich et al. 2002; Kuraszkiewicz et al. 2002) the Baldwin effect has been found to be particularly pronounced for O vi emission lines. These studies have found Baldwin relation slopes, , ranging from -0.50 to -0.15, where (Ovi) . Kinney, Rivolo, & Koratkar (1990) found that as individual AGNs vary in luminosity, they show an intrinsic Baldwin relation in the C iv and Ly emission lines, with steeper slopes than the relation derived from their full AGN sample. In the bottom panel of Figure 25, we show the O vi emission line flux versus the monochromatic flux at 1000 Å, and we use the four observations of Mrk 279 to examine the intrinsic Baldwin effect in the broad O vi emission line. We derive a Baldwin relation slope for O vi of . This result runs counter to the expectation as it is flatter than the ensemble Baldwin relation slopes for O vi quoted above. We note, however, that this slope is based on four observations of Mrk 279, while Kinney et al. (1990) drew their conclusions from seven AGNs with 16 or more observations each. Also, we have not corrected for the response time of the BELR to changes in the continuum, which may introduce scatter into the Baldwin relation (Pogge & Peterson 1992). Balmer line time-delay measurements suggest a BELR size of lt-days for Mrk 279 (Maoz et al. 1990; Stirpe & de Bruyn 1991; Stirpe et al. 1994; Santos-Lleó et al. 2001), but we do not correct for the light travel time between the continuum source and the BELR as we have not sampled the light curve of Mrk 279 finely enough for such an analysis.
4.5.2 Intrinsic Absorption
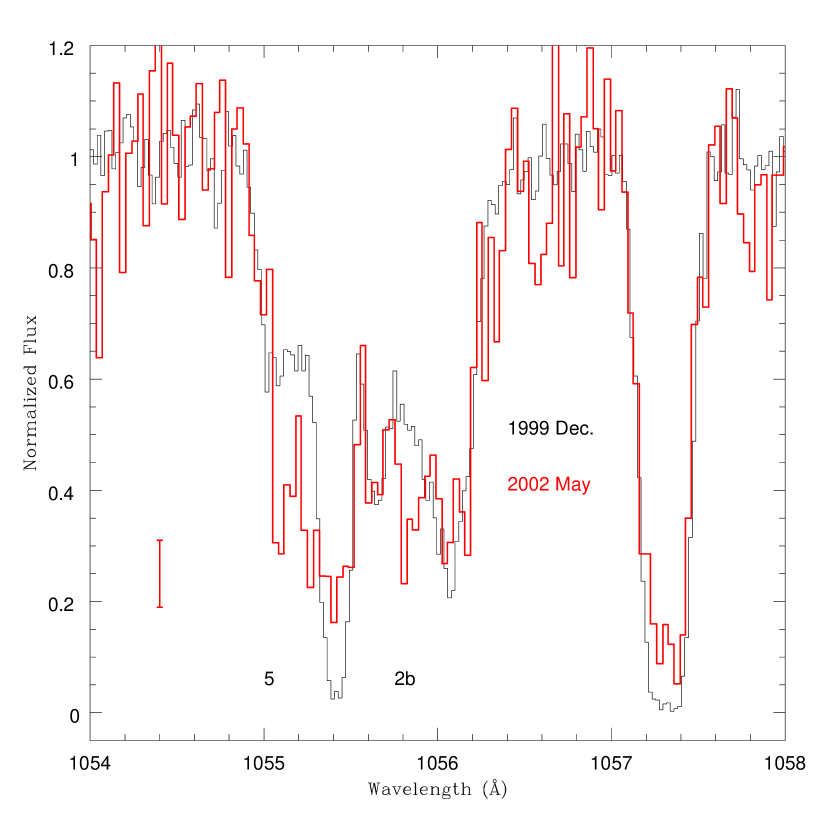
We see variability in the flux profiles of the intrinsic absorption over the course of the observations presented here. To investigate this, we use the 1999 December FUSE spectrum as representative of the 2000 epoch and the 2002 May FUSE spectrum as representative of the 2002 epoch. The normalized Ly and O vi profiles in the 1999 December and 2002 May spectra are shown in Figures 27 and 27. The red errorbars at the left of each figure illustrate representative flux errors in the troughs of the Ly and O vi absorption lines in the 2002 May spectrum. In Ly, Components 2b and 5 appear to be more pronounced in the 2002 May spectrum than in 1999 December. Comparing the region from -320 to -360 km s-1 in the covering fraction histograms shown in Figures 18 and 20 and examining the average covering fractions in each component shown in Figure 22, we see that the covering fraction in Component 2b is correspondingly larger in the 2002 solution, although not by a significant factor. Also, Figure 22 demonstrates that there are no significant differences in the column densities for this component in these two epochs, although because of the S/N in the 2002 epoch data, we are only able to place lower limits on the column density in Components 2, 2a, and 2b. A similar situation holds for Component 5.
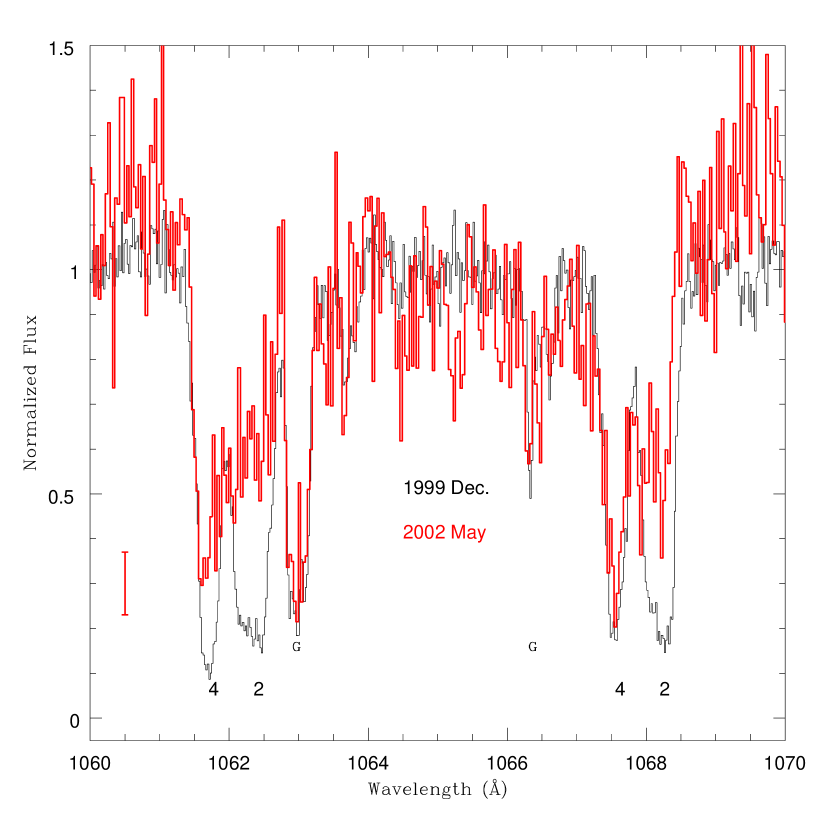
Figure 27 shows that the O vi absorption profiles changed between the 2000 and 2002 epochs as well. Specifically, Component 2 appears to be weaker in the 2002 May spectrum. Because the O vi absorption is saturated in both epochs, we are only able to place lower limits on the column density in this component. Component 4 in the 2002 May spectrum is saturated as well, and it even appears that the red doublet line is stronger than the blue line, perhaps indicating a problem with the removal of the interstellar Fe ii in the blue component. The limits placed on the O vi column density for Component 4 in 2002 May are consistent with no variation since the 1999 epoch. Therefore, even though the absorption profiles of Ly and O vi appear to vary in some components, it is not clear whether this is due to a change in the column density or the covering fraction of the absorbers.
The overall and profiles, shown in Figures 18 and 20, are similar in the 1999 December and 2000 January spectra, with the exception of Components 4a and 5. Component 4a shows a smaller covering fraction and larger optical depth in the 1999 December spectrum compared with 2000 January, while the reverse is true for Component 5. The constraints are poor enough, however, that the uncertainties on and are consistent with no change in these components over this short time period. In the 2002 May spectrum, however, the profiles are substantially different. The broad Ly absorption in Component 1 is reflected in the covering fraction profile in the third panel of Figure 20. Similarly, the broad Ly absorption trough in Components 2-5 and the extension of the Ly absorption blueward of Component 5 is reflected in the covering fraction solutions. The bottom panels of Figures 18 and 20 illustrate the significantly lower optical depths derived in Components 4 and 4a in 2002 May than in 1999 December, and the corresponding summed column densities in these components are shown in the top and bottom panels of Figure 22.
To investigate whether the intrinsic absorption has responded to the dramatic changes in the ionizing continuum of Mrk 279, we show the variation in (H i) with UV continuum flux Figures 29 and 29. The measurements and limits on (H i) in Component 1, attributed to the AGN host galaxy, are consistent with no variation. The H i column densities in Components 2, 2a, and 2b also do not appear to vary. In Components 3 and 5, we find a marginal decrease in (H i), by a factor of 2, between the 1999/2000 and 2002 epochs as the 1000 Å flux decreased. For Components 4 and 4a, however, we find that the H i column density decreased more significantly over this period. The H i column density in Component 4a decreased by a factor of 7, and that in Component 4 decreased by a factor of 10 between 1999 December and 2002 May, as the continuum flux dropped by a factor of 7. This runs counter to expectation for a scenario in which the ionization state of the absorbers responds directly to changes in the ionizing continuum.
5 Discussion
Figures 7, 9, 11, and 13 clearly illustrate the strong, saturated, intrinsic O vi absorption present in the Mrk 279 spectrum. However, absorption due to ions such as C iii, N iii, Si ii, C ii, and N ii indicates the presence of low-ionization gas along the line of sight. The low S/N of the Chandra spectrum limits our analysis, but we find no discernible O vii or O viii absorption features and few other high-ionization X-ray absorption lines in those data.
We derive limits on the column densities of O vii and O viii, (O vii, O viii) cm-2. This (O vii) limit is approximately one order of magnitude lower than the O vii column densities measured in the X-ray spectra of NGC 3783 ( cm-2, Kaspi et al. 2002, Behar et al. 2003) and NGC 5548 ( cm-2, Kaastra et al. 2002) and that inferred from the model for the warm absorber in Mrk 509 ( cm-2, Yaqoob et al. 2003). The (O viii) limit is 1-2 orders of magnitude lower than the values measured or inferred for these AGN (NGC 3783: cm-2, Kaspi et al. 2002, Behar et al. 2003; NGC 5548: cm-2, Kaastra et al. 2002; Mrk 509: cm-2, Yaqoob et al. 2003). Assuming solar abundances (Anders & Grevesse 1989) and that all oxygen in the absorber is in the form of either O vii or O viii, these column density limits imply cm-2. This total hydrogen column is 1-2 orders of magnitude less than values typically derived for warm absorbers (Kaspi et al. 2002, Behar et al. 2003, Blustin et al. 2002, 2003, Kaastra et al. 2002, Krongold et al. 2003, Netzer et al. 2003, Yaqoob et al. 2003). However, a strong caveat to the (O vii) and (O viii) limits is that they assume the lines lie on the linear part of the curve-of-growth. If the line widths of the X-ray absorbers are comparable to those derived in the UV, 100 km s-1, the column densities in O vii and O viii can be as large as and cm-2, respectively, and the equivalent total hydrogen column density is totally consistent with other X-ray absorbers. Although it is difficult to draw strong conclusions from the low S/N in the X-ray spectrum of Mrk 279 presented here, Mrk 279 may be qualitatively similar to Ton S180 (Turner et al. 2001, 2002) in the sense that it shows intrinsic absorption in O vi, but no evidence for a warm absorber in the X-ray regime. The weak H i absorption and the limit on the (Ovii)/(Ovi) ratio inferred from the X-ray and UV spectra of Ton S180 indicate that the absorbing gas must be in a high ionization state. By contrast, the spectra of Mrk 279 show strong features due to both H i and O vi.
In Components 2, 2a, and 2b of the UV absorption, we find strong O vi and H i absorption, although the Ly and Ly profiles are somewhat shallower than in adjacent components. The H i covering fractions of these components measured from the 1999 December and 2002 May spectra are significantly less than 1, and the results from 2000 January and 2002 January are consistent with . The absorption due to low-ionization species is less prominent in these components than in Components 1 and 4. The O vi and Ly profiles of Components 2, 2a, and 2b change over the course of the observations, owing to variations in the covering fractions and/or the column densities, but the uncertainties in our measurements do not allow us to determine which. In either case, this variability, the weak low-ionization absorption, and the non-unity covering fractions imply that these components do arise in an outflow from the AGN in Mrk 279.
In Components 1 and 4, we find significant absorption due to low-ionization species such as C iii, N iii, and Si iii, and even C ii and N ii in the case of Component 4. We suggest that these lines may not in fact arise in the AGN outflow but rather in gas associated with the host galaxy in either its ISM, or in material analogous to the HVCs observed in the Milky Way, or in material participating in an interaction with a physical companion. There are five pieces of evidence that support these interpretations: (1) the velocity of Component 1 is consistent with the systemic redshift of Mrk 279; (2) the covering fractions of the H i absorption in these components are consistent with unity; (3) the absorption profiles of the low- and high-ionization species in Component 4 are markedly different; (4) the density inferred for Component 4 is significantly less than that typically found for intrinsic absorbers in AGN outflows; (5) the H i column density of Component 1 does not vary.
In Components 1 and 4, the H i covering fractions are consistent with unity in all the observations. Component 4 shows absorption due to low-ionization species such as C ii and N ii. Intrinsic absorption due to low-ionization species has been observed in the spectrum of NGC 4151, but unlike Component 4 here, it shows partial covering (Kriss et al. 1995, Espey et al. 1998, Weymann et al. 1997). We do observe absorption due to highly ionized species such as O vi, N v, and C iv at the velocities of these components and find that the velocity widths of the absorption in the high-ionization lines are larger those that of H i and the low-ionization lines (Figure 16). This phenomenon was observed in one of the intrinsic absorption components of NGC 3783 (Gabel et al. 2003a). However, highly ionized species are also observed in the Galactic halo and in HVCs (Savage, Sembach, & Lu 1997; Sembach, Savage, & Hurwitz 1999a; Savage, Meade, & Sembach 2001; Wakker et al. 2003; Savage et al. 2003; Sembach et al. 2003) with some HVCs showing strong absorption due to highly-ionized species and little or no absorption due to low ions (Sembach et al. 1999b). Moreover, Howk, Sembach, & Savage (2003) have observed that the absorption profile of O vi along a sight line through the warm-hot thick disk ISM of the Milky Way shows a larger velocity width than those of the low and intermediate ions while coinciding with them in velocity centroid and overall extent. This is interpreted to be a result of the O vi arising at the interfaces surrounding warm interstellar clouds. Therefore, although the broader profile shapes of the high-ionization lines suggest a different origin from that of the low-ionization gas seen in C iii, for example, some portion of the high-ionization absorption may also be attributable to the host galaxy of Mrk 279. We note, however, that the O vi and C iv covering fractions of Components 1 and 4 do tend to be smaller than the H i covering fractions.
For Component 4, we use the 2.3 detection of C ii 1334 and the non-detection of C ii∗ 1335 in the STIS spectrum to place a limit on the density. We find (C ii∗)/(C ii) 1.3. For pure collisional excitation and , this implies 750 cm-3. (Srianand & Petitjean 2000). This is lower than the broad range of densities typically inferred for AGN outflows from a variety of methods, cm-3 (see, however, Behar et al. 2003). We tentatively interpret this as another piece of evidence that the low-ionization species observed in Component 4 in the Mrk 279 spectrum do not arise in the AGN outflow, but in gas of lower density associated with the host galaxy.
As we noted above, the H i column density in Component 4 decreases significantly as the UV continuum flux of Mrk 279 decreases over the time period of our observations. However, we stress that in the 2002 May observations, we lack coverage of the Lyman series blueward of Ly. In the 1999/2000 epoch, it is the absorption in the high-order Lyman lines that drives the solution for (H i) to large values. Also, the deep Ly trough of Components 3-5 in the 2002 May STIS spectrum drives the covering fraction solution to values near unity. This would require smaller (H i) for the 2002 May solution even if the depth of the Ly trough was similar to that observed in the 1999/2000 epoch. Figure 27 shows that the Ly absorption in Component 4 is in fact marginally shallower than observed in 1999 December. Solving for and in Component 4 using only the lines in common between the 1999 December and 2002 May observations, Ly and Ly, we find the same result, namely that (H i) is significantly lower in 2002 May than in 1999 December.
A variation in column density that cannot be explained by photoionization may indicate the influence of bulk transverse motion in an absorbing outflow, as observed in the spectrum of NGC 3783 (Kraemer et al. 2001). However, as discussed above, the low density of Component 4 suggests that it does not arise in an AGN outflow. A large contribution to the absorption from the host galaxy may also help resolve this puzzle. If low-density gas lies at several kiloparsecs from the continuum source one would not expect to observe changes in the ionization structure of the gas in direct response to the variability of the AGN continuum on short timescales. To illustrate with a simple calculation, we choose a total column density typical of Galactic HVCs, (Sembach et al. 1999b), and an ionization parameter near the peak of the C ii abundance curve, =-3, since Component 4 shows substantial C ii absorption. Given the upper limit on the density set by the absence of C ii∗ absorption, 750 cm-3, and the luminosity of Mrk 279, this places the absorbing gas at 1 kpc from the ionizing source, well outside the nuclear region. For a neutral fraction of , the recombination timescale is 1.5 yr. This period of time is short enough for the ionization state of the absorber to vary between the 1999/2000 and 2002 epochs but long enough that the gas may not have responded to changes in the ionizing continuum that occurred prior to the 2002 observations.
The origin of Components 3 and 5 of the intrinsic absorption is ambiguous. These components show low-ionization absorption with profiles that differ from those seen in O vi, as discussed in Section 4.3. These components show a marginal decrease in (H i) with decreasing UV continuum flux, in the same sense observed for Component 4. The H i covering fractions of Components 3 and 5 are consistent with unity within the uncertainties with the exception of found for Component 3 in the 1999 December spectrum. However, the H i covering fractions of Components 3 and 5 are uniformly less than unity, and lower than those measured in Components 1 and 4, suggesting an origin in a nuclear outflow.
With the exception of Component 1, all velocity components are viewed with large blueshifts with respect to the systemic redshift of the galaxy, itself defined by galactic absorption lines, as discussed in Section 4.3. This implies that the low-ionization gas and perhaps some fraction of the high-ionization gas seen in Component 4 is analogous to the Milky Way HVCs and is involved in some kind of large-scale galactic outflow, such as a galactic fountain. In a fountain flow, we may expect to see both blueshifted and redshifted absorption as the material falls back onto the disk of the galaxy. In light of this, we note that the host galaxy of Mrk 279 is an S0 galaxy with an off-center nucleus, indicating an interaction with a neighboring galaxy, MCG +12-13-024, from which it is separated by 20 kpc and 360 km s-1 in line-of-sight velocity (Keel et al. 1996). High-resolution imaging of Mrk 279 reveals the presence of a nuclear dust spiral and a large-scale bar (Pogge & Martini 1998; Peletier et al. 1999), and its inclination is . It is therefore plausible that our line of sight traces a substantial path through the disk and halo of the early-type host galaxy of Mrk 279, that the dynamical state of its ISM and immediate environment is complex, and that this is reflected in the absorption patterns we observe.
6 Summary
We have presented far-UV observations of Mrk 279 from FUSE obtained over a 2.4-yr period. We have also presented UV and X-ray spectra from STIS and Chandra taken simultaneously with the final FUSE spectrum. From these data, we conclude the following:
-
1.
Over the 2.4-yr epoch of observations, the UV continuum flux of Mrk 279 decreased by a factor of 7.5. The brighter spectra show bluer power-law continuum slopes. The flux in the broad O vi emission lines decreased by a factor of 8 over this period, in tandem with changes in the continuum flux.
-
2.
We do not detect absorption due to O vii or O viii in the merged MEG + HEG Chandra spectrum. We use this non-detection to set limits of (O vii,O viii) cm-2, under the assumption of unsaturated absorption. However, for a reasonable assumption about the Doppler parameter of the X-ray absorber, the column densities in O vii and O viii can be large enough to be consistent with X-ray observations of other AGNs that also show intrinsic absorption in the UV.
-
3.
We detect significant, narrow (FWHM 4200 km s-1) Fe K emission in both the HEG and MEG Chandra spectra. The line is marginally blueshifted with respect to the systemic redshift of Mrk 279 and is reduced in strength in direct proportion to changes in the continuum flux as compared with previous observations with ASCA.
-
4.
Components 2, 2a, and 2b show strong O vi and prominent H i absorption with little absorption due to other low-ionization species. The H i covering fractions are consistently less than unity. The Ly and O vi flux profiles in these components vary, but it is not clear whether this is due to a change in the covering fractions or column densities of the absorbers. These characteristics lead us to conclude that these components arise in an outflow from the AGN in Mrk 279.
-
5.
The large H i column density of UV absorption Component 1, constant over the four observation epochs, its low ionization state, high covering fraction, and its velocity consistent with the systemic redshift of Mrk 279 indicate that it likely arises in the host galaxy of this AGN.
-
6.
Component 4 displays absorption due to a wide range of ionization states including a strong Lyman series from neutral hydrogen, prominent C iii, N iii, and Si iii and detectable C ii, N ii, and Si ii as well as features due to highly ionized species such as O vi, C iv, and N v. The absorption profiles of the high-ionization lines are distinctly different from those of the low-ionization lines, showing velocity offsets and larger velocity widths. The H i column density in this component decreased by a factor of 10 as the UV continuum flux of Mrk 279 decreased by a factor of 7. This component also shows a neutral hydrogen covering fraction consistent with unity at all epochs. These characteristics lead us to conclude that the ISM of the host galaxy contributes to the total absorption in this component.
-
7.
The low density inferred from (Cii∗)/(C ii) in Component 4, 750 cm-3, also indicates that the low-ionization gas arises in the host galaxy rather than the AGN outflow.
-
8.
The origin of Components 3 and 5 is uncertain. They show some similarities to Component 4 that suggest an association with the AGN host galaxy, namely low-ionization absorption with profiles that differ from the high-ionization absorption profiles and marginal variability in (H i) with UV continuum flux in the same sense as Component 4. However, although the H i covering fractions of these components are generally consistent with unity, they are uniformly less than unity, implying an origin in an AGN outflow.
-
9.
The large blueshifts of Components 3, 4, and 5 with respect to the systemic redshift of the host of Mrk 279 imply that if some part of the absorption in these components arises in the host galaxy, some type of galactic outflow may be present. Alternatively, the absorption may arise in a physical interaction between Mrk 279 and a companion galaxy, MCG +12-13-024.
Another set of simultaneous UV and X-ray observations of Mrk 279 obtained in 2003 March with FUSE, STIS, and Chandra, when the AGN was once again in a high state, are forthcoming in a future paper (Arav et al. 2004, in preparation). Because of the complicated, multiphase nature of the intrinsic absorption in the spectra we have presented, we defer detailed photoionization modeling for this future paper in order to incorporate these new data into that work.
References
- (1) Anders, E. & Grevesse, N. 1989, Geochim. Cosmochim Acta., 53, 197
- (2) Arav, N., Korista, K. T., & de Kool, M. 2002, ApJ, 566, 699
- (3) Barlow, T. A. & Sargent, W. L. W. 1997, AJ, 113, 136
- (4) Behar, E., Rasmussen, A. P., Blustin, A. J., Sako, M., Kahn, S. M., Kaastra, J. S., Branduardi-Raymont, G., & Steenbrugge, K. C. 2003, ApJ, 598, 232
- (5) Brotherton, M. S., Green, R. F., Kriss, G. A., Oegerle, W., Kaiser, M. E., Zheng, W., & Hutchings, J. B. 2002, ApJ, 565, 800
- (6) Blustin, A. J., Branduardi-Raymont, G., Behar, E., Kaastra, J. S., Kahn, S. M., Page, M. J., Sako, M., & Steenbrugge, K. C. 2002, A&A, 392, 453
- (7) Blustin, A. J., et al. 2003, A&A, 403, 481
- (8) Cardelli, J. A., Clayton, G. C., & Mathis, J. S. 1989, ApJ, 345, 245
- (9) Collins, J. A., Shull, J. M., & Giroux, M. L. 2002, ApJ, 585, 336
- (10) Crenshaw, D. M. & Kraemer, S. B. 1999, ApJ, 521, 572
- Crenshaw et al. (1999) Crenshaw, D. M., Kraemer, S. B., Boggess, A., Maran, S. P., Mushotzky, R. F., & Wu, C. 1999, ApJ, 516, 750
- Crenshaw et al. (2000) Crenshaw, D. M., Kraemer, S. B., Hutchings, J. B., Danks, A. C., Gull, T. R., Kaiser, M. E., Nelson, C. H., & Weistrop, D. 2000, ApJ, 545, L27
- d (91) de Vaucouleurs, G., de Vaucouleurs, A., Corwin, H. G., Buta, R. J., Paturel, G., & Fouquè, P., 1991, Third Reference Catalog of Bright Galaxies, Version 3.9 (New York: Springer Verlag)
- dl (90) Dickey, J. M. & Lockman F. J. 1990, ARA&A, 28, 215
- D (02) Dietrich, M., Hamann, F., Shields, J. C., Constantin, A., Vestergaard, M., Chaffee, F., Foltz, C. B., Junkkarinen, V. T. 2002, ApJ, 581, 912
- E (98) Espey, B. R., Kriss, G. A., Krolik, J. H., Zheng, W., Tsvetanov, Z., & Davidsen, A. F. 1998, ApJ, 500, L13
- (17) Falco, E. E. et al. 1999, PASP, 111, 438
- (18) Feldman F. R., Weedman, D. W., Balzano, V. A., Ramsey, L. W. 1982, ApJ, 256, 427
- (19) Gabel, J. R. et al. 2003a, ApJ, 583, 178
- (20) Gabel, J. R. et al. 2003b, ApJ, 595, 120
- Ganguly et al. (1999) Ganguly, R., Eracleous, M., Charlton, J. C., & Churchill, C. W. 1999, ApJ, 117, 2594
- G (98) George, I. M., Turner, T. J., Netzer, H., Nandra, K., Mushotzky, R. F., & Yaqoob, T. 1998, ApJS, 114, 73
- G (96) Green, P. J. 1996, ApJ, 467, 61
- G (01) Green, P. J., Forster, K., & Kuraszkiewicz, J. K. 2001, ApJ, 556, 727
- Hamann et al. (1997) Hamann, F., Barlow, T. A., Junkkarinen, V., & Burbidge, E. M. 1997, ApJ, 478, 80
- (26) Heckman, T. M., Miley, G. K., van Breugel, W. J. M., Butcher, H. R. 1981, ApJ, 247, 403
- (27) Howk, J. C., Sembach, K. R., Roth, K. C., & Kruk, J. W. 2000, ApJ, 544, 867
- (28) Howk, J. C., Sembach, K. R., & Savage B. D. 2003, ApJ, 586, 249
- K (02) Kaastra, J. S., Steenbrugge, K. C., Raassen, A. J. J., van der Meer, R. L. J., Brinkman, A. C., Liedahl, D. A., Behar, E., & de Rosa, A. 2002, A&A, 427, 2002
- K (01) Kaspi, S., et al. 2001, ApJ, 554, 216
- K (02) Kaspi, S., et al. 2002, ApJ, 574, 643
- (32) Keel, W. C. 1996, AJ, 111, 696
- Kinney, Rivolo, & Koratkar (1990) Kinney, A. L., Rivolo, A. R., & Koratkar, A. P. 1990, ApJ, 357, 338
- KK (94) Königl, A. K. & Kartje, J. F. 1994, ApJ, 434, 446
- K (2001) Kraemer, S. B., Crenshaw, D. M., & Gabel, J. R. 2001, ApJ, 557, 30
- (36) Kraemer, S. B., Crenshaw, D. M., George, I. M., Netzer, H., Turner, T. J., & Gabel, J. R. 2002, ApJ, 577, 98
- K (2003) Kraemer, S. B., Crenshaw, D. M., Yaqoob, T., McKernan, B., Gabel, J. R., George, I. M., Turner, T. J., & Dunn, J. P. 2003, ApJ, 582, 125
- (38) Kraemer, S. B. et al. 2001, ApJ, 551, 671
- K (1994) Kriss, G. A. 1994, in ASP Conf. Ser. 61, Astronomical Data Analysis Software and Systems III, ed. Dr. R. Crabtree, R. J. Hanisch, & J. Barnes (San Francisco: ASP), 437
- K (2003) Kriss, G. A., Blustin, A., Branduardi-Raymont, G., Green, R. F., Hutchings, J., & Kaiser, M. E. 2003, A&A, 403, 473
- K (1995) Kriss, G. A., Davidsen, A. F., Zheng, W., Kruk, J. W., & Espey, B. R. 1995, ApJ, 454, L7
- (42) Kriss, G. A. et al. 2000a, ApJ, 538, L17
- (43) Kriss, G. A., Peterson, B. M., Crenshaw, D. M., & Zheng, W. 2000b, ApJ, 535, 58
- KK (1995) Krolik, J. H. & Kriss, G. A. 1995, ApJ, 447, 512
- KK (2001) Krolik, J. H. & Kriss, G. A. 2001, ApJ, 561, 684
- K (03) Krongold, Y., Nicastro, F., Brickhouse, N. S., Elvis, M., Liedahl, D. A., & Mathur, S. 2003, ApJ, 597, 832
- K (2001) Kuraszkiewicz, J. K., Green, P. J., Forster, K., Aldcroft, T. L., Evans, I. N., & Koratkar, A. 2002, ApJS, 143, 257
- Laor et al. (1994) Laor, A., Bahcall, J. N., Jannuzi, B. T., Schneider, D. P., Green, R. F., & Hartig, G. F. 1994, ApJ, 420, 110
- L (1995) Laor, A., Bahcall, J. H., Jannuzi, B. T., Schneider, D. P., & Green, R. F. 1995, ApJS, 99, 1
- L (02) Lindler, D. & Bowers, C. 2000, AAS,197, 1202
- (51) Maoz, D., Netzer, H., Leibowitz, E., et al. 1990, ApJ, 351, 75
- Marsh (2) Marshall H. L., Dewey, D., & Ishibashi, K. 2004a, SPIE, 5165, in press (astro-ph/0309114)
- (53) Marshall H. L., Tennant A., Grant C. E., Hitchcock A. P., O’Dell S., Plucinsky P. P. 2004b, SPIE, 5165, in press (astro-ph/0308332)
- M (1995) Mathur, S., Elvis, M., & Wilkes, B. 1999, ApJ, 519, 605
- (55) Moos, H. W., et al. 2000, ApJ, 538, L1
- (56) Morton, D. 1991, ApJS, 77, 119
- (57) Murray, N., Chiang, J., Grossman, S. A., & Voit, G. M. 1995, ApJ, 451, 498
- N (03) Netzer, H., et al. 2003, ApJ, in press (astro-ph/0309096)
- (59) Peletier, R. F., Knapen, J. H., Shlosman, I., Pérez-Ramírez, D., Nadeau, D., Doyon, J. M., Rodriguez Espinosa, J. M., & Pérez García, A. M. 1998, ApJS, 125, 363
- (60) Penton, S. V., Stocke, J. T., & Shull, J. M. 2000, ApJS, 130, 121
- (61) Pogge, R. W. & Martini, P. 2002, ApJ, 569, 624
- (62) Pogge, R. W. & Peterson, B. M. 1992, AJ, 103, 4
- (63) Sahnow, D. J., et al. 2000, ApJ, 538, L7
- (64) Santos-Lleó, M. Clavel, J., Schulz, B. et al. 2001, å, 369, 57
- Savage et al. (2003) Savage, B. D. et al. 2003, ApJS, 146, 125
- Savage, Meade, & Sembach (2001) Savage, B. D., Meade, M. R., & Sembach, K. R. 2001, ApJS, 136, 631
- Savage & Sembach (1991) Savage, B. D. & Sembach, K. R. 1991, ApJ, 379, 245
- Savage, Sembach, & Lu (1997) Savage, B. D., Sembach, K. R., & Lu, L. 1997, AJ, 113, 2158
- Schlegel, Finkbeiner, & Davis (1998) Schlegel, D. J., Finkbeiner, D. P., & Davis, M. 1998, ApJ, 500, 525
- (70) Sembach, K. R. et al. 2003, ApJS, 146, 165
- Sembach, Savage, & Hurwitz (1999) Sembach, K. R., Savage, B. D., & Hurwitz, M. 1999a, ApJ, 524, 98
- (72) Sembach, K. R., Savage, B. D., Lu, L., & Murphy, E. M. 1999b, ApJ, 515, 108
- (73) Shields, J. C. & Hamann, F. 1997, ApJ, 481, 752
- (74) Srianand, R. & Petitjean, P. 2000, A&A, 357, 414
- Steenbrugge et al. (2003) Steenbrugge, K. C., Kaastra, J. S., de Vries, C. P., & Edelson, R. 2003, A&A, 402, 477
- (76) Stirpe, G. M., & de Bruyn, A. G. 1991, å, 245, 355
- (77) Stirpe, G. M. et al. 1994, å, 285, 857
- (78) Telfer, R. C., Zheng, W., Kriss, G. A., & Davidsen, A. F. 2002, ApJ, 565, 773
- (79) Turner, T. J., George, I. M., Yaqoob, T., Kriss, G., Crenshaw, D. M., Kraemer, S., Zheng, W., & Nandra, K. 2001, ApJ, 548, L13
- (80) Turner, T. J., et al. 2002, ApJ, 568, 120
- Wakker et al. (2003) Wakker, B. P. et al. 2003, ApJS, 146, 1
- (82) Wakker, B. P., Kalberla, P. M. W., van Woerden, H., de Boer, K. S., & Putman, M. E. 2001, ApJS, 136, 537
- (83) Weaver, K. A., Gelbord, J., & Yaqoob, T. 2001, ApJ, 550, 261
- W (97) Weymann, R. J., Morris, S. L., Gray, M. E., & Hutchings, J. B. 1997, ApJ, 483, 717
- (85) Yaqoob, T., McKernan, B., Kraemer, S. B., Crenshaw, D. M., Gabel, J. R., George, I. M., & Turner, T. J. 2003, ApJ, 582, 105
- Z (01) Zheng, W. et al. 2001, ApJ, 562, 152
- Z (95) Zheng, W., Kriss, G. A., & Davidsen, A. F. 1995, ApJ, 440, 606
| Instrument | ID | Start Date | UT | Exp. (s) |
|---|---|---|---|---|
| Chandra | 700501/3062 | 2002-05-18 | 06:28:37 | 114200 |
| FUSE | P1080303 | 1999-12-28 | 00:37:05 | 61139 |
| FUSE | P1080304 | 2000-01-11 | 01:28:19 | 30288 |
| FUSE | S6010501 | 2002-01-28 | 22:52:53 | 18115 |
| FUSE | S6010502 | 2002-01-29 | 07:10:53 | 19082 |
| FUSE | C0900201 | 2002-05-18 | 18:13:44 | 47414 |
| STIS | O6JM01 | 2002-05-18 | 12:53:58 | 13193 |
| Obs. Date | (1000 Å)22Flux at 1000 Å in units of 10-13 ergs s-1 cm-2 Å-1 | (Å) | |
|---|---|---|---|
| 1999Dec28 | 927-1150 | ||
| 2000Jan11 | 927-1150 | ||
| 2002Jan28-29 | 1000-1182 | ||
| 2002May18 | 994-168233FUSE spectrum from LiF channel only, combined with STIS spectrum |
| Line | Flux11Flux in units of 10-14 ergs cm-2 s-1 | Velocity22Velocity relative to systemic redshift, | FWHM | |
|---|---|---|---|---|
| (Å) | (km s-1) | (km s-1) | ||
| 1999 December | ||||
| Svi | 933.37 | 6.0 2.2 | 929 1091 | 7504 34 |
| Svi | 944.52 | 3.0 1.1 | 929 1091 | 7504 34 |
| Ciii | 977.02 | 30.0 6.8 | 491 208 | 8852 770 |
| Niii | 989.79 | 7.3 1.7 | 599 2637 | 8852 770 |
| Ly broad | 1025.72 | 29.7 1.0 | -317 110 | 8555 869 |
| Ly int. | 1025.72 | 8.9 2.2 | -252 48 | 3308 428 |
| Ly narrow33Velocity and FWHM fixed at 2002 May values | 1025.72 | 0.3 0.6 | 315 17 | 697 34 |
| Ovi broad | 1031.93 | 96.3 1.9 | 595 115 | 7504 34 |
| Ovi broad | 1037.62 | 48.1 0.9 | 595 115 | 7504 34 |
| Ovi int. | 1031.93 | 31.4 0.5 | -67 5 | 2695 187 |
| Ovi int. | 1037.62 | 15.7 0.2 | -67 5 | 2695 187 |
| Siv | 1062.66 | 12.8 0.4 | -222 104 | 3213 345 |
| Siv | 1072.97 | 12.8 0.4 | -222 104 | 3213 345 |
| Heii | 1085.15 | 30.8 0.7 | -63 45 | 7504 34 |
| 2000 January | ||||
| Svi | 933.37 | 5.0 2.1 | 1138 932 | 7023 9 |
| Svi | 944.52 | 2.5 1.0 | 1138 932 | 7023 9 |
| Ciii | 977.02 | 24.7 5.7 | 220 986 | 8576 314 |
| Niii | 989.79 | 21.0 5.3 | -147 658 | 8576 314 |
| Ly broad | 1025.72 | 34.1 2.3 | 150 42 | 7858 305 |
| Ly int. | 1025.72 | 7.6 1.8 | 102 70 | 2395 361 |
| Ly narrow33Velocity and FWHM fixed at 2002 May values | 1025.72 | 0.7 0.4 | 315 17 | 697 34 |
| Ovi broad | 1031.93 | 82.7 0.4 | 372 59 | 7023 9 |
| Ovi broad | 1037.62 | 41.4 0.2 | 372 59 | 7023 9 |
| Ovi int. | 1031.93 | 27.7 0.4 | 144 31 | 2164 58 |
| Ovi int. | 1037.62 | 13.8 0.2 | 144 31 | 2164 58 |
| Siv | 1062.66 | 17.9 0.5 | 278 59 | 3500 21 |
| Siv | 1072.97 | 17.9 0.5 | 278 59 | 3500 21 |
| Heii | 1085.15 | 30.4 0.9 | -125 40 | 7023 9 |
| 2002 January | ||||
| Ciii | 977.02 | 7.0 1.2 | -348 628 | 8315 333 |
| Niii | 989.79 | 7.9 0.7 | -482 426 | 8315 333 |
| Ly broad | 1025.72 | 8.0 0.9 | 150 363 | 9488 61 |
| Ly int. | 1025.72 | 3.8 1.2 | -130 275 | 1702 277 |
| Ly narrow33Velocity and FWHM fixed at 2002 May values | 1025.72 | 0.3 0.5 | 315 17 | 697 34 |
| Ovi broad | 1031.93 | 19.1 1.0 | 615 166 | 7081 56 |
| Ovi broad | 1037.62 | 9.5 0.5 | 615 166 | 7081 56 |
| Ovi int. | 1031.93 | 17.0 0.5 | 45 25 | 1674 123 |
| Ovi int. | 1037.62 | 8.5 0.2 | 45 25 | 1674 123 |
| Siv | 1062.66 | 1.6 0.2 | -198 95 | 3438 335 |
| Siv | 1072.97 | 1.6 0.2 | -198 95 | 3438 335 |
| Heii | 1085.15 | 4.8 0.4 | -79 367 | 7081 57 |
| 2002 May44FUSE spectrum from LiF1 channel only, combined with STIS spectrum | ||||
| Svi | 933.37 | 4.8 3.0 | 607 893 | 9495 58 |
| Svi | 944.52 | 2.4 1.5 | 607 893 | 9495 58 |
| Ciii | 977.02 | 9.4 1.2 | 394 664 | 9849 2133 |
| Niii | 989.79 | 0.4 0.4 | 665 1141 | 9849 2133 |
| Ly broad | 1025.72 | 4.3 2.7 | -396 36 | 7862 119 |
| Ly int. | 1025.72 | 5.2 0.7 | -243 18 | 2990 39 |
| Ly narrow | 1025.72 | 0.4 0.2 | 315 17 | 697 34 |
| Ovi broad | 1031.93 | 12.4 2.0 | 403 491 | 9495 58 |
| Ovi broad | 1037.62 | 6.2 1.0 | 403 491 | 9495 58 |
| Ovi int. | 1031.93 | 13.2 0.5 | 327 78 | 2758 43 |
| Ovi int. | 1037.62 | 6.6 0.2 | 327 78 | 2758 43 |
| Siv55Lack of LiF2 and SiC channels prevents coverage of 1083-1093 Å and fit to Siv1062 | 1072.97 | 2.2 0.4 | -12496 | 1104166 |
| Heii | 1085.15 | 0.2 0.008 | 360 170 | 9495 58 |
| Siii | 1192.33 | 1.3 0.3 | 545 234 | 9195 534 |
| Ly broad | 1215.67 | 130. 1.8 | -396 36 | 7862 119 |
| Ly int. | 1215.67 | 72.8 1.6 | -243 18 | 2990 39 |
| Ly narrow | 1215.67 | 9.0 0.5 | 315 17 | 697 34 |
| Nv broad | 1240.15 | 29.6 0.9 | 119 171 | 9495 58 |
| Nv int. | 1240.15 | 11.5 0.5 | 226 47 | 2758 43 |
| Siii | 1260.45 | 2.0 0.6 | 544 233 | 9195 534 |
| Oi+Siii | 1304.35 | 6.8 0.3 | 143 89 | 4043 354 |
| Cii | 1335.30 | 1.5 0.1 | -57 145 | 2460 147 |
| Siiv | 1393.76 | 9.8 0.2 | -283 270 | 9495 58 |
| Siiv | 1402.77 | 4.9 0.1 | -283 270 | 9495 58 |
| Oiv] | 1402.06 | 9.4 0.4 | -405 89 | 3609 138 |
| Civ broad | 1549.05 | 153. 1.1 | -177 8 | 9495 58 |
| Civ int. | 1549.05 | 50.1 0.9 | -196 18 | 2758 43 |
| Heii | 1640.50 | 15.4 0.9 | 184 185 | 9495 58 |
| Component | 1999 Dec. | 2000 Jan. | 2002 Jan. | 2002 May |
|---|---|---|---|---|
| Ly | ||||
| 1 | 90 | 90 | 90 | 90 |
| -15522Velocity components seen in Ly with no counterparts in the FUSE Ly profile, marked with bold lines in Figure 12. | ||||
| 2 | -265 | -265 | -250 | -250 |
| 2a | -300 | -305 | -300 | -280 |
| 2b | -325 | -335 | -330 | -335 |
| 3 | -385 | -385 | -380 | -390 |
| 4 | -450 | -450 | -450 | -450 |
| 4a | -510 | -500 | -490 | -490 |
| 5 | -540 | -540 | -560 | -540 |
| -60522Velocity components seen in Ly with no counterparts in the FUSE Ly profile, marked with bold lines in Figure 12. | ||||
| Ciii977 | ||||
| 1 | 85 | 85 | 80 | 85 |
| 2 | -255 | -260 | -260 | -260 |
| 2a | -290 | -300 | -290 | -300 |
| 2b | -320 | -330 | -345 | -335 |
| 3 | -385 | -385 | -380 | -385 |
| 4 | -460 | -460 | -460 | -445 |
| 4a | -505 | -495 | -510 | -485 |
| 5 | -550 | -550 | -570 | -550 |
| Ovi1032 | ||||
| 1 | 85 | 90 | 85 | 70 |
| 2 | -270 | -270 | -240 | -275 |
| 2a | -300 | -300 | -285 | -310 |
| 2b | -330 | -335 | -335 | -345 |
| 3 | -385 | -380 | -390 | -380 |
| 4 | -470 | -475 | -440 | -450 |
| 4a | -490 | -500 | -500 | -500 |
| 5 | -535 | -540 | -560 | -530 |
| Component | (1014 cm-2) | (km s-1) | ||
|---|---|---|---|---|
| 1999 December | ||||
| 1 | 60 | |||
| 2 | 30 | |||
| 2a | 24 | |||
| 2b | 36 | |||
| 3 | 42 | |||
| 4 | 30 | |||
| 4a | 30 | |||
| 5 | 30 | |||
| 2000 January | ||||
| 1 | 60 | |||
| 2 | 30 | |||
| 2a | 24 | |||
| 2b | 36 | |||
| 3 | 41 | |||
| 4 | 30 | |||
| 4a | 30 | |||
| 5 | 30 | |||
| 2002 May | ||||
| 1 | 57 | |||
| 2 | 28 | |||
| 2a | 28 | |||
| 2b | 37 | |||
| 3 | 40 | |||
| 4 | 28 | |||
| 4a | 31 | |||
| 5 | 28 | |||
| Component | (1014 cm-2) | (km s-1) | |
|---|---|---|---|
| 1999 December | |||
| 1 | 60 | ||
| 2 | 30 | ||
| 2a | 24 | ||
| 2b | 36 | ||
| 3 | 42 | ||
| 4 | 30 | ||
| 4a | 30 | ||
| 5 | 30 | ||
| 2000 January | |||
| 1 | 60 | ||
| 2 | 30 | ||
| 2a | 24 | ||
| 2b | 36 | ||
| 3 | 41 | ||
| 4 | 30 | ||
| 4a | 30 | ||
| 5 | 30 | ||
| 2002 January | |||
| 1 | 57 | ||
| 2 | 28 | ||
| 2a | 28 | ||
| 2b | 28 | ||
| 3 | 43 | ||
| 4 | 28 | ||
| 4a | 28 | ||
| 5 | 28 | ||
| 2002 May | |||
| 1 | 57 | ||
| 2 | 28 | ||
| 2a | 28 | ||
| 2b | 37 | ||
| 3 | 40 | ||
| 4 | 28 | ||
| 4a | 31 | ||
| 5 | 28 | ||
| Component | (1014 cm-2) | (km s-1) | |
|---|---|---|---|
| Species | Date | ||
| Ovi1032,1038 | 1999 December | ||
| 1 | 59 | ||
| 2 | 30 | ||
| 2a | 24 | ||
| 2b | 36 | ||
| 3 | 41 | ||
| 4 | 30 | ||
| 4a | 30 | ||
| 5 | 30 | ||
| Ovi1032,1038 | 2000 January | ||
| 1 | 59 | ||
| 2 | 30 | ||
| 2a | 24 | ||
| 2b | 36 | ||
| 3 | 41 | ||
| 4 | 30 | ||
| 4a | 30 | ||
| 5 | 30 | ||
| Ovi1032,1038 | 2002 January | ||
| 1 | 56 | ||
| 2 | 28 | ||
| 2a | 28 | ||
| 2b | 42 | ||
| 3 | 42 | ||
| 4 | 28 | ||
| 4a | 28 | ||
| 5 | 28 | ||
| Ovi1032,1038 | 2002 May | ||
| 1 | 59 | ||
| 2 | 28 | ||
| 2a | 28 | ||
| 2b | 40 | ||
| 3 | 39 | ||
| 4 | 25 | ||
| 4a | 28 | ||
| 5 | 31 | ||
| Nv1238,1242 | 2002 May | ||
| 1 | 11Limit calculated assuming (Ovi) | 60 | |
| 2 | 28 | ||
| 2a | 25 | ||
| 2b | 35 | ||
| 3 | 39 | ||
| 4 | 28 | ||
| 4a | 28 | ||
| 5 | 32 | ||
| Civ1548,1550 | 2002 May | ||
| 1 | 11Limit calculated assuming (Ovi) | 59 | |
| 2 | 31 | ||
| 2a | 25 | ||
| 2b | 37 | ||
| 3 | 11Limit calculated assuming (Ovi) | 39 | |
| 4 | |||
| 4a | 28 | ||
| 5 | 31 | ||
| Siiv1393,1402 | 2002 May | ||
| 1 | 11Limit calculated assuming (Ovi) | 59 | |
| 2 | 11Limit calculated assuming (Ovi) | 28 | |
| 2a | 11Limit calculated assuming (Ovi) | 28 | |
| 2b | 11Limit calculated assuming (Ovi) | 40 | |
| 3 | 11Limit calculated assuming (Ovi) | 39 | |
| 4 | 11Limit calculated assuming (Ovi) | 25 | |
| 4a | 11Limit calculated assuming (Ovi) | 28 | |
| 5 | 11Limit calculated assuming (Ovi) | 31 | |
| Component | (Ciii977)11Column densities in units of 1014 cm-2 | (Niii989) | (Cii1036) | (Nii1084) |
|---|---|---|---|---|
| 1999 Dec. | ||||
| 1 | ||||
| 3 | ||||
| 4 | ||||
| 5 | ||||
| 2000 Jan. | ||||
| 1 | ||||
| 3 | ||||
| 4 | ||||
| 5 | ||||
| 2002 Jan. | ||||
| 1 | ||||
| 3 | ||||
| 4 | ||||
| 5 | ||||
| 2002 May | ||||
| 1 | ||||
| 3 | ||||
| 4 | ||||
| 5 | ||||
| Component | (Siiii1206)11Column densities in units of 1014 cm-2 | (Siii1260) | (Cii1334) |
|---|---|---|---|
| 1 | |||
| 3 | |||
| 4 | |||
| 5 |

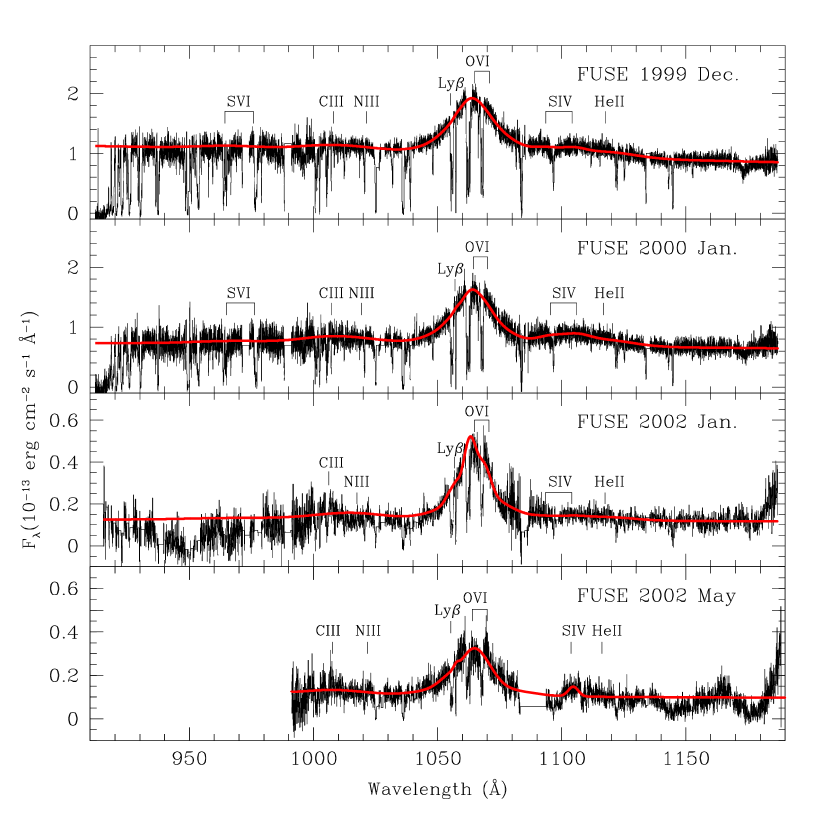
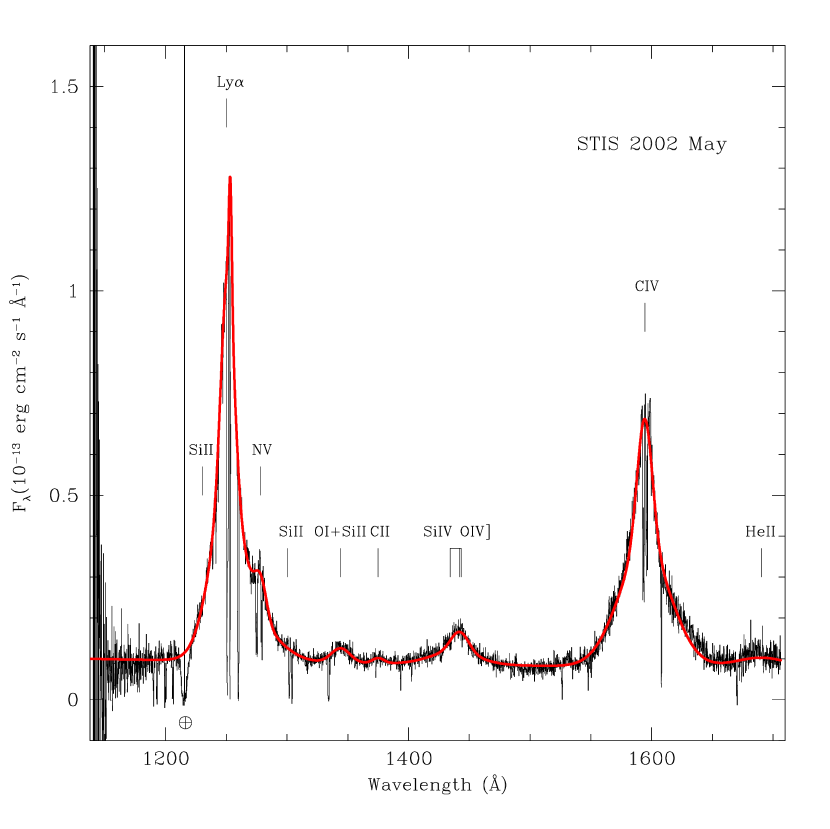


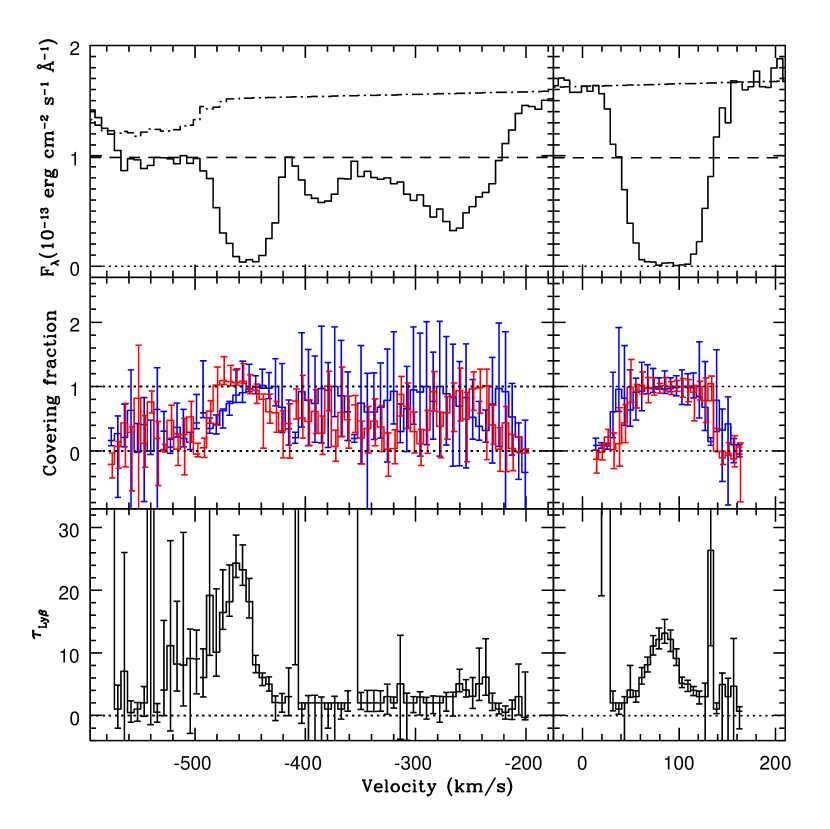


.