A very low luminosity X-ray flash: XMM-Newton observations of GRB 031203
Abstract
GRB 031203 was observed by XMM-Newton twice, first with an observation beginning 6 hours after the burst, and again after 3 days. The afterglow had average 0.2–10.0 keV fluxes for the first and second observations of and erg cm-2 s-1 respectively, decaying very slowly according to a power-law with an index of . The prompt soft X-ray flux, inferred from a detection of the dust echo of the prompt emission, strongly implies that this burst is very soft and should be classified as an X-ray flash (XRF) and further, implies a steep temporal slope () between the prompt and afterglow phases or in the early afterglow, very different from the later afterglow decay slope. A power-law () with absorption at a level consistent with the Galactic foreground absorption fits the afterglow spectrum well. A bright, low-redshift () galaxy lies within 0.5″ of the X-ray position and is likely to be the GRB host. At this redshift, GRB 031203 is the closest GRB or XRF known after GRB 980425. It has a very low equivalent isotropic -ray energy in the burst ( erg) and X-ray luminosity in the afterglow ( erg s-1 at 10 hours), 3–4 orders of magnitude less than typical bursts, though higher than either the faint XRF 020903 or GRB 980425. The rapid initial decline and subsequent very slow fading of the X-ray afterglow is also similar to that observed in GRB 980425, indicating that GRB 031203 may be representative of low luminosity bursts.
Subject headings:
gamma rays: bursts – supernovae: general – X-rays: general1. Introduction
A class of very soft burst, very similar to GRBs, has been identified and are referred to as X-Ray Flashes (XRFs, Heise et al. 2001). Given the similarity of durations between XRFs, X-ray rich bursts and GRBs (Heise et al. 2001; Barraud et al. 2003), the continuum of spectral properties observed (Lamb, Donaghy, & Graziani 2003a), from classic GRBs to X-ray rich bursts to XRFs and their cosmological origin (Bloom et al. 2003b; Soderberg et al. 2003a), it seems probable that XRFs and GRBs have very similar origins. XRFs have been defined by a larger X-ray than -ray fluence in the burst (, Lamb et al. 2003a); their distinguishing characteristic is a shift in the peak energy () of the burst from GRBs (typically keV, Preece et al. 2000) to XRFs ( keV, Preece et al. 2000; Lamb et al. 2003a). While GRBs and XRFs are located at cosmological distances, few have been located at redshifts . They are, GRB 030329 at (associated with SN2003dh, Hjorth et al. 2003; Stanek et al. 2003), XRF 020903 with its probable host galaxy at (Soderberg et al. 2003a), and GRB 980425 probably associated with SN1998bw at (Galama et al. 1998). Of these, only the redshift for GRB 030329 was found directly from the afterglow and it has characteristics that are still a matter of some debate; XRF 020903 had a very low peak spectral energy and a low luminosity (Sakamoto et al. 2003; Soderberg et al. 2003a), and GRB 980425 had an extraordinarily low luminosity (Kulkarni et al. 1998). On the basis of GRB 980425, it was suggested that a variety of GRB with very low luminosity, detectable at low redshift, form a distinct class of objects from classical, high-redshift GRBs (Kulkarni et al. 1998). It has also been suggested that low luminosity in a burst is related to a steeply declining afterglow (‘f-GRBs’, Bloom, Frail, & Kulkarni 2003c), or to low (Amati et al. 2002; Barraud et al. 2003; Sakamoto et al. 2003).
In this paper we report on XMM-Newton observations of GRB 031203,111We refer to this burst as GRB 031203 to avoid confusion, though we show it to be an XRF in § 5. begun six hours after the burst, as well as a second, serendipitous observation made on 6 Dec. 2003. During the first observation an echo of the prompt emission, reflected off dust in our Galaxy, was detected as an expanding ring centred on the afterglow. This was reported by Vaughan et al. (2003) and that remarkable detection (the first time that we are aware that prompt X-rays have been detected at energies below 2 keV) has allowed us to infer properties of the burst itself in soft X-rays, however the dust echo is not directly considered here.
A cosmology with , and H km s-1 Mpc-1 is assumed throughout. Error ranges quoted are 90% confidence intervals, unless stated otherwise.
2. Observations and data reduction
An initial 56 ks exposure, centred on the error-circle provided by the Integral Burst Alert System (Mereghetti et al. 2003; Götz et al. 2003), was made with XMM-Newton’s EPIC cameras. One X-ray source close to the centre of the circle was observed to fade (Rodriquez-Pascual et al. 2003). The astrometry of the field was corrected by matching X-ray sources to stars from the USNO-A2 catalogue using the SAS task eposcorr (Tedds & Watson 2002). The position of the fading X-ray source, (J2000) R. A. = , Dec. = °51′04.05″, with a error radius of 0.7″ (Tedds et al. 2003) is consistent with the position of a fading radio source (Frail 2003; Soderberg, Kulkarni, & Frail 2003b). A star-forming galaxy at redshift (Hsia et al. 2003; Bloom et al. 2003a; Prochaska et al. 2004) was also detected within 0.5″ of this position at near infrared wavelengths. No other fading sources are detected with EPIC in the IBAS error-circle. In light of this and the fact that the dust echo of a very bright transient source is detected centred on the fading source (Vaughan et al. 2003), the X-ray source at this position must be the GRB afterglow.
The first XMM-Newton observation was carried out under low background conditions (the background represents % of the extracted counts) and the data were not filtered for this reason beyond standard processing. Spectral data from the second observation were filtered due to high background in the middle and end of the observation. The ‘thin’ and ‘medium’ filters were used in the first observation with the pn and MOS cameras respectively. The ‘thick’ filters were used with each camera during the second observation, in which the principle target was Puppis, and the afterglow was off-axis by . Data from the EPIC-MOS and pn cameras are consistent within cross-calibration uncertainties. Because of the extreme lack of counts at low energies, most of the counts at energies below 0.8 keV are redistributed from higher energies; low-level uncertainty in this redistribution, usually negligible in spectra with only moderate soft absorption, has caused us to exclude data below 0.8 keV from the spectral analysis. The data reduction followed a standard procedure similar to that outlined in Watson et al. (2002b) except that the data were processed and reduced with the XMM-Newton SAS v. 5.4.1. A spectral binning using a minimum of 20 counts/bin was used. Two regions on the detector were used to obtain different background spectra, avoiding obvious sources and the dust-echo. No significant difference was observed using either background region. To calibrate the absolute fluxes for the lightcurves, the mean flux for the observation, derived from the best-fit model to the joint fit of the EPIC spectra, was used to scale the count-rate lightcurves, using the response matrices ancillary response vectors generated by the SAS tasks rmfgen and arfgen, which take into account, among other things, the off-axis angle of the source and the filter used. Careful analysis of the flux calibration required the use of ancillary response vectors newer than those available in the current version of the SAS; though usually insignificant for on-axis sources, this does affect sources far from the optical axis considerably (Saxton, priv. comm.).
The first observation was divided into five 11 ks segments to examine spectral evolution.
3. Results
The afterglow decays (Rodriquez-Pascual et al. 2003) during the first observation (Fig. 1), and is well fit ( for 54 degrees of freedom) by a power-law with index , a decay slower than reported for any previous X-ray afterglow except GRB 980425 (Pian et al. 2000). Continuing the power-law decay observed in the first observation fits the second observation well ( for both datasets). The fit to both datasets, a power-law with index , is not improved significantly by the addition of a break to the single power-law model ( compared to , -test probability = 0.65).
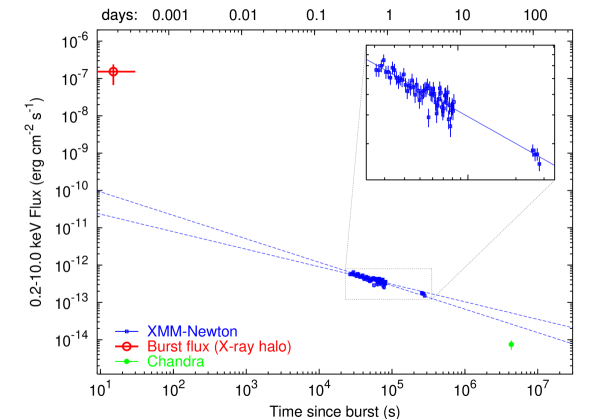
We (Vaughan et al. 2003) have discovered the first dust echo observed from a GRB and using it, have derived the 0.2–10.0 keV absorbed flux of the prompt emission ( erg cm-2 s-1). The drop in flux to erg cm-2 s-1 observed in the afterglow at the beginning of the XMM-Newton observation requires a slope and is not consistent with the decay slope of the best-fitting power-law. There must therefore have been a discontinuous flux change of orders of magnitude between the prompt and afterglow phases in the soft X-ray band (a characteristic somewhat atypical of bursts observed by BeppoSAX, Frontera et al. 2000); or there was a faster decay rate in the afterglow phase than is usual in early X-ray afterglows (typical early X-ray afterglow slopes are at day e.g., Butler et al. 2003; Tiengo et al. 2003; Watson et al. 2002a, b) which then slowed markedly in the afterglow phase. This lightcurve is reminiscent of the optical lightcurves of GRBs 990123 and 021211, where a rapid decline was observed initially ( day), then a slower decay and finally a resteepening (Fruchter et al. 1999; Castro-Tirado et al. 1999; Li et al. 2003).
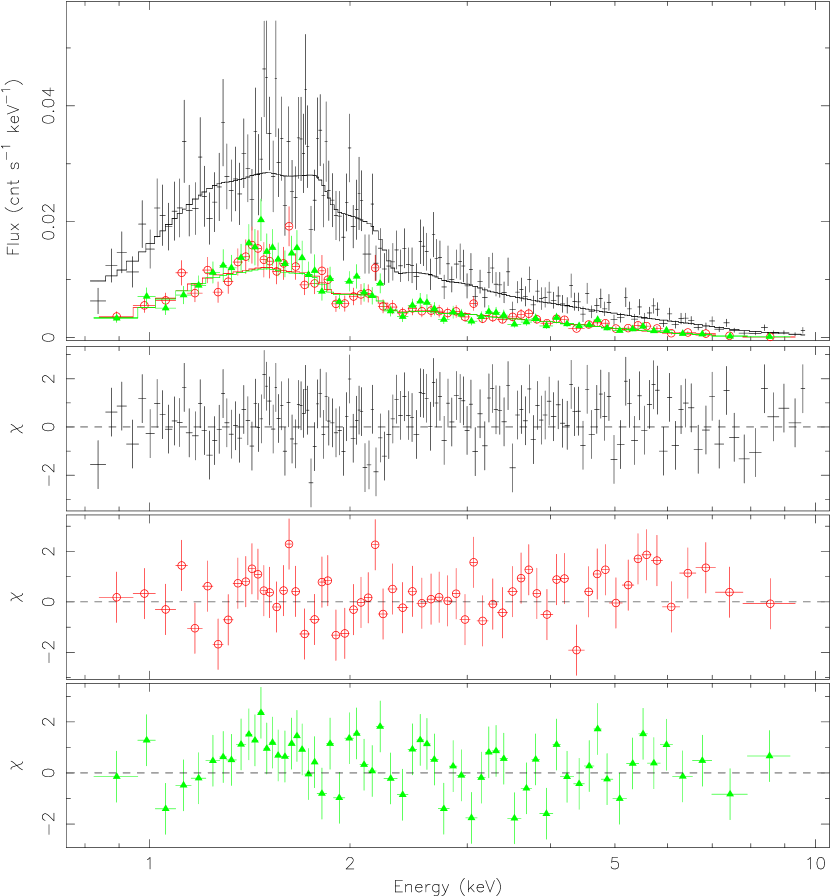
The complete spectra of the afterglow from the first and second observations and the five 11 ks spectra from the first observation can be fit with a power-law with absorption in excess of the Galactic value ( cm-2, Dickey & Lockman 1990). The best-fit power-law photon indices () are and for the first and second observations respectively when the absorption was fixed to that found for the combined fit to the dust echo and the afterglow spectra ( cm-2, Vaughan et al. 2003). The absorption is consistently above the Galactic column density, but this may be due to variations in the local column density on scales (Dickey & Lockman 1990). The observed, time-averaged fluxes are erg cm-2 s-1 and erg cm-2 s-1.
4. A low luminosity burst at
No optical afterglow was detected for this burst; the upper limit on the flux of the transient based on an extrapolation of the X-ray power-law at day (), is mag, including a reddening correction of A mag. Given the brightness of the underlying galaxy ( mag, Bailyn et al. 2003) a source with observed mag seems unlikely to be detected. The non-detection of the optical afterglow makes the association of the GRB with the star-forming galaxy at uncertain since we do not have a redshift associated with the afterglow. The X-ray observations strengthen this association. The X-ray position is the best localisation available and places the GRB within kpc of the centre of the galaxy; the probability (based on the I-band galaxy counts of Postman et al. (1998) and neglecting gravitational lensing and extragalactic absorption) of the centre of a galaxy at least this bright appearing coincident with the XMM-Newton position by chance is low, . The probability of the centre of any galaxy being detected (assuming a limiting I-band magnitude of 23) within 0.7″radius is only 0.004.
At a luminosity distance of 453 Mpc, GRB 031203 is the closest GRB/XRF with known redshift after GRB 980425. This distance implies that the -ray burst energy and afterglow luminosity were very low compared to cosmological GRBs (Soderberg et al. 2003b).
Mereghetti & Gotz (2003) quote a peak 20–200 keV photon flux for GRB 031203 of 1.2 cm-2 s-1 and a duration of s. For the following calculations we use an estimate of the mean flux of one third the peak flux (Hakkila et al. 2000) to derive a photon fluence of 12 cm-2. We also use a power-law index for the burst, justified below (§ 5).
The equivalent isotropic -ray energy (20–2000 keV rest-frame) is only erg, well below the total -ray energy in the general case ( erg, Bloom et al. 2003c), but a few times greater than XRF 020903 (Sakamoto et al. 2003) and times that of GRB 980425 (Pian et al. 2000). The peak radio luminosity is often used as a surrogate for the total burst energy; GRB 031203’s radio luminosity after 4 days (Frail 2003) is very low, but within a factor of three of GRB 980425/SN1998bw at the same time (Kulkarni et al. 1998; Soderberg et al. 2003a), indicating that it may have an unusually low peak radio luminosity. The X-ray luminosity for GRB 031203 is also low Soderberg et al. (2003b). Even the isotropic equivalent luminosity based on the observed 2–10 keV flux is erg s-1 at 10 hours, more than three orders of magnitude below the typical value ( erg s-1) (Berger, Kulkarni, & Frail 2003), though a factor of above GRB 980425 (Pian et al. 2000).
5. GRB 031203 as an X-ray flash
The photon power-law index from the 0.2–10.0 keV photon fluence (estimated from the dust echo) to the 20–200 keV photon fluence is . Furthermore, a power-law fit to the dust echo, corrected for the effects of the dust scattering, yields an intrinsic . A single power-law (with ) from 1 to 200 keV is consistent with these numbers: in this case the of the burst must be below 1 keV, a remarkably low even for an XRF. They are also consistent with a power-law index that steepens between the soft (0.2–10.0 keV) and hard (20–200 keV) X-ray bands, with probably below the 20–200 keV band. It is likely that the of GRB 031203 was keV. Dar (2003) predicted for this burst close to 20 keV based on the cannon-ball model; we cannot exclude this possibility. In any case, GRB 031203 is an XRF; the ratio used to define XRFs, , is in this case, an extreme value (compare XRF 020903 with a ratio of 0.7, Sakamoto et al. 2003), assuming a single power-law in the 2–400 keV band.
We assume above that the fluence observed in the X-ray halo is due entirely to the burst event. Some fraction will, of course, be contributed by the afterglow, since the time of the observed X-ray fluence is only constrained to hour of the burst. To quantify this, we derive the maximum afterglow contribution to the fluence (where the afterglow flux starts at the mean burst flux and decays without a break to the flux observed at the start of the XMM-Newton observations). This depends on the mean flux of the burst and therefore on the burst duration. The afterglow contributes % of the total fluence when the burst duration is 30 s. Even at 60% GRB 031203 is still an XRF, with , within the uncertainty mentioned above. The contribution of the afterglow to the observed soft X-ray fluence cannot influence the classification of GRB 031203 as an XRF. In order for GRB 031203 not to be an XRF, a very large fraction of the fluence would have to be significantly earlier or later than the hard X-ray burst and (somewhat arbitrarily) renamed a “precursor” or a “rebrightening”, with a total energy comparable to the burst itself.
INTEGRAL’s SPI-ACS detected GRB 031203; the count-rate is not inconsistent with that expected from the fluence and spectral slope mentioned above (von Kienlin et al. 2003). If the ratio of peak count-rate to mean count-rate (Prochaska et al. 2004) in the IBIS band (20-200 keV) is the same as in SPI-ACS band ( keV), then the total 20-200 keV fluence estimated above will be smaller by a factor 3.2, making GRB 031203 the most extreme XRF ever observed, with . An analysis of all the INTEGRAL data will be interesting since the quoted peak flux for the burst ( erg cm-2 s-1 in the 20-200 keV band) implies a much harder spectrum during the peak (), indicating strong spectral evolution. This has no impact on our calculations above since they are based on the total fluences in the burst, derived from the count-rates only, not the peak flux.
A tantalising result we can compute is an approximate upper limit on the pseudo-z (, Atteia 2003) using keV, and s, for which we find .
6. Discussion
Amati et al. (2002) have found a relation between the equivalent isotropic -ray total energy () and in GRBs. Though only a single burst, the low luminosity XRF 020903 has extended this relation to very low luminosities and peak energies (Sakamoto et al. 2003). Using the best-fit values for this relation quoted by Sakamoto et al. (2003), and the equivalent isotropic luminosity in the 1 keV–10 MeV band derived here ( erg), the of GRB 031203 should lie close to keV; this is consistent with the suggested above and further confirms the correlation between peak energies and .
One implication of this correlation is clear; XRFs have low as we see here. Furthermore, if the total energy in -rays is nearly constant at erg (Frail et al. 2001; Bloom et al. 2003c), it implies that the opening angle in XRFs is extremely wide. However, this becomes problematic if there is a significant population of XRFs with peak energies below keV, since the Amati et al. (2002) relation implies for these bursts is less than the total energy in -rays inferred by Frail et al. (2001). Only one XRF so far had clearly indicated this paradox; XRF 020903, mentioned above. But now GRB 031203 similarly shows a very low . (We note that it has been suggested that XRF 030723 also has a very low (Lamb et al. 2003b), but the redshift in that case is highly uncertain, Fynbo et al. 2004). These results hint that a significant population of (so far, rare) low luminosity bursts may indeed exist as required in some models of off-axis GRBs (e.g. Yamazaki et al. 2004).
It has been suggested (Bloom et al. 2003c) that a class of underluminous GRBs exist with fast decay rates (f-GRBs) at early times ( days). We cannot exclude GRB 031203 from such a class. Both its luminosity and decay rates are extraordinary, the luminosity is very low and the decay rate unusually slow, but there must be a fast decay in the afterglow before the XMM-Newton observation at days, if the prompt and afterglow fluxes decay smoothly and there is no abrupt drop in the flux between prompt and afterglow phases. GRB 980425, possibly similar in terms of its low luminosity, is also interesting as a comparison object in terms of its X-ray decay structure. GRB 980425 also showed a fast decay from the prompt X-ray flux (power-law index, ) and a very slow decay in X-rays from 1 to 100 days (). In XRF 030723 a very slow decay was observed at optical wavelengths at early times (Fynbo et al. 2004): perhaps very slow early decay rates are related to the apparent luminosity and of the burst lending some support to the idea that these bursts may be viewed off-axis (Granot et al. 2002; Yamazaki et al. 2004).
References
- Amati et al. (2002) Amati, L., et al. 2002, A&A, 390, 81
- Atteia (2003) Atteia, J.-L. 2003, A&A, 407, L1
- Bailyn et al. (2003) Bailyn, C., Van Dokkum, P., Buxton, M., Cobb, B., & Bloom, J. S. 2003, GRB Coordinates Network Circular, 2486
- Barraud et al. (2003) Barraud, C., et al. 2003, A&A, 400, 1021
- Berger et al. (2003) Berger, E., Kulkarni, S. R., & Frail, D. A. 2003, ApJ, 590, 379
- Bloom et al. (2003a) Bloom, J. S., Bailyn, C., Buxton, M., Cobb, B., van Dokkum, P., & Gonzalez, D. 2003a, GRB Coordinates Network Circular, 2481
- Bloom et al. (2003b) Bloom, J. S., Fox, D., van Dokkum, P. G., Kulkarni, S. R., Berger, E., Djorgovski, S. G., & Frail, D. A. 2003b, ApJ, 599, 957
- Bloom et al. (2003c) Bloom, J. S., Frail, D. A., & Kulkarni, S. R. 2003c, ApJ, 594, 674
- Butler et al. (2003) Butler, N. R., Marshall, H. L., Ricker, G. R., Vanderspek, R. K., Ford, P. G., Crew, G. B., Lamb, D. Q., & Jernigan, J. G. 2003, ApJ, 597, 1010
- Castro-Tirado et al. (1999) Castro-Tirado, A. J., et al. 1999, Sci, 283, 2069
- Dar (2003) Dar, A. 2003, GRB Coordinates Network Circular, 2485
- Dickey & Lockman (1990) Dickey, J. M., & Lockman, F. J. 1990, ARA&A, 28, 215
- Fox et al. (2004) Fox, D. B., Soderberg, A. M., Kulkarni, S. R., & Frail, D. 2004, GRB Coordinates Network Circular, 2522
- Frail (2003) Frail, D. A. 2003, GRB Coordinates Network Circular, 2473
- Frail et al. (2001) Frail, D. A., et al. 2001, ApJ, 562, L55
- Frontera et al. (2000) Frontera, F., et al. 2000, ApJS, 127, 59
- Fruchter et al. (1999) Fruchter, A. S., et al. 1999, ApJ, 519, L13
- Fynbo et al. (2004) Fynbo, J. P. U., et al. 2004, astro-ph/0402240
- Galama et al. (1998) Galama, T. J., et al. 1998, Nat, 395, 670
- Götz et al. (2003) Götz, D., Mereghetti, S., Beck, M., Borkowski, J., & Mowlavi, N. 2003, GRB Coordinates Network Circular, 2459
- Granot et al. (2002) Granot, J., Panaitescu, A., Kumar, P., & Woosley, S. E. 2002, ApJ, 570, L61
- Hakkila et al. (2000) Hakkila, J., Haglin, D. J., Pendleton, G. N., Mallozzi, R. S., Meegan, C. A., & Roiger, R. J. 2000, ApJ, 538, 165
- Heise et al. (2001) Heise, J., in’t Zand, J., Kippen, R. M., & Woods, P. M. 2001, in Gamma-ray Bursts in the Afterglow Era, 16
- Hjorth et al. (2003) Hjorth, J., et al. 2003, Nat, 423, 847
- Hsia et al. (2003) Hsia, C. H., Lin, H. C., Huang, K. Y., Urata, Y., Ip, W. H., & Tamagawa, T. 2003, GRB Coordinates Network Circular, 2470
- Kulkarni et al. (1998) Kulkarni, S. R., et al. 1998, Nat, 395, 663
- Lamb et al. (2003a) Lamb, D. Q., Donaghy, T. Q., & Graziani, C. 2003a, astro-ph/0312634
- Lamb et al. (2003b) Lamb, D. Q., et al. 2003b, astro-ph/0310414
- Li et al. (2003) Li, W., Filippenko, A. V., Chornock, R., & Jha, S. 2003, ApJ, 586, L9
- Mereghetti et al. (2003) Mereghetti, S., Götz, D., Borkowski, J., Walter, R., & Pedersen, H. 2003, A&A, 411, L291
- Mereghetti & Gotz (2003) Mereghetti, S., & Gotz, D. 2003, GRB Coordinates Network Circular, 2460
- Pian et al. (2000) Pian, E., et al. 2000, ApJ, 536, 778
- Postman et al. (1998) Postman, M., Lauer, T. R., Szapudi, I., & Oegerle, W. 1998, ApJ, 506, 33
- Preece et al. (2000) Preece, R. D., Briggs, M. S., Mallozzi, R. S., Pendleton, G. N., Paciesas, W. S., & Band, D. L. 2000, ApJS, 126, 19
- Prochaska et al. (2004) Prochaska, J. X., et al. 2004, astro-ph/0402085
- Rodriquez-Pascual et al. (2003) Rodriquez-Pascual, P., Santos-Lléo, M., Gonzalez-Riestra, R., Schartel, N., & Altieri, B. 2003, GRB Coordinates Network Circular, 2474
- Sakamoto et al. (2003) Sakamoto, T., et al. 2003, astro-ph/0309455
- Soderberg et al. (2003a) Soderberg, A. M., et al. 2003a, astro-ph/0311050
- Soderberg et al. (2003b) Soderberg, A. M., Kulkarni, S. R., & Frail, D. A. 2003b, GRB Coordinates Network Circular, 2483
- Stanek et al. (2003) Stanek, K. Z., et al. 2003, ApJ, 591, L17
- Tedds et al. (2003) Tedds, J. A., et al. 2003, GRB Coordinates Network Circular, 2490
- Tedds & Watson (2002) Tedds, J. A., & Watson, M. G. 2002, in New Visions of the X-Ray Universe in the XMM-Newton and Chandra Era, ed. F. Jansen (ESA SP-488)
- Tiengo et al. (2003) Tiengo, A., Mereghetti, S., Ghisellini, G., Rossi, E., Ghirlanda, G., & Schartel, N. 2003, A&A, 409, 983
- Vaughan et al. (2003) Vaughan, S., et al. 2003, astro-ph/0312603
- von Kienlin et al. (2003) von Kienlin, A., Arend, N., Lichti, G. G., Strong, A., & Connell, P. 2003, astro-ph/0302139
- Watson et al. (2003) Watson, D., Reeves, J. N., Hjorth, J., Jakobsson, P., & Pedersen, K. 2003, ApJ, 595, L29
- Watson et al. (2002a) Watson, D., Reeves, J. N., Osborne, J., O’Brien, P. T., Pounds, K. A., Tedds, J. A., Santos-Lléo, M., & Ehle, M. 2002a, A&A, 393, L1
- Watson et al. (2002b) Watson, D., Reeves, J. N., Osborne, J. P., Tedds, J. A., O’Brien, P. T., Tomas, L., & Ehle, M. 2002b, A&A, 395, L41
- Yamazaki et al. (2004) Yamazaki, R., Ioka, K., & Nakamura, T. 2004, astro-ph/0401142