XMM-Newton observations of the M31 northern disk: Properties of selected X-ray sources and diffuse emission.
Abstract
We present the results of XMM-Newton survey of the northern part of the disk of M31. The results of a spectral and timing analysis of the thirty seven brightest sources are presented. Combining the results of X-ray analysis with available data at other wavelengths, we were able to classify , or 19 out of 37 sources.
Two sources in our sample were previously unknown: the hard X-ray source XMMU J004415.8+413057 and a transient supersoft source XMMU J004414.1+412206. We report the discovery of possible X-ray pulsations from the source XMMU J004415.8+413057 with a period of 197 s. The spectral and timing properties of XMMU J004415.8+413057 make it first accreting X-ray pulsar candidate detected in M31.
We found six X-ray sources to be coincident with M31 globular cluster (GC) candidates. The spectral properties of GC sources were found to be similar to that of the bright Galactic low mass X-ray binaries located in the bulge and globular clusters. The comparison of the X-ray properties of GC sources with optical properties of their host globular clusters has shown that the brightest sources with luminosity, above ergs s-1 tend to reside in more metal poor clusters.
Three X-ray sources were identified with SNR based on their X-ray spectra and positional coincidence with SNR candidates from optical and radio surveys. We found five bright X-ray sources to coincide with Galactic foreground stars. Two of them demonstrate a remarkable variability of X-ray flux on a time scale of individual XMM-Newton observations. Two X-ray sources coincide with radio sources and are probably distant radio galaxies/AGN.
The properties of the remaining 18 bright X-ray sources detected in our survey are consistent with AGN in the background of M31 and X-ray binaries belonging to M31. Many of them show high values of low-energy absorption, which combined with extreme faintness of their possible optical counterparts makes them an obscured AGN candidates.
We report on the first unambiguous detection of the soft unresolved X-ray emission
from the disk of M31. The unresolved emission follows the pattern of the spiral arms
and can be traced up to distance of ( kpc at 760 kpc) from
the center of the galaxy. The spectrum of the unresolved emission shows dominant soft
thermal component which can be fitted with a keV optically thin thermal
plasma emission models. We suggest that significant part of this diffuse soft X-ray
component may represent hot diffuse gas in the spiral arms of M31 and emission from
normal stars in the disk of M31.
Subject headings: galaxies: individual (M31) — X-rays: galaxies — X-rays: stars
1. INTRODUCTION
The Andromeda Galaxy (M31), the closest spiral galaxy to our own (760 kpc; van der Bergh 2000), is a unique object for the study of X-ray astronomy. M31 is in many respects similar to the Milky Way and even called its “twin sister”. M31 hosts hundreds of X-ray sources, which are observed at a nearly uniform distance, and due to the favorable orientation of the M31, they are less obscured by interstellar gas and dust than those in the Galaxy. M31 was observed extensively with Einstein, ROSAT, Chandra and XMM-Newton missions, detected hundreds of X-ray sources, identified with different types of X-ray emitting objects (Trinchieri & Fabbiano (1991); Primini et al. (1993); Supper et al. 1997, 2001; Kong et al. (2002); Shirey et al. (2001)). Although the central part of M31 was subject to deep X-ray surveys, the outer disk of the galaxy was covered by observations with relatively low sensitivity (Williams et al. (2003)).
In this paper we present the results from the deep XMM-Newton observations of the northern parts of the disk of M31. We concentrate on the spectral and timing analysis of a selected sample of 37 bright X-ray sources. We also report on the first unambiguous detection of the diffuse X-ray emission associated with disk of M31.
2. OBSERVATIONS AND DATA ANALYSIS
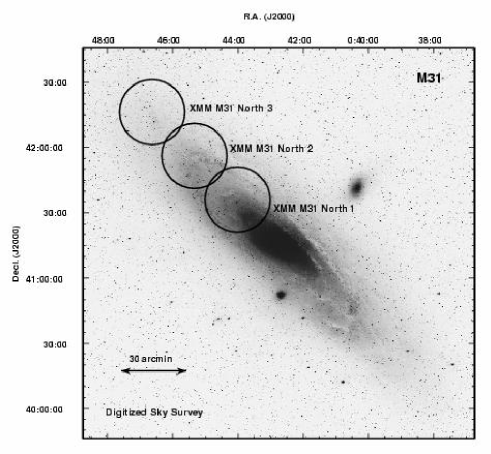
Three regions of the northern part of galactic disk of M31 were observed with XMM-Newton on January 5 (Obs. )(Trudolyubov et al. 2002a ), January 26 (Obs. ), and June 29, 2002 (Obs. ) as a part of the Guaranteed Time Program (PI: K. O. Mason) (Table 1, Figure 1). The 2002, January 6 XMM-Newton observation of the central part of M31 (Trudolyubov et al. 2002b ) (Obs. ) provides additional coverage of the inner disk. In the following analysis we use the data from three European Photon Imaging Camera (EPIC) instruments: two EPIC MOS detectors (Turner et al. (2001)) and the EPIC-pn detector (Strueder et al. (2001)). In the first three observations EPIC instruments were operated in the full window mode ( FOV) with the medium optical blocking filter. In the Obs. a combination of the full window mode and thin optical blocking filter was used.
We reduced EPIC data with the XMM-Newton Science Analysis System (SAS v 5.3) 111See http://xmm.vilspa.esa.es/user. We performed standard screening of the EPIC data to exclude time intervals with high background levels.
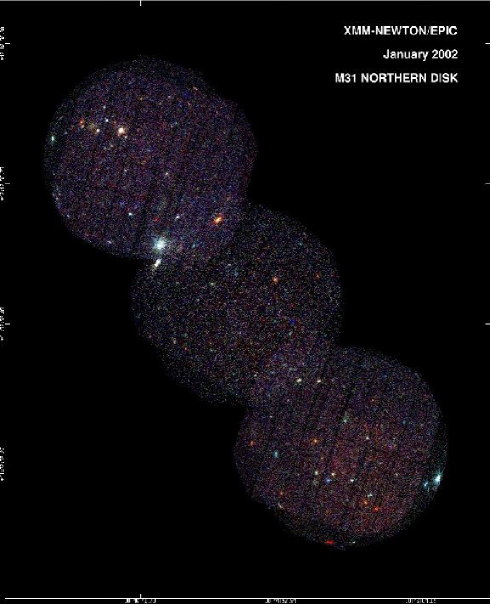
Images in celestial coordinates with a pixel size of 2 have been accumulated in the , , and keV energy bands for the EPIC-MOS1, MOS2 and pn detectors. We produced a three-color image of the northern disk regions of M31 combining the images in the (soft), (medium) and keV (hard) energy bands and using red, green and blue color scales to represent the X-ray intensities in these bands (Fig. 1). The spectral energy distribution of the source defines its color in this image. The sources with soft X-ray spectra (i.e. supersoft sources, thermal supernova remnants and Galactic foreground stars) appear in red, while sources with hard spectra are blue.
X-ray sources were detected with program based on a wavelet decomposition algorithm, set at a threshold. For our current analysis, we expect error in the source position determination to be dominated by residual systematic error of the order . We corrected the count rates of the sources for the vignetting of the XMM telescope, based on the Current Calibration Files provided with SAS.
We studied the spectral and timing properties of all X-ray sources in our sample. Each source in our sample provided between 300 and 18000 counts in EPIC detectors allowing high quality spectroscopic and timing analysis.
To generate lightcurves and spectra of X-ray sources, we used elliptical extraction regions with semi-axes size of (depending on the distance of the source from the telescope axis) and subtracted as background the spectrum of adjacent source-free regions with subsequent normalization by a ratio of the detector areas. We used data in the keV energy band because of the uncertainties in the calibration of the EPIC instruments outside this range. All fluxes and luminosities derived from spectral analysis apply to this band, unless specified otherwise. For the sources with soft (Galactic foreground stars, SNR candidates) and supersoft X-ray spectra we considered only the and keV spectral ranges, since their flux was negligible above 3.0 and 1.0 keV respectively. We used spectral response files generated by XMM SAS tasks. Spectra were grouped to contain a minimum of 20 counts per spectral bin in order to allow statistics and fit to analytic models using the XSPEC v.11222http://heasarc.gsfc.nasa.gov/docs/xanadu/xspec/index.html fitting package (Arnaud (1996)). EPIC-pn, MOS1 and MOS2 data were fitted simultaneously, but with normalizations varying independently.
Fourier power density spectra (PDS) were produced using the lightcurves in the keV energy band. Then we performed folding analysis in the vicinity of the frequency peaks identified from PDS. We used standard XANADU/XRONOS v.5 333http://heasarc.gsfc.nasa.gov/docs/xanadu/xronos/xronos.html tasks to perform analysis of the timing properties of bright X-ray sources.
In the following analysis we assume a source distance of 760 kpc (van den Bergh 2000).
3. SELECTED X-RAY SOURCES: IDENTIFICATION AND CLASSIFICATION
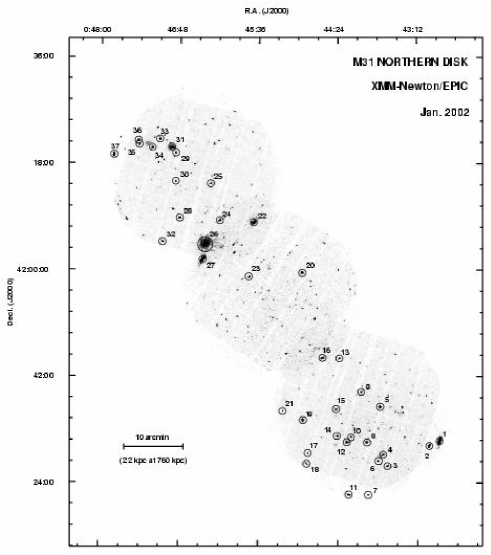
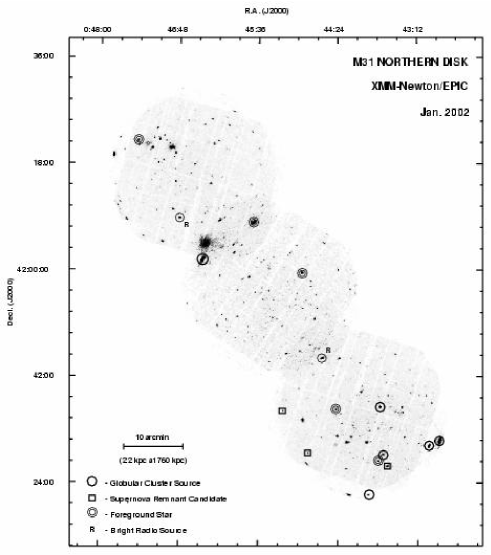
Using the procedure described above, we detected about 300 X-ray point sources in the three XMM M31 northern disk fields. The complete X-ray source catalog will be presented in a follow-up paper. Here we study a sample of 37 sources selected on the basis of their brightness; each individual source was required to have more than 300 counts in the EPIC. The information on the positions and identifications of the selected X-ray sources is shown in Table 2. The X-ray images of the northern disk regions of M31 with source positions marked are shown in Fig. 2.
We searched for optical, infrared and radio counterparts to the bright XMM sources in the northern disk of M31 using the existing catalogs and images from the CTIO/KPNO Local Group Survey (LGS) (Massey et al. (2001)) and the Second Generation Digitized Sky Survey. We varied the search radius based on both the accuracy of the catalogs and localization errors of XMM sources (upper limit of ). We used the following catalogs and corresponding search radii:
i) X-ray sources: the ROSAT/PSPC catalog of sources in the field of M31 (Supper et al. 1997, 2001) (SHP97,SHP01) – search radius specified by position accuracy for each individual source. All but five bright XMM sources were detected in the ROSAT/PSPC survey of M31 (Table 2).
ii) Globular cluster candidates: the Bologna catalog (Battistini et al. (1987)), the catalog by Magnier (1994), and the HST globular cluster candidate catalog (Barmby & Huchra (2001)) – with search radius of .
iii) Supernova remnant candidates: the lists by Braun & Walterbos (1993) and Magnier et al. (1995) – search radius.
iv) Stellar objects (Galactic foreground stars/background AGN): the catalogs of stellar objects by Magnier et al. (1992) and Haiman et al. (1994) and SIMBAD – search radius.
v) Radio sources: VLA All-sky Survey Catalog 444http://www.cv.nrao.edu/nvss/ (Condon et al. (1998))– search radius.
Inspection of optical images to search for uncatalogued bright star-like objects revealed no additional foreground star candidates. X-ray source , however, is very likely a background galaxy based on the shape of its counterparts in the LGS and DSS images.
4. BRIGHT X-RAY SOURCES DISCOVERED WITH XMM-NEWTON
4.1. X-ray pulsar candidate XMMU J004415.8+413057
The X-ray source XMMU J004415.8+413057 was discovered with XMM-Newton in the 2002 January 5 observation (Trudolyubov et al. 2002a ). As the source falls into a CCD gap in both EPIC-MOS detectors, we present the analysis of the source properties based on the EPIC-pn data alone. The spectrum of XMMU J004415.8+413057 is remarkably hard and heavily absorbed at low energies (Fig. 3). The analytic approximation of the spectrum with an absorbed simple power law model gives a photon index of 1.4 and requires an absorbing column of cm-2 (Table 3; Fig. 3). The corresponding absorbed keV luminosity of the source was ergs s-1.
The X-ray source XMMU J004415.8+413057 shows a significant variability on a time scales of several years. It was not detected in the previous observations with Einstein and ROSAT. Using the data of archival 1996, July 7 deep ROSAT/HRC observation, and assuming the same spectral shape as measured with XMM, we estimate a upper limit to the source luminosity of ergs s-1. This implies that XMMU J004415.8+413057 was at least a factor of 4 fainter during ROSAT observation in July 1996.
The analysis of the timing properties of XMMU J004415.8+413057 revealed probable coherent pulsations of the X-ray flux with a period of 197.19(5) s (Fig. 4a,b). We estimated statistical significance of the corresponding peak in the source PDS. The probability that any one of the 1300 frequency bins in the PDS would have a noise value exceeding the power level of this peak is (Vaughan et al. (1994)). Figure 4d shows EPIC-pn light curve of XMMU J004415.8+413057 folded on the 197.19 s best period of the pulsation. The pulse profile shows a nearly sinusoidal form with flux modulation.
Another feature of the source PDS is a group of frequency peaks corresponding to the s slow modulation (Fig. 4a,c). Figure 4e shows EPIC-pn light curve of XMMU J004415.8+413057 folded on the 5900 s period of this modulation.
In order to investigate the energy dependence of the 197-s pulsations, we constructed light curves in the and keV energy bands folded on the best period (Fig. 5). The energy-resolved pulse profiles show marginal differences between the soft and hard energies with excess of the hard emission at phase .
Together with the X-ray spectrum, probable 197-s pulsations strongly support the identification of XMMU J004415.8+413057 as a first accreting pulsar candidate in M31 and possible HMXB. The extreme level of low energy absorption in the spectrum (at least 10 times Galactic foreground value) could be consistent with absorption within HMXB system or source location in the region with high density of the neutral gas (e.g. molecular cloud). The -s modulation of the X-ray flux could be manifestation of some instability time scale of the accretion flow in this system. A significant variability of the the source on a time scales of several years could imply possible transient/recurrent nature of the source.
4.2. Supersoft X-ray transient XMMU J004414.1+412206
The supersoft X-ray transient source XMMU J004414.1+412206 was discovered on 2002 January 5 using XMM (Trudolyubov et al. 2002a ). The XMM discovery was confirmed by detection of the source with Chandra during Jan. 8 and 16, 2002 observations (Garcia et al. (2002)). The search for the optical counterparts did not yield any object brighter than within XMM and Chandra source error boxes. The X-ray luminosity of XMMU J004414.1+412206 declined from ergs s-1 on Jan. 5 to ergs s-1 on Jan. 8 (Garcia et al. (2002)) for an assumed distance of 760 kpc. The energy spectra of the source obtained with XMM-Newton/EPIC-MOS1 and MOS2 detectors on January 5 are shown in Figure 3. The approximation of the EPIC-MOS spectra with the absorbed blackbody radiation model gives a characteristic temperature of eV and a relatively high absorbing column of cm-2 (Table 3; Figure 3).
The energy spectrum of XMMU J004414.1+412206 is typical for a supersoft X-ray sources, AM Her systems, isolated white dwarfs and X-ray dim neutron stars. Its luminosity of ergs s-1 for a distance of 760 kpc is too high to originate from an AM Her system in M31 (Ramsay et al. (1994)). On the other hand, the transient behavior of the object poses a serious problem for a foreground isolated white dwarf or a neutron star identification. The absence of the bright optical objects in the error box of XMMU J004414.1+412206 excludes an explanation as an AM Her system located within our Galaxy.
The remaining possibility is that XMMU J004414.1+412206 is similar to the Galactic supersoft sources. Then its X-ray emission may be interpreted as a result of thermonuclear burning of the accreted matter on the surface of the white dwarf (see Kahabka & van den Heuvel (1997) for a review). The transient behavior of the source hints that it may be a classical Nova in the supersoft X-ray spectral phase, several tens of days after the peak of the outburst (Kahabka & van den Heuvel 1997). The X-ray source XMMU J004414.1+412206 is the fourth bright supersoft transient detected in M31.
5. GLOBULAR CLUSTER CANDIDATES
The positions of six bright X-ray sources are consistent with globular cluster candidates in M31 (Table 2). We performed a detailed study of their spectral and temporal properties using the data of XMM-Newton observations.
5.1. Spectral properties
The spectra of globular cluster candidates were fitted with a variety of spectral models using XSPEC v11. The results of fitting these models to the source spectra are given in Table 4. The spectra of all these objects are relatively hard (Fig. 6) and can be generally described by an absorbed simple power law model with photon index of and an equivalent absorbing column of cm-2 (Table 4). The corresponding isotropic luminosities of the XMM globular cluster sources differ by almost two orders of magnitude and fall between and ergs s-1 in the keV energy band, assuming a distance of 760 kpc. The Galactic hydrogen column in the direction of M31 is about cm-2 (Dickey & Lockman (1990)); thus within measurement errors our results are consistent with additional absorption due to the interstellar matter in M31 and within the system.
For the three bright sources with luminosities above ergs s-1, XMMU J004251.9+413107, XMMU J004301.4+413017 and XMMU J004627.0+420151 models with quasi-exponential cut-off at keV describe the energy spectra significantly better than a simple power law (Table 4; Fig. 6). We used a power law with exponential cut-off and Comptonization models to approximate the spectra of these sources (Table 4).
For the Comptonization model approximation, we used the XSPEC model COMPTT (Sunyaev Titarchuk (1980); Titarchuk (1994); Titarchuk & Lyubarskij (1995)). This model includes a self-consistent calculation of the spectrum produced by the Comptonization of the soft photons in a hot plasma. It contains as free parameters the temperature of the Comptonizing electrons, , the plasma optical depth with respect to the electron scattering, and the temperature of the input Wien soft photon distribution, . A spherical geometry was assumed for the Comptonizing region.
The spectra of many luminous Galactic LMXB are well fit with a two component model consisting of a black body-like component which might represent emission from an optically thick accretion disk or from the neutron star surface, together with a Comptonized component which may be interpreted as emission from a hot inner disk region or a boundary layer between the disk and a neutron star. We used such a two-component model to approximate spectra of the brightest globular cluster source, XMMU J004251.9+413107. For the soft component we used disk-blackbody component (Mitsuda et al. (1984)). This model has two parameters, the effective radius, , where is the inner radius of the disk, is the inclination angle of the disk and is the maximum effective temperature in the disk. For the Comptonized component the XSPEC model COMPTT described above was used. The best-fit parameters of the model are shown in Table 5.
The spectral properties of the bright GC X-ray sources detected in the XMM observations of the northern disk regions of M31 are similar to that of the bright Galactic low mass X-ray binaries located in the bulge and globular clusters (Sidoli et al. (2001); Iaria et al. (2001); DiSalvo et al. (2001)). Two out of total six GC X-ray sources in our sample were found to have X-ray luminosities exceeding ergs s-1, making them brighter than any known Galactic GC X-ray source.
5.2. Variability
The comparisons based on the broad-band spectral properties are not sufficient to establish a neutron star nature or rule out a black hole nature for the M31 globular cluster sources. On the other hand, the study of their short-term variability can provide a definitive answer, if Type I X-ray bursts or X-ray pulsations are observed. We searched for both types of variability in the M31 GC data. Unfortunately, the observed source count rates for most sources are too low to probe timescales shorter than seconds. We did not find evidence of X-ray pulsations or short X-ray bursts in XMM-Newton data.
5.3. Correlation between X-ray and optical properties
We used the results of optical observations of M31 GC candidates (Huchra, Brodie & Kent (1991); Barmby et al. (2000); Perrett et al. (2002)) to study how the properties of the X-ray sources depend on the overall properties of the globular clusters hosting them.
The Galactic globular clusters hosting bright LMXBs were found to be both denser and more metal-rich (Sidoli et al. (2001)). We studied the effect of globular cluster metallicity on the luminosity of the M31 GC sources from our sample. The resulting dependence is shown in Fig. 7 (left panel). The tendency of the brightest sources to reside in the more metal poor clusters ([Fe/H]) is obvious. This behavior seems to be in general disagreement with possible correlation between the metallicity and X-ray luminosity found for the bright Galactic GC sources (Sidoli et al. (2001)). The limited statistics of our sample (5 M31 GC X-ray sources) does not allow us to draw conclusions on the applicability of our results to the whole M31 globular cluster X-ray source population.
6. SUPERNOVA REMNANTS
There are three SNR candidates in the lists by Braun & Walterbos (1993) and Magnier et al. (1995) coincident with bright XMM sources (sources 3, 17 and 21 in Table 2). All three sources were previously detected with ROSAT/PSPC and HRI and identified as SNR (Supper et al. 1997, 2001; Magnier et al. (1997)).
The energy spectra of these 3 SNR candidates are shown in Fig. 8. We fitted the spectra of SNR candidates with various single component spectral models including a simple power law, thermal bremsstrahlung, black body, Raymond-Smith thermal plasma (RS) (Raymond & Smith (1977)), and non-equilibrium ionization collisional plasma (NEI) models with interstellar absorption. The results of the analytical approximation of the XMM/EPIC-pn data for SNR candidates are shown in Table 6.
RS and NEI models are often used to study X-ray emission from supernova remnants. These models give the best approximation to the data for two SNR candidate sources 3 and 21, which show clear presence of the emission lines in their spectra (Fig. 8; Table 6).
XMMU J004339.1+412654 () Except for the RS and NEI models, other simple spectral models do not provide acceptable fits to the data (/). For the RS and NEI models, we first fixed the abundances at solar value (Anders & Grevesse (1989)). This set of parameters, however, left bump-like residuals indicating that we had overestimated the contribution from O-K, Ne-K and Fe-L shell emission lines. Then we fixed the abundances based on the values determined from optical spectroscopy of the optical counterpart to XMMU J004339.1+412654 (BW57 in Table 2) (Blair et al. (1982)): [N/H]=, [O/H]=, [S/H]= and [Ne/H]=, corresponding to 0.98, 0.44, 0.57 and 1.00 solar abundance. The Fe abundance was fixed at solar value. Finally, for the RS model we allowed the O, Ne and Fe abundances to be free parameters. The fit improved slightly. The best-fit values of the parameters for the approximation of XMMU J004339.1+412654 spectrum with the RS and NEI models are listed in Table 6. Depending on the type of model and a set of model parameters (Table 6), the estimated corresponding absorbed luminosity of XMMU J004339.1+412654 in the keV energy band lies in the range of ergs s-1.
XMMU J004451.1+412907 () Due to the limited statistics, both RS and simple power law models provide satisfactory approximation to the spectrum of the fainter SNR candidate source XMMU J004451.1+412907 (Fig. 8). Although the EPIC-pn spectrum of XMMU J004451.1+412907 can be fitted well with RS model with free elemental abundances, we were unable to obtain meaningful constraints on the abundances. Therefore, we assume element abundances to be proportional to the solar values, reducing the number of free abundance parameters to one. The best-fit spectral parameters for the approximation of the spectrum of XMMU J004451.1+412907 with RS model are listed in Table 6. The corresponding X-ray luminosity in the keV energy band is ergs s-1. The absorbed power law model with photon index of , an equivalent hydrogen column of cm-2 and keV flux of ergs s-1 cm-2 also gives satisfactory approximation to the data () (Fig. 8).
XMMU J004513.9+413614 () We used RS model with interstellar absorption to approximate the spectrum of SNR candidate XMMU J004513.9+413614. We first fixed the element abundances at solar value (Anders & Grevesse (1989)). Then we fixed the abundances based on the values determined from optical spectroscopy of the optical counterpart to XMMU J004339.1+412655 (BW39 in Table 2) (Blair et al. (1982)): [N/H]=, [O/H]=, [S/H]= and [Ne/H]=, corresponding to 0.61, 0.53, 0.42 and 1.00 solar abundance, with the Fe abundance fixed at the solar value. Finally, we allowed the Fe abundance to vary freely. This fit, optimized with Fe at 0.18 solar, was by far the best (Fig. 8, panel c). The fit parameters are listed in Table 6. The estimated keV X-ray luminosity of XMMU J004513.9+413614 lies in the range of ergs s-1.
7. FOREGROUND STARS
We found 5 bright XMM sources to coincide with objects in the Magnier et al. (1992) and 2MASS catalogs of stars (Table 2) with X-ray spectral properties consistent with that of Galactic foreground stars (Supper et al. 1997; Haberl et al. (2003)). All these sources have soft X-ray spectra without significant emission above keV and occupy a distinctive area on the X-ray color-color diagram (Fig. 12). The energy spectra of bright sources identified with Galactic foreground stars are shown in Figure 9. To approximate their energy spectra, we used the model of the emission from the optically thin thermal plasma (XSPEC Raymond-Smith model, RS) with characteristic temperature between 0.6 and 0.8 keV and relatively low iron abundance of solar, corrected for the low energy absorption (Table 7). For all objects the absorbing column is well below the Galactic value in the direction of M31 (Table 7), further supporting identification as foreground stars. The X-ray spectra and optical properties of 3 of these sources suggest emission from late-type stars with active coronae, also consistent with colors of their optical counterparts.
Two sources, XMMU J004347.1+412745 () and XMMU J004540.5+420806 () demonstrate significant variability during 2002 Jan. 5 and Jun. 29 XMM observations. The X-ray lightcurves of these sources in the keV energy range are shown in Fig. 10.
The source XMMU J004347.1+412745 shows a dramatic change of the X-ray flux during 2002, Jan. 5 observation (obs. ). The source flux history can be described as a combination of a relatively smooth decline (source flux drops times in the first 23 ks of observation) and a number of irregular flares (Fig. 10).
The source XMMU J004540.5+420806 shows significant variability of X-ray flux during 2002, Jun. 29 XMM observation (obs. ). The source brightness changes with a peak flux level times higher than the low flux level (Fig. 10). It should be noted, that during the 2002, Jan. 26 XMM observation (obs. ) the X-ray flux of XMMU J004540.5+420806 appears to be remarkably stable.
8. RADIO SOURCES
The positions of the two bright XMM sources not identified as SNR candidates ( in Table 2) coincide with bright radio sources detected with VLA all-sky (Condon et al. (1998)) and earlier surveys. These two objects are most likely radio galaxies in the background of M31. Both sources have X-ray spectra presented by absorbed power laws with indices between 1.8 and 2.2, typical for this source class (Fig. 11; Table 8).
9. CLUSTER OF GALAXIES XMMU J004624.8+420420
One of the sources detected in the Obs. and , XMMU J004624.8+420420 ( in Table 2) was classified as distant cluster of galaxies based on its spatial extent and X-ray spectrum (Kotov, Trudolyubov & Vestrand (2003)). X-ray emission of the cluster is clearly detectable up to the radial distance of from its center. X-ray emission from the source was detected previously by ROSAT, and cataloged as RX J0046.4+4204 (Supper et al. (2001)), although it was not recognized as an extended object and a galaxy cluster. A joint spectral fit to the data of EPIC-MOS2 and pn cameras with the Raymond-Smith thermal model gives a temperature of a hot gas inside the cluster, keV. The X-ray spectrum of XMMU J004624.8+420420 shows prominent iron emission line indicating cluster redshift of . For a cosmological model with = 50 km s-1 Mpc-1, = 0.3 and = 0.7 we derive a bolometric luminosity of 1.6 erg/s (Kotov, Trudolyubov & Vestrand (2003)). We examined optical images of the cluster region and found a concentration of highly reddened galaxies coincident with the central part of XMMU J004624.8+420420, further supporting our interpretation. In addition, we found a relatively bright radio source NVSS J004625+420406 (Condon et al. (1998)) located only away from the emission center of XMMU J004624.8+420420, indicating that it might be radio galaxy belonging to the cluster.
10. POSSIBLE AGN AND OTHER UNIDENTIFIED SOURCES
The majority of the remaining 18 X-ray sources detected in our survey consists of AGN in the background of M31 or X-ray binaries belonging to the galaxy. For some of these sources there is a close stellar-like counterpart (sources ), indicating possible AGN origin. For the source a background galaxy is likely optical counterpart. The spectra of most of these objects are hard and can be represented by power laws with indices between 1.5 and 2.3 (Table 9). The corresponding values of the interstellar absorption inferred from their spectra are close to or well above expected Galactic value (Table 9). For some of these sources a high value of measured column density combined with very low brightness of the possible optical counterpart could be explained by AGN intrinsic obscuration. More reliable optical identifications of these obscured AGN candidates are needed to confirm or reject their AGN nature.
11. X-RAY COLOR-COLOR DIAGRAMS
In order to facilitate comparison between spectral properties of different source classes detected in our observations of the northern disk of M31, we constructed their X-ray color-color diagram. We calculated the total number of counts for each source using its corrected EPIC-pn spectra in three energy bands: the soft band ( keV), medium band ( keV) and hard band ( keV). Two X-ray colors were defined for each source as: (soft color) and (hard color), where and are the counts in soft, medium and hard bands respectively, and is the total number of source counts in the keV energy range.
Figure 12 shows the X-ray color-color diagram for bright X-ray sources detected in the XMM-Newton/EPIC-pn observations of the northern disk of M31. There are two distinct concentrations of sources in this diagram. The first group with includes intrinsically soft sources – SNR candidates and foreground stars. The other densely populated group includes harder sources: GCS, radio sources and unidentified sources (presumably background AGN and X-ray binaries in M31). The X-ray pulsar candidate (possible HMXB) demonstrates harder and much more absorbed spectrum, and lies at an extreme position with and .
Fig. 12 demonstrates that in most cases it is difficult to establish source type using X-ray color alone. Although it helps to outline the difference between sources with soft and hard spectra (like thermal supernova remnants and stars vs. typical high-mass X-ray binaries or black hole candidates in a hard state), it shows no difference between other physically different classes like, for example, X-ray binaries and Crab-like supernova remnants. The combination of low-energy absorption and limited instrument bandpass have significant effect on the source position on the color-color diagram (Di Stefano & Kong (2002); Prestwich et al. (2003)). For example, the source with intrinsically super-soft spectrum, if highly absorbed, can easily “migrate” to the region on the color diagram normally occupied by sources with much harder spectra (Di Stefano & Kong (2002)). Therefore, additional information, such as X-ray variability, luminosity and source counterparts at other wavelengths, is needed to classify the X-ray source.
12. DIFFUSE X-RAY EMISSION FROM THE DISK OF M31
Previous X-ray studies of M31 were mostly concentrated on the central region of the galaxy. They revealed the presence of the unresolved soft X-ray emission component in the bulge of M31 distinct from the emission of point-like sources (Primini et al. (1993); Shirey et al. (2001)). The situation with the outer disk of M31 is less clear. Previous observations were not sensitive enough or lacked spatial resolution to fully address a question of the existence of the diffuse X-ray component in the disk. Using the data of Einstein observations, Trinchieri Fabbiano (1991) found no requirement for a diffuse component after exclusion of the detected point-like sources. Based on the later observations with ROSAT/PSPC, West, Barber Folgheraiter (1997) report on a detection of a residual unresolved X-ray emission from the outer disk of M31. They conclude that the bulk of this emission could be attributed to the normal stars in the disk of M31.
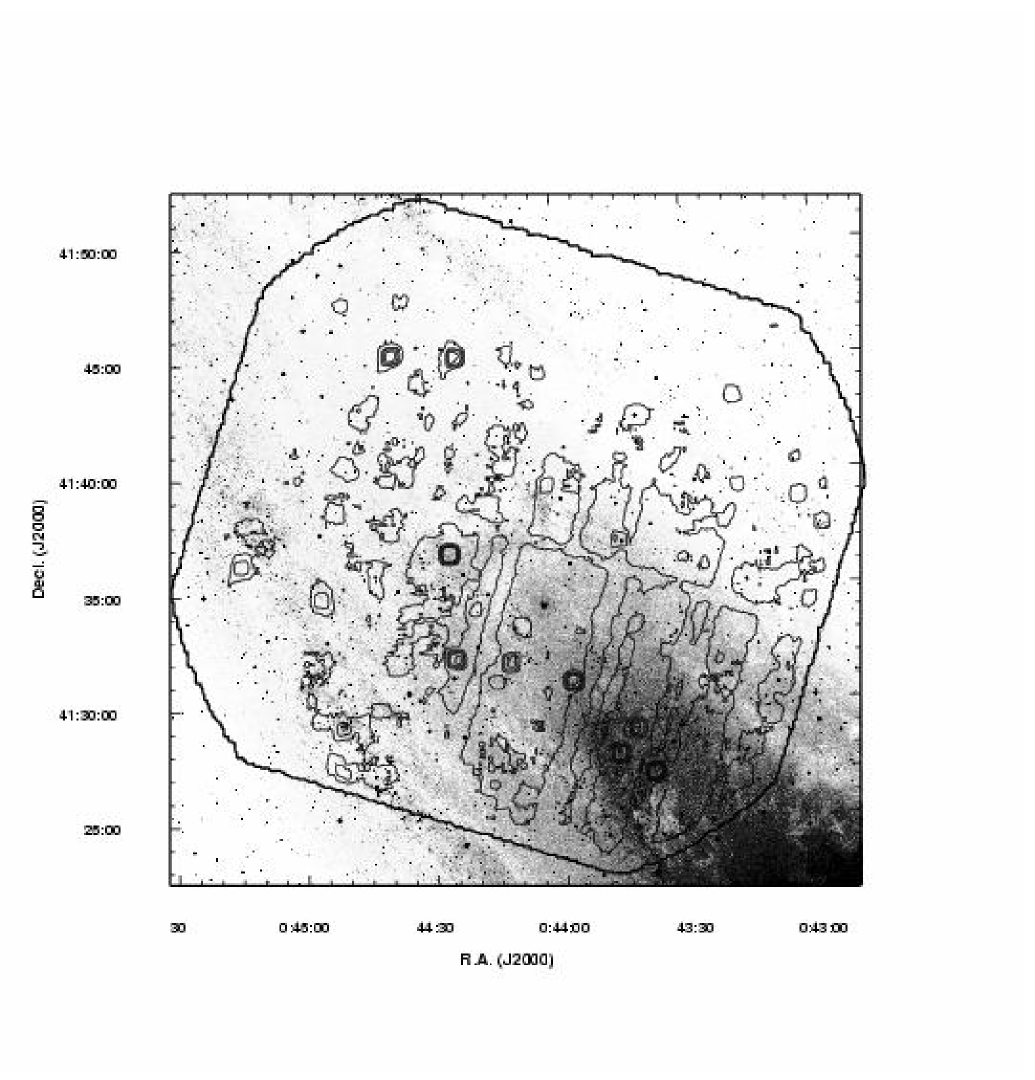
The observation of M31 North 1 field revealed the presence of soft unresolved soft X-ray emission from the disk of M31. The unresolved emission follows the pattern of the spiral structure and can be traced up to the distance of ( kpc at 760 kpc) from the center of the galaxy (Fig. 13). The unresolved emission includes a large region along the major axis of M31 and a number of smaller regions in the spiral arms. The unresolved emission covers the “inner star-forming ring” of M31 (Haas et al. (1998)) and has several local enhancements that are clearly associated with regions of recent star formation (Schmidtobreick, Haas & Lemke (2000)).
To characterize the diffuse emission from the disk of M31, we extracted the EPIC-pn spectrum from arcmin2 region in the disk at the projected distance of kpc from the center, using the background region outside the disk and eliminating point-like sources from both the source and background regions. To reduce contamination from faint SNR, regions containing undetected optical SNR candidates (Braun & Walterbos 1993; Magnier et al. 1995) were also excluded from source and background extraction regions. The resulting normalized count spectrum is shown in Fig. 14. The spectrum of the unresolved emission is soft and shows possible presence of spectral lines. A crude approximation of its shape in the keV energy range with a power law model gives a value of photon index of . The spectrum of unresolved emission can be adequately approximated by two-component spectral model including the Raymond-Smith optically thin thermal plasma emission model with a temperature of keV and normalized keV flux of ergs s-1 cm-2 arcmin-2 and a weak power law component with photon index of contributing of the total luminosity in the keV energy band (Fig. 14).
The spectrum of unresolved emission differs significantly from the cumulative spectrum of faint point-like sources in the same region, which can be presented by absorbed power law model of photon index and absorbing column density . The spectral properties of the unresolved emission are somewhat similar to that of the thermal SNR detected in our observations (see Section 6), but both selection procedure and great spatial extent of the unresolved emission make serious spectral contamination from SNR unlikely. This argues strongly that the bulk of the diffuse X-ray emission in the disk of M31 is not simply due to the faint, unresolved X-ray binaries and SNR. It suggests that there is a significant hot interstellar gas contribution to the diffuse emission, analogous to the hot gas components found in the center of M31 (Shirey et al. (2001)), in the disk of M33 (Long et al. (1996); Pietsch et al. (2003)), and in our own Galaxy. Another significant contributor to the diffuse emission component could be X-ray emission from normal stars in the disk of M31 (West, Barber, & Folgheraiter (1997)).
A weak power law component in the spectrum of unresolved emission still can be due to the combined effect of faint X-ray binaries below our detection limit and some remaining contribution from extracted point-like sources.
13. SUMMARY
A series of deep XMM-Newton observations of northern disk of M31 allow a detailed study of spectral and temporal properties of detected X-ray sources down to flux levels of ergs s-1 cm-2. The unprecedented sensitivity of EPIC cameras allowed us to detect and study the unresolved soft X-ray emission associated with disk of M31.
We present the results of X-ray analysis of thirty seven of the brightest sources detected in the M31 northern disk fields. Combining the results of X-ray analysis with available data at other wavelengths, we were able to classify , or 19 out of 37 sources.
Two sources in our sample were previously unknown: the hard X-ray source XMMU J004415.8+413057 and a transient supersoft source XMMU J004414.1+412206. A detailed analysis of the timing properties of XMMU J004415.8+413057 revealed possible X-ray pulsations with a period of 197 s. The combination of the unique spectral and timing properties of XMMU J004415.8+413057 would make it the first accreting X-ray pulsar and HMXB candidate detected in M31.
Six X-ray sources were identified with M31 globular clusters (GC). The spectral properties of GC sources were found to be strikingly similar to that of the bright Galactic low mass X-ray binaries located in the bulge and globular clusters (Sidoli et al. (2001); Iaria et al. (2001); DiSalvo et al. (2001)). Two GC X-ray sources (XMMU J004251.9+413107 and XMMU J004627.0+420151) have estimated persistent isotropic luminosities above ergs s-1, making them brighter than any known Galactic GC X-ray source. The comparison of the X-ray properties of GC sources with optical properties of their host globular clusters has shown that brighter sources tend to reside in more metal poor clusters (Fig 7, left panel).
Three X-ray sources were identified with SNR based on their X-ray spectra and positional coincidence with SNR candidates from optical and radio surveys. We found five bright X-ray sources to coincide with Galactic foreground stars. Two of them demonstrate a remarkable variability of X-ray flux on a time scale of individual XMM-Newton observations. Two X-ray sources coincide with radio sources and are probably distant radio galaxies/AGN.
The properties of the remaining 18 bright X-ray sources detected in our survey are consistent with AGN in the background of M31 and X-ray binaries belonging to M31. Many of them show high values of low-energy absorption, which combined with extreme faintness of their possible optical counterparts makes them good candidates for an obscured AGN.
The XMM-Newton observations of M31 North 1 field revealed the presence of soft unresolved X-ray emission from the disk of M31. It follows the pattern of the spiral arms and can be traced up to the distance of ( kpc at 760 kpc) from the center of the galaxy. The spectral properties and spatial distribution of the unresolved emission suggest that there is a significant hot interstellar gas contribution to the diffuse emission, analogous to the hot gas components found in the center of M31, in the disks of other external galaxies and in our own Galaxy.
14. Acknowledgments
Part of this work was done during a summer workshop at the Aspen Center for Physics, S. T. and W. P. are grateful to the Center for their hospitality. Support for this work was provided through NASA Grant NAG5-12390. XMM-Newton is an ESA Science Mission with instruments and contributions directly funded by ESA Member states and the USA (NASA). This research has made use of data obtained through the High Energy Astrophysics Science Archive Research Center Online Service, provided by the NASA/Goddard Space Flight Center. This publication makes use of data products from the Two Micron All Sky Survey, which is a joint project of the University of Massachussetts and the Infrared Processing and Analysis Center/California Institute of Technology, funded by NASA and NSF.
References
- Anders & Grevesse (1989) Anders, E., & Grevesse, N. 1989, Geochim. Cosmochim. Acta, 53, 197
- Arnaud (1996) Arnaud, K. 1996, in Astronomical Data Analysis Software and Systems V, ASP Conference Series 101, ed. G. Jacoby & J. Barnes (San Francisco: ASP) 17
- Barmby et al. (2000) Barmby, P., Huchra, J.P., Brodie, J.P., Forbes, D.A., Schroder, L.L., & Grillmar, C.J. 2000, AJ, 119, 727
- Barmby & Huchra (2001) Barmby, P., & Huchra, J.P. 2001, ApJ, 122, 2458
- Battistini et al. (1987) Battistini, P., et al., 1987, AAS, 67, 447
- Blair et al. (1981) Blair, W. P., Kirshner, R. P., Chevalier, R. A. 1981, ApJ, 247, 879
- Blair et al. (1982) Blair, W. P., Kirshner, R. P., Chevalier, R. A. 1982, ApJ, 254, 50
- Condon et al. (1998) Condon, J.J., Cotton, W.D., Greisen, E.W., Yin, Q.F., Perley, R.A., Taylor, G.B., & Broderick J.J. 1998, AJ, 115, 1693
- DiSalvo et al. (2001) DiSalvo, T., Robba, N. R., Iaria, R., Stella, L., Burderi, L., & Israel, G. L. 2001, ApJ, 554, 49
- Di Stefano et al. (2001) Di Stefano, R., Kong, A. K. H., Garcia, M. R., Barmby, P., Greiner, J., Murray, S. S., Primini, F. A. 2002, ApJ, 570, 618
- Di Stefano & Kong (2002) Di Stefano, R., & Kong, A. K. H. 2002, ApJ, 592, 884
- Dickey & Lockman (1990) Dickey, J. M., & Lockman F. J. 1990, ARAA, 28, 215
- Dove et al. (1997) Dove, J. B., Wilms, J., Maisack, M., Begelman, M. C. 1997, ApJ, 487, 759
- Garcia et al. (2002) Garcia, M. R., Kong, A. K. H., McClintock, J. E., Primini, F. A., Kaaret, P., & Murray, S. S. 2002, ATel. 82
- Haas et al. (1998) Haas, M., Lemke, D., Stickel, M., Hippelein, H., Kunkel, M., Herbstmeier, U., & Mattila, K. 1998, AA, 338, L33
- Haberl et al. (2003) Haberl, F., Dennerl, K., & Pietsch, W. 2003, AA, 406, 471
- Haiman et al. (1994) Haiman, Z., Magnier, E. A., Lester, R. R., Lewin, W. H. G., van Paradijs, J., Hasinger, G., Pietsch, W., & Truemper, J. 1994, AA, 286, 725
- Huchra, Brodie & Kent (1991) Huchra, J.P., Brodie, J.P., & Kent, S.M. 1991, ApJ, 370, 495
- Iaria et al. (2001) Iaria, R., Burderi, L., Di Salvo, T., La Barbera, A., & Robba, N. R. 2001, ApJ, 547, 412
- Kahabka & van den Heuvel (1997) Kahabka, P., & van den Heuvel, E. P. J. 1997, ARAA, 35, 69
- Kong et al. (2002) Kong, A. K. H., Garcia, M. R., Primini, F. A., Murray, S. S., Di Stefano, R., & McClintock, J. E. 2002, ApJ, 577, 738
- Kotov, Trudolyubov & Vestrand (2003) Kotov, O., Trudolyubov, S., & Vestrand, W. T. 2003, ApJ, submitted
- Long et al. (1996) Long, K., Charles, P., Blair, W., & Gordon, S. 1996, ApJ, 466, 750
- Magnier et al. (1992) Magnier, E. A., Lewin, W. H. G., van Paradijs, J., Hasinger, G., Jain, A., Pietsch, W., & Truemper, J. 1992, AAS, 96, 379
- Magnier (1993) Magnier, E. A. 1993, Ph.D. thesis, MIT
- Magnier et al. (1995) Magnier, E. A., Prins, S., van Paradijs, J., Lewin, W. H. G., Supper, R., Hasinger, G., Pietsch, W., Truemper, J. 1995, AAS, 114, 215
- Magnier et al. (1997) Magnier, E. A., Primini, F. A., Prins, S., van Paradijs, J., & Lewin, W. H. G. 1997, ApJ, 490, 649
- Massey et al. (2001) Massey, P., Hodge, P. W., Holmes, S., Jacoby, G., King, N. L., Olsen, K., Saha, A., & Smith, C. 2001, in American Astronomical Society Meeting, 199, 1305
- Mitsuda et al. (1984) Mitsuda, K., Inoue, H., Koyama, K., et al. 1984, PASJ, 36, 741
- Perrett et al. (2002) Perrett, K.M., Bridges, T.J., Hanes, D.A., Irwin, M.J., Brodie, J.P., Carter, D., Huchra, J.P., & Watson, F.G. 2002, AJ, 123, 2490
- Pietsch et al. (2003) Pietsch, W., Ehle, M., Haberl, F., Misanovic, Z., Trinchieri, G. 2003, Astronomische Nachrichten, 324, 85
- Prestwich et al. (2003) Prestwich, A. H., Irwin, J. A., Kilgard, R. E., Krauss, M. I., Zezas, A., Primini, F., Kaaret, P., & Boroson, B. 2003, ApJ, 595, 719
- Primini et al. (1993) Primini, F. A., Forman, W., & Jones, C., 1993, ApJ, 410, 615
- Ramsay et al. (1994) Ramsay, G., Mason, K. O., Cropper, M., Watson, M. G., & Clayton, K. L. 1994, MNRAS, 270, 692
- Raymond & Smith (1977) Raymond, J. S., & Smith, B. W. 1977, ApJS, 35, 419
- Schmidtobreick, Haas & Lemke (2000) Schmidtobreick, L., Haas, M., & Lemke, D. 2000, AA, 363, 917
- Shirey et al. (2001) Shirey, R., Soria, R., Borozdin, K., Osborne, J. P., Tiengo, A., Guainazzi, M., Hayter, C., La Palombara, N., Mason, K., Molendi, S., Paerels, F., Pietsch, W., Priedhorsky, W., Read, A. M., Watson, M. G., West, R. G., 2001, AA, 365, L195
- Sidoli et al. (2001) Sidoli, L., Parmar, A. N., Oosterbroek, T., Stella, L., Verbunt, F., Masetti, N., & Dal Fiume, D., 2001, AA, 368, 451
- Strueder et al. (2001) Strueder, L. et al., 2001, A&A, L18
- Sunyaev Titarchuk (1980) Sunyaev, R. A., Titarchuk, L. G. 1980, AA, 86, 121
- Supper et al. (1997) Supper, R., Hasinger, G., Pietsch, W., Truemper, J., Jain, A., Magnier, E.A., Lewin, W.H.G., van Paradijs, J. 1997, AA, 317, 328
- Supper et al. (2001) Supper, R., Hasinger, G., Lewin, W. H. G., Magnier, E.A., van Paradijs, J., Pietsch, W., Read, A.M., & Truemper, J. 2001, AA, 373, 63
- Titarchuk (1994) Titarchuk, L. 1994, ApJ, 434, 570
- Titarchuk & Lyubarskij (1995) Titarchuk, L., & Lyubarskij, Y. 1995, ApJ, 450, 876
- Trinchieri & Fabbiano (1991) Trinchieri, G., & Fabbiano, G., 1991, ApJ, 382, 82
- (46) Trudolyubov, S., Borozdin, K., & Priedhorsky, W., Mason, K., & Cordova, F. 2002, IAU Circ. 7798
- (47) Trudolyubov, S., Borozdin, K., & Priedhorsky, W., Osborne, J., Watson, M., Mason, K., & Cordova, F. 2002b, ApJ, 581, L27
- Turner et al. (2001) Turner, M. et al., 2001, A&A, 365, L27
- Vaughan et al. (1994) Vaughan, B. A., van der Klis, M., Wood, K. S., Norris, J. P., Hertz, P., Michelson, P. F., van Paradijs, J., Lewin, W. H. G., Mitsuda, K., & Penninx, W. 1994, ApJ, 435, 362
- West, Barber, & Folgheraiter (1997) West, R. G., Barber, C. R., & Folgheraiter, E. L. 1997, MNRAS, 287, 10
- Williams et al. (2003) Williams, B. F., Garcia, M. R., Kong, A. K. H., Primini, F. A., King, A. R., & Murray, S. S. 2003, ApJ, submitted, astro-ph/0306421
| Obs. | Date, UT | , UT | Field | Obs. ID | RA (J2000)a | Dec (J2000)a | Exp.(MOS)b | Exp.(pn)b |
|---|---|---|---|---|---|---|---|---|
| (h:m:s) | (h:m:s) | (d:m:s) | (ks) | (ks) | ||||
| 2002 Jan 05 | 06:28:31 | M31 North1 | 0109270701 | 00:44:01.0 | 41:35:57.0 | 57.3 | 54.7 | |
| 2002 Jan 26 | 16:51:03 | M31 North2 | 0109270301 | 00:45:20.0 | 41:56:09.0 | 29.1 | 25.3 | |
| 2002 Jun 29 | 08:59:02 | M31 North3 | 0109270401 | 00:46:38.0 | 42:16:20.0 | 51.5 | 36.5 | |
| 2002 Jan 06 | 18:07:17 | M31 Core | 0112570101 | 00:42:43.0 | 41:15:46.1 | 63.0 | 61.0 |
-
a
– coordinates of the center of the field of view
-
b
– instrument exposure used in the analysis
| Source | XMM Source Name | Optical/IR/Radio | Offsetb | SHP97c | Offsetd | Comment |
|---|---|---|---|---|---|---|
| ID | (XMMU …) | IDa | () | () | ||
| 1 | J004251.9+413107 | Bo 135 | 1.4 | 205 | 1.8 | GCS |
| 2 | J004301.3+413017 | Bo 91/MIT 236 | 0.9 | 218 | 5.3 | GCS |
| 3 | J004339.1+412654 | BW57/MA 3-069 | 2.3/6.9 | 249 | 5.6 | SNR |
| W85 180 | 2.2 | |||||
| 4 | J004342.9+412850 | MIT 311 | 1.3 | 250 | 1.4 | GCS |
| MLV92 315558 | 1.0 | |||||
| 5 | J004345.5+413657 | Bo 193 | 1.2 | 253 | 4.4 | GCS |
| 6 | J004347.1+412745 | 2MASS 004347.18+412744.5 | 1.6 | Foreground star | ||
| MLV92 308951 | 1.8 | |||||
| 7 | J004356.5+412202 | Bo204 | 0.6 | 261 | 3.5 | GCS |
| 8 | J004357.5+413054 | MLV92 328135 | 1.3 | 268 | 2.1 | |
| 9 | J004402.7+413927 | MLV92 379667 | 1.0 | 266 | 4.1 | |
| 10 | J004412.0+413147 | MLV92 333307 | 0.9 | 272 | 4.7 | |
| 11 | J004414.1+412206 | Supersoft transient | ||||
| 12 | J004415.8+413057 | Transient, HMXB? 197s pulsar | ||||
| 13 | J004422.5+414507 | MLV92 394966 | 0.3 | 278 | 3.3 | |
| 14 | J004424.7+413200 | MLV92 334722 | 0.7 | 279 | 12 | |
| MLV92 334827 | 1.7 | |||||
| 15 | J004425.5+413633 | 2MASS 004425.57+413633.4 | 0.6 | 281 | 6.0 | Foreground star |
| MLV92 362312 | 0.4 | |||||
| 16 | J004437.8+414513 | NVSS J004437+414511 | 2.0 | Radio source | ||
| W85 207 | 6.5 | |||||
| 17 | J004451.1+412907 | BW 33 | 2.6 | 288 | 16 | SNR |
| 18 | J004452.2+412717 | MLV92 306564 | 2.2 | 289 | 2.4 | |
| MLV92 306271 | 2.5 | |||||
| 19 | J004455.4+413440 | |||||
| 20 | J004456.3+415936 | 2MASS 004456.37+415936.8 | 0.4 | 292 | 7.0 | Foreground star |
| MLV92 436498 | 0.6 | |||||
| 21 | J004513.9+413614 | BW 39/MA 2-049 | 1.7/4.1 | 297 | 9.1 | SNR |
| W85 231 | 4.7 | |||||
| 22 | J004540.5+420806 | 2MASS 004540.54+420806.8 | 0.8 | 316 | 4.0 | Foreground star |
| MLV92 450979 | 0.6 | |||||
| 23 | J004544.9+415858 | 317 | 2.6 | |||
| 24 | J004611.5+420826 | 332 | 5.3 | |||
| 25 | J004619.9+421441 | MLV92 462752 | 1.6 | |||
| MLV92 462656 | 4.3 | |||||
| 26 | J004624.8+420420 | NVSS J004625+420406 | 16 | 348 | 19 | Cluster of Galaxies at |
| 27 | J004627.0+420151 | Bo 386 | 1.2 | 349 | 4.0 | GCS |
| 28 | J004648.0+420851 | NVSS J004648+420855 | 3.8 | 353 | 1.8 | Radio source |
| W85 252 | 2.8 | |||||
| 29 | J004651.8+421951 | 354 | 12 | |||
| 30 | J004651.9+421504 | |||||
| 31 | J004655.4+422049 | 2MASS 004655.51+422050.1 | 1.6 | 355 | 4.1 | |
| MLV92 472612 | 1.4 | |||||
| 32 | J004703.6+420449 | MLV92 444881 | 3.7 | 357 | 5.6 | |
| 33 | J004706.5+422211 | MLV92 474281 | 1.9 | 359 | 12 | |
| 34 | J004713.3+422045 | MLV92 472554 | 2.2 | 361 | 11 | |
| 35 | J004725.2+422118 | MLV92 473224 | 2.0 | |||
| 36 | J004726.1+422157 | 2MASS 004726.12+422158.4 | 1.6 | 369 | 6.1 | Foreground star |
| MLV92 474007 | 1.4 | |||||
| 37 | J004748.3+421932 | MLV92 470983 | 1.8 | 384 | 7.1 |
-
a – source identifications beginning with BW refer to the SNR candidates listed in Braun Walterbos (1993). Identifications beginning with MA refer to the SNR candidates from Magnier et al. (1995). Identifications beginning with Bo refer to M31 Globular Cluster candidates listed in Table IV of Battistini et al. (1987). Identifications beginning with MIT refer to M31 Globular cluster candidates from Magnier (1993).
-
b – angular distance between XMM source position and the position of its possible optical counterpart.
-
c – SHP97 refer to M31 ROSAT/PSPC catalogue entries from Supper et al. (1997, 2001).
-
d – offset between XMM and ROSAT source positions.
| Parameter | |
|---|---|
| XMMU J004415.8+413057a () | |
| Absorbed Power Law | |
| Photon Index | |
| , cm-2 | |
| Fluxb | |
| (d.o.f.) | |
| XMMU J004414.1+412206c () | |
| Absorbed Black Body Model | |
| , eV | |
| , cm-2 | |
| Fluxd | |
| (dof) | |
-
a – EPIC-pn data, keV energy range
-
b – Absorbed model flux in the keV energy range in units of erg s-1 cm-2
-
c – EPIC-MOS1 and MOS2 data, keV energy range
-
d – Absorbed model flux in the keV energy range in units of erg s-1 cm-2
| ID a | Remarks | |||||||
| Model: Absorbed Power Law (POWERLAW*WABS) | ||||||||
| Photon | N | Fluxc | ||||||
| Index | (dof) | |||||||
| 01 | 443.7(424) | MOS1+MOS2 | ||||||
| 02 | 228.6(176) | MOS1+MOS2+pn | ||||||
| 04 | 33.2(32) | pn | ||||||
| 05 | 26.3(26) | MOS1+MOS2 | ||||||
| 07 | 14.6(16) | pn | ||||||
| 27 | 270.2(237) | MOS1+MOS2+pn | ||||||
| Model: Absorbed Cutoff Power Law (CUTOFFPL*WABS) | ||||||||
| Photon | Cutoff Energy | Fluxc | ||||||
| Index | (keV) | (dof) | ||||||
| 01 | MOS1+MOS2 | |||||||
| 02 | MOS1+MOS2+pn | |||||||
| 27 | MOS1+MOS2+pn | |||||||
| Model: Absorbed Comptonization Model (COMPTT*WABS) | ||||||||
| Optical Depth | Fluxc | |||||||
| (keV) | (keV) | (dof) | ||||||
| 01 | MOS1+MOS2 | |||||||
| 02 | MOS1+MOS2+pn | |||||||
| 27 | MOS1+MOS2+pn | |||||||
-
a – Source number in Table 2
-
b – Equivalent hydrogen column depth in units of cm-2
-
c – Absorbed model flux in the keV energy range in units of erg s-1 cm-2
-
d – Absorbed isotropic source luminosity in the keV energy range in units of erg s-1 assuming the distance of 760 kpc
| Parameter | |
|---|---|
| XMMU J004251.9+413107a () | |
| (COMPTT+DISKBB)*WABS | |
| , cm-2 | |
| , keV | |
| , keV | |
| Optical Depth | |
| , keV | |
| , km | |
| Fluxb | |
| (d.o.f.) | |
-
a – EPIC-MOS1 and MOS2 data, keV energy range
-
b – Absorbed model flux in the keV energy range in units of erg s-1 cm-2
-
c – Absorption-corrected ratio of the disk-blackbody flux to the total source flux in the keV energy band
-
d – Absorbed isotropic source luminosity in the keV energy range in units of erg s-1 assuming the distance of 760 kpc
| Model | log | Abundancea | N | Fluxc | /(dof) | |||||
| (keV) | N | O | Ne | S | Fe | |||||
| XMMU J004339.1+412654 () | ||||||||||
| RS | … | 1 | 1 | 1 | 1 | 1 | 39.8(34) | |||
| … | 1 | 36.5(34) | ||||||||
| … | 26.3(31) | |||||||||
| NEI | 1 | 1 | 1 | 1 | 1 | 46.0(33) | ||||
| 1 | 33.1(33) | |||||||||
| XMMU J004513.9+413614 () | ||||||||||
| RS | … | 1 | 1 | 1 | 1 | 1 | 15.3(14) | |||
| … | 1 | 19.4(14) | ||||||||
| … | 9.8(13) | |||||||||
| XMMU J004451.1+412907 () | ||||||||||
| RS | … | 7.9(10) | ||||||||
-
a – Relative to the solar abundance.
-
b – An equivalent hydrogen column density in units of cm-2.
-
c – Absorbed model flux in the keV energy range in units of erg s-1 cm-2.
-
d – Fixed at optical value (Blair et al. (1982)).
| Source ID | AFe | NH | Fluxa | Remarks | ||
|---|---|---|---|---|---|---|
| (keV) | cm-2 | (dof) | ||||
| 6 | pn | |||||
| 15 | pn | |||||
| 20 | pn | |||||
| 22 | pn, Obs. | |||||
| 22 | pn+MOS1, Obs. | |||||
| 36 | pn+MOS1+MOS2 |
-
a – absorbed model flux in the keV energy range in units of erg s-1 cm-2
-
b – a upper limit
| Source ID | Photon | NH | Fluxa | Remarks | |
|---|---|---|---|---|---|
| Index | cm-2 | (dof) | |||
| 16 | 19.1(25) | pn | |||
| 28 | 61.3(50) | pn+MOS1+MOS2 |
-
a – absorbed model flux in the keV energy range in units of erg s-1 cm-2
| Source Name | Photon | NH | Fluxa | Remarks | |
|---|---|---|---|---|---|
| XMMU J00… | Index | cm-2 | (dof) | ||
| 8 | 47.5(44) | pn | |||
| 9 | 13.7(17) | pn | |||
| 10 | 9.6(20) | pn | |||
| 13 | 23.3(35) | MOS1+MOS2 | |||
| 14 | 60.4(57) | pn+MOS1+MOS2 | |||
| 18 | 5.9(11) | MOS2 | |||
| 19 | 31.2(43) | MOS1+MOS2 | |||
| 23 | 12.6(13) | pn | |||
| 24 | 40.1(45) | pn+MOS1+MOS2 | |||
| 25 | 22.9(28) | MOS1+MOS2 | |||
| 29 | 10.6(14) | pn | |||
| 30 | 13.3(8) | pn | |||
| 31 | 319.5(295) | pn+MOS1+MOS2 | |||
| 32 | 10.1(13) | pn | |||
| 33 | 23.8(14) | pn | |||
| 34 | 55.1(58 ) | pn+MOS1+MOS2 | |||
| 35 | 12.8(15) | pn | |||
| 37 | 76.4(71) | MOS1+MOS2 |
-
a – absorbed model flux in the keV energy range in units of erg s-1 cm-2