The Physics of X-ray Emission
from Accreting Millisecond Pulsars
Abstract
By analyzing the Rossi X-ray Timing Explorer data on SAX J1808.43658, we show that the X-ray emission in accretion powered millisecond pulsars can be produced by Comptonization in a hot slab (radiative shock) of Thomson optical depth at the neutron star surface. The escaping radiation consists of two components: a black body and a hard Comptonized tail. These components have very different angular distribution: the black body peaks along the slab normal (a “pencil”–like emission pattern), while the tail has a broader angular distribution (a “fan”–like pattern). This results in very different variability properties. We construct a detailed model of the X-ray production accounting for the Doppler boosting, relativistic aberration and gravitational light bending. We are able to reproduce the pulse profiles at different energies, corresponding phase lags, as well as the time-averaged spectrum. We obtain constraints on the neutron star radius: km if its mass , and km if . We present simple analytical formulae for computing the light curves and oscillation amplitudes expected from hot spots in X-ray bursters and accretion powered millisecond pulsars. We also propose an analytical expression that can be used to determine the size of the black body emission region from the observed properties.
1 INTRODUCTION
In order to understanding the X-ray production in accreting black hole and neutron star sources in X-ray binaries, one needs to model their spectral and temporal properties simultaneously. In the black hole case, the emission is believed to originate in the accretion disk and/or its corona. Detailed spectral fits to the broad band spectra leave little doubts that the main emission mechanism is thermal or non-thermal Comptonization. However, in spite of extensive efforts, the exact geometry of the emission region is still not known p98 . The hard X-rays can be produced in the central hot flow esin98 ; pkr97 and/or in the magnetically dominating corona/jet in the vicinity of a cooler accretion disk b99 ; mal01 . Temporal variability provide some additional constraints on the size of the emission region mac00 , but has difficulties in breaking the model degeneracy p01 . The observed spectral-temporal correlations seem, however, to favor the hot inner disk scenario gilf99 ; gilfthis ; aaz03 at least for the hard state dominated by thermal Comptonization.
In the case of accreting neutron stars in low-mass X-ray binaries, the emission can be produced in the accretion disk (and corona) as well as at the neutron star surface, with the later dominating the total energy output ss00 ; ss88 . Depending on the magnetic field strength and the accretion rate, there can be different scenarios. The gravitational energy can be dissipated gradually in the boundary (or spreading) layer, while the matter is slowing down from the rapid Keplerian rotation to a slower rotation of a neutron star, or abruptly in the shock when the accreting material, following magnetic field lines, is channeled towards magnetic poles of the star. Direct spectral decomposition can be quite complicated done03 . The analysis of the Fourier frequency resolved spectra of neutron stars in low-mass X-ray binaries shows that the accretion disk producing soft X-ray emission does not vary much, while the hard radiation (from the boundary layer?) is responsible for most of the observed variability at high Fourier frequencies gilf03 .
In all the cases considered above, it is not absolutely clear what is the origin of a given spectral component. In accretion powered wij03 as well as nuclear powered (X-ray bursters) sb03 millisecond pulsars, the situation seems to be simpler. Observations of the coherent pulsations confirms that the bulk of the emission is produced at the surface of a neutron star which rotates at 200–600 Hz. We can also fold the light curve on a pulsar period and study the pulse profile as a function of energy. For accreting pulsars the statistics is better since one can fold the profiles over a longer observational period (days rather than seconds in the X-ray burst oscillations). Detailed modeling of the pulse profiles allows us to get interesting constraints on the compactness of the neutron star as well as on the emission pattern from the neutron star surface pg03 .
2 SPECTRUM AND RADIATION PATTERN
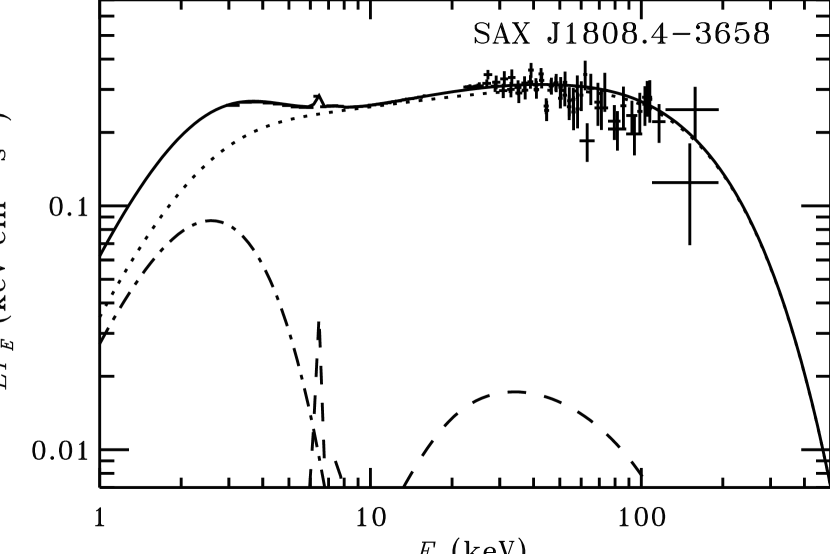
We assume that the emission originates close to the neutron star surface in an accretion shock which we approximate as a plane-parallel slab. The time-averaged observed spectrum of the best studied accretion powered pulsar SAX J1808.43658 (see Fig. 1) is similar to those in other neutron star and black hole sources. It can be represented as a composition of a black body with temperature keV (dash-dotted curve), thermal Comptonization (dots) by electrons of temperature keV and optical depth , Compton reflection bump and the iron line (dashes). The Compton reflection (from the disk) has a rather small amplitude because of the disruption of the accretion flow in the neutron star vicinity gier .
If the settling bulk velocity smaller than the thermal electron velocity, we can easily compute the angular distribution of the escaping radiation ps96 ; st85 . The radiation pattern is very different for photons of different scattered orders (see Fig. 2). One sees that the black body (marked with 0) is strongly peaked along the normal to the slab, while photons scattered many times are beamed in the direction making an angle from the normal. In the Comptonization process, scatterings also shift photons along the energy axis so that higher energy photons are scattered more times.

3 MODEL AND RESULTS
The light curves from a circular spot are computed accounting for the special relativistic effects (Doppler boosting, relativistic aberration) and the gravitational light bending in Schwarzschild metric. The model is described in details in pg03 . The spot spectrum is assumed to consist of two components: a black body and a Comptonization tail with different angular distributions. Their spectral shapes are taken as in the observed time-averaged spectrum (see Fig. 1). The model parameters are: the pulsar frequency (fixed at Hz for SAX J1808.43658), the neutron star mass , stellar radius , inclination , colatitude of the spot center , “optical depth” , that describes the angular dependence of the black body intensity , and a parameter determining the angular distribution of the Comptonized radiation . This linear dependence of the intensity mimics the angular distribution of radiation escaping from a slab (Fig. 2).
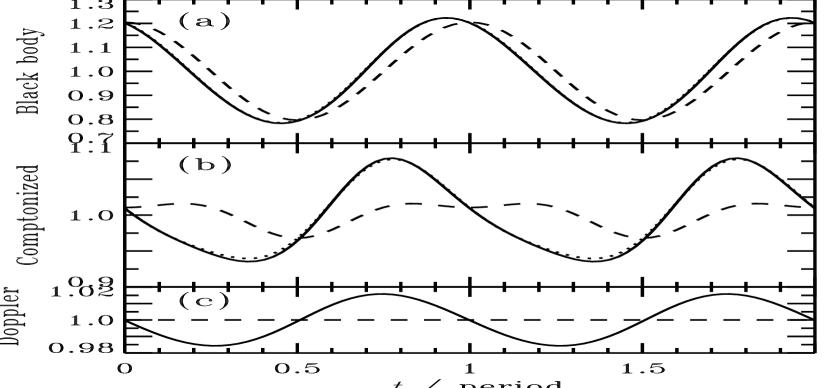
A rapid rotation of the star causes significant changes in the pulse profile. We illustrate this by showing in Fig. 3 the light curves of a slowly rotating star (dashed curves) and those modified by the Doppler boosting and aberration for a neutron star of rotational frequency 401 Hz (solid curves). We consider both the black body and the Comptonized emission. The pulse profiles strongly depend on the assumed emission pattern. Light bending depends on the compactness of the star (where ) and reduces the variability amplitude with respect to a less compact star (see below).
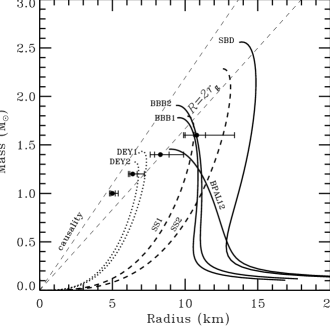
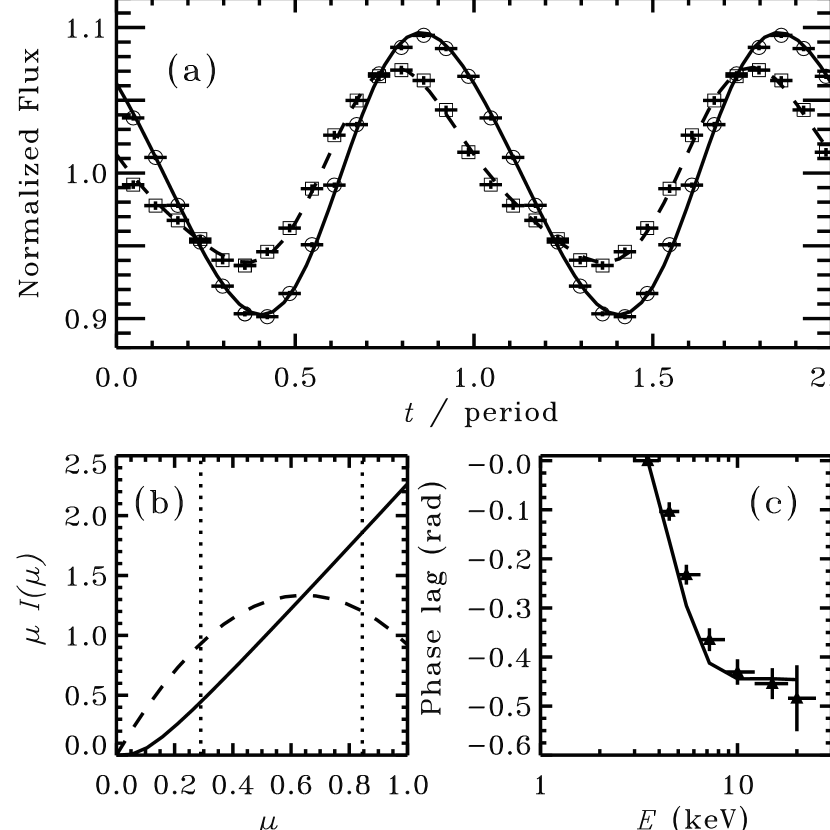
The model parameters can be constrained by fitting the observed light curves from SAX J1808.43658 (see Fig. 4). The fitted emission pattern of Comptonized and black body radiation confirms our expectations: the black body is beamed along the surface normal while the hard radiation flux (proportional to the intensity times the cosine of the projected area) is more isotropic (Fig. 4b). One of the main result of this study is determination of the radius of the compact star. The dependence of the radius on the assumed mass is shown in Fig. 5. For a standard neutron star mass of , we get km, while for a more massive star , the radius of 11 km is consistent with some neutron star equation of state. The inclination of the system can be constrained to . Our model is able to fit the time-averaged spectra, the energy dependent pulse profiles and the observed phase lags, simultaneously.
Very similar pulse profiles (but with higher oscillation amplitude) were also observed from the recently discovered fifth ms pulsar XTE J1814338 s03 . In the framework of the present model, the data can be explained for example, by increasing the colatitude of the spot center from to . The presence of the harmonic in the burst oscillations s03 could result from the larger contribution of the Comptonized radiation (with a “fan”–like emission pattern) to the observed flux in this source comparing to other X-ray bursters since a black body does not produce harmonics (see eq. 5). This interpretation is supported by the observed hard spectrum m03 .
4 ANALYTICAL LIGHT CURVES, OSCILLATION AMPLITUDES, AND SPOT SIZE
Using formalism described in b02 (see pg03 for details) we obtain simple expressions for the light curve from a small spot at a rapidly rotating neutron star. For example, the bolometric flux from a black body spot is
| (1) |
where is the black body intensity (in the spot comoving frame), is the spot area, is the distance to the source, , is the pulse phase, and is the Doppler factor. We can also get simple (but very accurate) expression for the oscillation amplitude (here from one spot and neglecting Doppler boosting which does not affect it much): , where we defined and .
The time-averaged flux observed from a spot of angular radius is pg03 (assuming the spot is always visible)
| (2) |
This formula allows us to obtain a simple expression for estimating the emission region size (compare to pod00 ):
| (3) |
which can be solved by iterations. Here is the “observed” spot size, , and is the fitted temperature. For small , we get . For example, if we look at the spot always along the symmetry axis (take ), we get and . Thus in that case, light bending does not affect the size. A spot of a finite size produces a smaller variability amplitude
| (4) |
For an anisotropic source given by a linear relation at a slowly rotating star (), we can obtain the ratio of the variability amplitudes at the fundamental frequency and the harmonic , using equation (1):
| (5) |
One sees that a black body source does not produce any harmonics. We can estimate the impact of rapid rotation on that ratio. Expanding Doppler factor in powers of the equatorial velocity and keeping the first term only, we get (see pb04 for details):
| (6) |
Thus this ratio depends linearly on and (as for anisotropic source, eq. 5). One also sees that due to a linear dependence on the rotational frequency, it is much easier to get large amplitude of the harmonic with an anisotropic source than just by rotation. These expressions can be used for analysis of the data from ms pulsars and X-ray bursters.
References
- (1) Beloborodov, A. M. 1999, ApJ, 510, L123
- (2) Beloborodov, A. M. 2002, ApJ, 566, L85
- (3) Done, C., Gierliński, M. 2003, MNRAS, 342, 1041
- (4) Esin, A. A., et al. 1998, ApJ, 505, 854
- (5) Gierliński, M., Done, C., Barret, D. 2002, MNRAS, 331, 141
- (6) Gilfanov, M., Churazov, E., Revnivtsev, M. 1999, A&A, 352, 182
- (7) Gilfanov, M., Churazov, E., Revnivtsev, M. 2004, these proceedings
- (8) Gilfanov, M., Revnivtsev, M., Molkov, S. 2003, A&A, 410, 217
- (9) Maccarone, T. J., Coppi, P. S., Poutanen, J. 2000, ApJ, 537, L107
- (10) Malzac, J., Beloborodov, A. M., Poutanen, J. 2001, MNRAS, 326, 417
- (11) Markwardt, C. B., et al. 2003, ATEL 164
- (12) Poutanen, J. 1998, in Theory of Black Hole Accretion Disks, ed. M. A. Abramowicz, G. Björnsson & J. E. Pringle (Cambridge Univ. Press: New York), 100
- (13) Poutanen, J. 2001, Adv. Sp. Res., 28, 267 (astro-ph/0102325)
- (14) Poutanen, J., Beloborodov, A. M. 2004, in preparation
- (15) Poutanen, J., Gierliński, M. 2003, MNRAS, 343, 1301
- (16) Poutanen, J., Svensson, R. 1996, ApJ, 470, 249
- (17) Poutanen, J., Krolik, J. H., Ryde, F. 1997, MNRAS, 292, L21
- (18) Psaltis, D., Özel, F., DeDeo, S. 2000, ApJ, 544, 390
- (19) Sibgatullin, N. R., Sunyaev, R. A. 2000, Pisma AZh, 26, 813 [2000, Astr. Letters, 26, 699]
- (20) Strohmayer, T., Bildsten, L. 2003, in Lewin W. H. G, van der Klis M., eds, Compact Stellar X-Ray Sources. Cambridge University Press, Cambridge, in press (astro-ph/0301544)
- (21) Strohmayer, T. E., Markwardt, C. B., Swank, J. H., in ’t Zand J. 2003, ApJ, 596, L67
- (22) Sunyaev, R. A., Shakura, N. I. 1988, Pisma AZh, 12, 286 [1988, Sov. Astr. Lett., 12, 117]
- (23) Sunyaev, R. A., Titarchuk, L. G. 1985, A&A, 143, 374
- (24) Wijnands, R. 2003, astro-ph/0309347
- (25) Zdziarski, A. A., Lubinski, P., Gilfanov, M., Revnivtsev, M. 2003, MNRAS, 342, 355