11email: recio,piotto@pd.astro.it 22institutetext: Instituto de Astrofisica de Canarias, Via Lactea s/n, 382002 La Laguna Tenerife, Spain
22email: aaj@ll.iac.es 33institutetext: ESO, Karl-Schwarzschild-Str. 2, D-85748 Garching bei Mnchen, Germany
33email: arenzini@eso.org
ROTATION VELOCITIES OF HOT HORIZONTAL BRANCH STARS IN THE GLOBULAR CLUSTERS NGC 1904, NGC 2808, NGC 6093, AND NGC 7078: THE DATABASE ††thanks: Based on observations with the ESO Very Large Telescope + UVES, at the Paranal Observatory, Chile
We present radial and rotation (sin) velocity measurements, from UVES+VLT high resolution spectra of 61 stars in the blue horizontal branches (HB) of the Galactic globular clusters NGC 1904 (M79), NGC 2808, NGC 6093 (M80), and NGC 7078 (M15).
The data reduction and the velocity determination, based on cross-correlation techniques, are discussed in detail. Most of this database has been used by Recio-Blanco et al. (2002) in their analysis of the rotation velocity properties of blue HB stars. Here we present additional data for NGC 2808. We confirm the results of the previous paper, in particular, a possible link between the HB jump and the abrupt change in the rotational velocity distribution around Teff 11,500 K.
Key Words.:
globular clusters: general — stars: horizontal-branch — stars: rotation1 Introduction
The high resolution spectroscopic capabilities of the Ultraviolet Visual Echelle Spectrograph (UVES), combined with the collecting power of the Very Large Telescope (VLT), offer an exceptional opportunity to study the nature of the hot stars populating the anomalously extended blue horizontal branches (HB) in Galactic globular clusters (GC). The horizontal branches with blue tails (BT, here considered to host stars hotter than 12000 K) probably represent the most extreme of the mixed bag of HB anomalies lumped under the term “second-parameter problem” (cf. Catelan et al. 1998, Piotto et al. 1999 for a more detailed discussion). We already know that BTs host He-core H-shell burning stars which have lost up to a factor of two more mass during the Red Giant Branch (RGB) ascent, than other HB stars in the same cluster (D’Cruz et al., 1996). However, we still lack of an explanation for such a sizable mass loss. Several mechanisms, regulating either the core mass or the amount of mass loss that a star experiences on the upper RGB have been proposed as possible second parameter candidates. Among them, stellar rotation, which would delay the helium core flash in a red giant, was also suggested (Mengel & Gross, 1976; Renzini, 1977; Peterson et al. 1995). A faster rotating star would therefore increase its helium core mass and would experience a higher mass loss rate in the RGB, leading to bluer and brighter HB star.
The first investigations on the rotation velocity of blue horizontal branch stars were done by Peterson and collaborators (Peterson 1983, 1985a, 1985b, Peterson et al. 1995). Some of the blue HB stars in the BT cluster M13 were found to be rotating as fast as 40 km/s. On the contrary, clusters with cooler HB morphologies, as M3 and NGC 288, showed only values of sin slower than about 20 km/s. More recently, Behr et al. (2000a, B00a) have suggested the existence of a discontinuity in stellar rotation velocity across one region underpopulated of stars (gap), at Teff 11.000 K, in the HB of M13. Bluewards of the gap, all the stars showed modest rotations (sin km s-1), while, to the red side of the gap, several rapidly rotating stars were found. A similar discontinuity was also detected in M15 (Behr et al. 2000b, B00b).
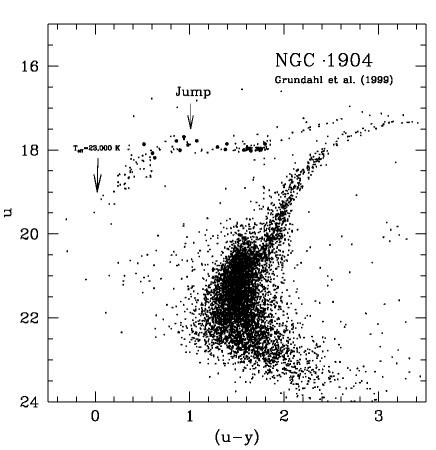
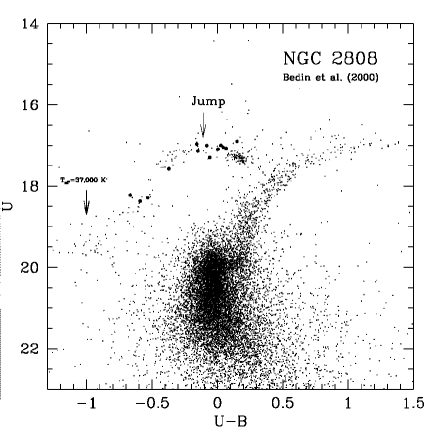
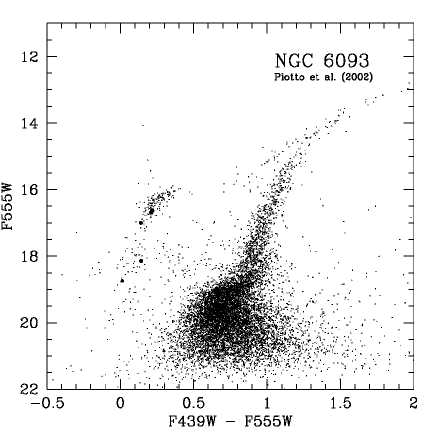
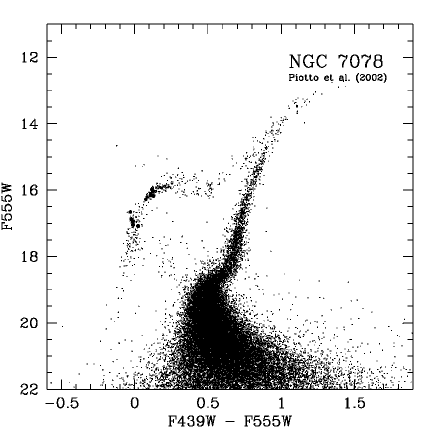
UVES+VLT allows us to measure the rotational velocity of blue HB stars as faint as with an accuracy of a few km/s. For this reason, and prompted by the previous results of B00a, we started a program to investigate how stellar rotation changes as a function of the position along the HB, and from cluster to cluster. We observed at least ten stars per cluster, to statistically avoid the problem of the projection angle (sin) in the determination of stellar rotation. At the present time, we have analyzed 61 stars in 4 Galactic GCs: NGC 1904 (M79), NGC 2808, NGC 6093 (M80) and NGC 7078 (M15). All the target clusters have a blue tail HB morphology, although their horizontal branches have different temperature extensions (see their colour-magnitude diagrams in Fig. 1). The HB of M79 reaches Teff 23,000 K, both M80 and M15 BTs reach a Teff around 30,000 K., while the HB in NGC 2808 goes up to Teff 37,000 K. They also span a range of metallicity, total luminosity, concentration,… as summarized in Table 1.
The target stars have a temperature in the range , distributed on the two sides of the Strmgren (u, uy) luminosity “jump” at (Grundahl et al. 1999, G99). Most of the database we are going to present in this paper has already been used by Recio-Blanco et al. (2002,R02), with a number of interesting results. For the first time, we revealed the presence in NGC 1904 of a considerably large number of fast (sin km/s) HB rotators, and confirmed the fast rotators already detected in M15 by B00b. In both cases, fast rotators were confined to the cool end of the blue HB, as in M13. In this paper, we add 5 more stars in NGC 2808, improving statistics on the cool side of the G99 jump for this cluster. We also discuss in detail the reduction and analysis techniques (Sections 2, 3 and 4). In addition, we present the position and the radial and projected rotational velocities for all the stars so far observed (Section 4). A brief discussion on the results (Section 5) is also included.
2 Observations and Data Reductions
We selected our targets from three different photometric data sets: the F439W and F555W HST-WFPC2 photometry by Piotto et al. (2002), the ground-based Johnson V, I photometry by Rosenberg at al. (2000), and the Johnson V,B,U data from Bedin et al. (2000). In addition, we have also identified the NGC 1904 targets in the Strmgren u, y photometry by G99.
The observations were carried out with the UVES echelle spectrograph, mounted on the Unit 2 (Kueyen) of the VLT, and the 2K x 4K, 15 m pixel size blue CCD, with a readout noise of 3.90 e- and a conversion factor of 2.04 e-/ADU. The UVES blue arm, with a spectral coverage in the 3730-5000 range, was used. Combined with a slit width of 1.0 arcsec, we achieved a resolution of R 40 000 (, 7.5 km/s, see the UVES user manual by Kaufer et al. 2003). We decided to use only the UVES blue arm because there were very few lines in the red arm spectral range useful for the measurement of stellar rotation, specially for the hottest stars. The spectra were obtained during 3 observing runs: July 30–August 2 2000, January 19–23 2001, and March 1–7 2002 (service mode). The exposure times range from 800 s (for V 16) to 8500 s (for V 18.5). We generally limited individual exposure times to 1500 or 2000 seconds, to minimize cosmic ray accumulation, and then coadded 2 to 4 frames per star. The typical signal to noise ratios,measured with the task splot within IRAF, are about 10 to 15 per pixel, but in some cases they achieve a value of S/N 20-30 (see Tables 2 and 3 for a detailed information). In general, all the targets lie in the low-crowding outskirts of the parent cluster, to avoid contamination from other stars. The isolation of the targets was checked directly, usingthe corresponding avaliable images of each cluster. During each observing run, we also collected high S/N spectra of a set of field rotational velocity standards (Peterson 1983), with spectral types close to those of our program stars: HD 74721 (sin 6 km/s), HD 130095 (sin 6 km/s), HD 213468 (sin 10 km/s), HD 117880 (sin=123 km/s), HD 19445 (sin=133 km/s), and HD 109995 (sin=273 km/s). Peterson (1983) used the cross-correlation technique to find these values, after a calibration with an artificially broadened spectrum of a non rotating HB field star, which was also chosen as the template (see Peterson 1983, Section IVe). The resolution of her observations was 8.50.5 km/s.
The spectra were extracted manually, trying to achieve the highest possible signal to noise. Standard IRAF procedures were used. For the wavelength calibration, ThAr spectra were obtained at the beginning and the end of each night. Thanks to its technical design, UVES is an instrument with a high stability and repeatability of calibrations both over short and extended periods of time. In addition, the spectrograph is placed at the Nasmyth platform minimizing flexure problems. Changes within a night of the atmospheric pressure and the temperature inside the enclosure were always smaller than 1 hPa and 1.5 C respectively, so the corresponding induced errors are 50 m/s and 250 m/s (see UVES user manual). This is empirically confirmed by the ThAr spectra taken at the beginning and the end of each night. The seeing disk values oscillated in the range 0.5 arcsec to 1.4 arcsec. As a consequence, the possibility that apparent stellar radial velocity could depend a little on the star’s position within the slit has to be taken into account, when the seeing profile was narrower than the slit. On the other hand, the wind speed was always 10 m/s so possible errors derived from guiding drift are always very small (a few hundreds of meters per second, see VLT documentation). Moreover, empirical tests on radial velocity performed on our data (cf. Section 3) confirm that there are not large vrad errors due to guiding drift.
We fitted 4th order polynomials to the dispersion relations of the ThAr calibration spectra, which resulted in residuals 310-4 . A mean of 4 to 5 lines per order were used for the polynomial wavelength solution, covering properly all the 31 orders.Each spectrum was divided into sections of about 40 , which, avoiding hydrogen lines, in general coincided with the echelle UVES orders. We also avoided the broad CaII K line at 3933 . Finally, each spectrum was normalized using a manual polynomial fitting.
3 Cross-correlation analysis
We determined the radial velocity (vrad) and the projected rotational velocity (sin) for each of our program stars using the cross-correlation technique described by Tonry & Davis (1979,TD79). This method is well suited to measure vrad and rotational broadening in low signal-to-noise spectra (Dubath et al. 1990). The analysis procedure computes (in the Fourier domain) the cross-correlation function (CCF) of the object spectrum versus that of a template, fits a Gaussian to the highest peak, and finds the radial velocity and the line broadening from the peak’s central position () and width (). If both spectra are very narrow-lined, there is little tolerance for radial velocity displacements, and the peak falls off rapidly; if one or the other is somewhat broad-lined, the falloff is gradual, and the correlation peak is broader. The cross-correlation procedure was performed using the task fxcor within IRAF. For the Gaussian fit of the CCF peak the parameters used were the center position, amplitude and width. Separate CCFs were computed for each spectral order. The heliocentric correction for each spectrum was also computed on the basis of its observational coordinates and time. We used the slow rotating (sin 6 km/s) blue HB field stars HD 74721 (vrad=30.7 km/s 0.6 km/s) and HD 130095 (vrad=66.0 km/s 0.7 km/s) as templates for the cross-correlation. Those CCFs for which the peak’s central position did not agree with the correct stellar radial velocity, relative to the template, were rejected. In general, we considered only those CCFs giving an object vrad in the range v 50 km/s, where v is the radial velocity of the corresponding globular cluster, as taken from Harris (1996) compilation. In this way, we avoided the errors due to line mismatch or to the lack of spectral features, especially for the hottest stars and the reddest sections of the spectra. A mean of 15 different CCFs could be used for each program star, each of them providing a value of and . In addition, using as the center position, the antisymmetric part of the correlation function is calculated, and its rms (a) is derived. This allows the calculation of the velocity error () via the “r” parameter, as described by TD79:
r
where h is the height of the cross-correlation peak, N is the number of bins in which the spectrum is mapped (2048 in our case) and B is the highest wave number where the Fourier transform of the CCF has appreciable amplitude (e.g. the half-maximum point).
To calculate the radial velocity of each program star, we computed the mean () of the values of all the good CCFs involving that star, weighted to the inverse of their errors (1/). The final v of the object star is:
v
where v is the most recent radial velocity of the template taken from the literature (Kinman et al 2000). Hence, the error:
(v) =
where is taken from Kinman et al. (2000) and is the rms scatter of the individual values. In order to take into account possible systematic errors on the vrad measurements induced by the adopted values of v, we have tested the internal consistency among the field stars used. Cross-correlations among all the spectra of the stars HD 74721 and HD 130095 observed (seven spectra for each star) confirm an agreement with Kinman et al. (2000) inside the errors and a consistency of 0.6 km/s among the standards.
Similarly, after the appropriate calibration, we obtained the sin for each target from the value of , as explained in the following section. Figure 2 shows an example of the CCFs obtained and fitted. The target star is n2808-2333, and the template is HD 74721. The corresponding normalized spectra sections are presented in Figure 3. The background level is always fixed at the zero value, on the complete range of the CCF to avoid the sensitivity of the results to details of the shape of the correlation function.
4 Projected rotational velocity measurements
The width () of the CCF of a star results from several broadening mechanisms which depend on, for instance, gravity, turbulence, magnetic fields, effective temperature, metallicity, rotation. In addition, the instrumental profile also contributes to the broadening of the spectrum and therefore to the CCF. Thus, in order to correctly measure the rotational contribution to the width of the CCF, we must model the contributions of the broadening mechanisms other than rotation, that is, calibrate the - sin relation for the instrument and the stars we are working with. In the case of a Gaussian fit of the CCF peak, the rotational broadening will correspond to a quadratic broadening of the CCF:
where is the width of the CCF, is the rotational broadening, and gives the non rotational contributions to the width of the CCF from both the object star and from the template, which we suppose to be equal (same spectral type and same instrumental broadening). Therefore, the projected rotational velocity sin is given by (Benz & Mayor 1984):
sin = (1)
where A is a constant coupling the differential broadening of the CCF to the difference in sin between the template and the object. The value of A in the previous equation was found by fitting a straight line to the relation, sin versus , for all the field standards of rotation, assuming 3 km/s for the rotation of the templates. The slope gives A. The best fit of the points, A = 1.8 0.3, was adopted (see Figure 4). The previous relation was observed to be linear in our range of interest, and even for faster rotation values, by Lucatello & Gratton (2003, see their Figure 2). This is also confirmed by the very low residuals ( 0.1) that we find by fitting the cross-correlation peaks with a Gaussian profile.
As explained by Melo et al (2001), there is also a smooth dependence on on the stellar colour and luminosity class. However, the variation of within the range of our program and template stars is expected to be quite small compared to the accuracy of our measurements ( 3-6 km/s), due to the relatively small number of lines and the low S/N for our spectra. Moreover, we have an error of 3 km/s in the sin values of the templates. For this reason, we decided to estimate the value of by correlating one template with the other, for each one of the orders used to measure the sin of the target stars. In other words, is equal to +, where and are the line widths of the templates, in this case HD 74721 and HD 130095. The value of changes very little with the echelle order used or the night of observation, and it has a mean value of 13.3 0.4 km/s. In order to test the consistency of the previous approximations, we have estimated the values of and from the autocorrelations of HD 74721 and HD 130095. As in the case of , and are quite constant with the order and the night of observation and the mean values determined are 12.8 0.3 km/s and 13.3 0.6 km/s. To avoid an underestimation on the error, we have cross-correlated different spectra of the same template, instead of autocorrelating an spectrum with itself. These results suggest that the sin value is quite the same for both templates, specially considering their similar atmospheric parameters (Kinman et al. 2000). Nevertheless, in the case of the hotter targets in our sample, we could be slightly overestimating their rotational rates if their were somewhat larger than the one of our templates. However, for stars with temperatures 11500 K, the absence of microturbulence and surface convection could, at least partially, compensate the previous effect. In any case, the overall effect is expected to be rather small compare to the accuracy of our measurements.
In order to derive the final sin for each program star, we calculated the mean of the sin values given by the individual determinations for all the good CCFs (15 on average) involving that star. We used as weight the height of the cross-correlation peak.
The error of each sin measurement can be obtained by differentiating Eq. 1:
sinsin
where and are the velocity errors for the CCF and the template to template CCF respectively. To this we have to add the systematic errors due to the uncertainty in the templates and the standards, which also affect the calibration curve. A first systematic error, sin, has been evaluated by re-calculating the sin of each object star assuming a sin for the templates of 0 km/s and 6 km/s. A second systematic, sin, error was derived by re-calculating the sin of the targets with A set to its and values. Thus, the total error on sin is:
sin
5 Results
The final results for a dataset of 61 stars in the clusters NGC 1904 (M79), NGC 2808, NGC 6093 (M80) and NGC 7078 (M15) are presented in Tables 4 and 5. For each target star (Column 1), the radial velocity (Column 2), and the projected rotational velocity (Column 3) are given. The three sources of error (random error, error due to the templates uncertainty, and error due to the calibration curve) are presented in Columns 4, 5 and 6. The total error, resulting from the quadratic addition of random and systematic errors is given in Column 7. The M79 Strmgren photometric data from G99 have been kindly provided by F. Grundahl. The NGC 2808 U, U-B photometry is from Bedin et al. (2000). The M80 and M15 photometry comes from Piotto et al. (2002), except for 5 stars in M80 and 3 stars in M15, taken from Rosenberg et al. (2000). In addition, the effective temperature has been derived by comparing the Cassisi et al. (1999) models with the corresponding colour-magnitude diagrams. We tested the consistency of the derived Teff values from different photometric colours comparing the Strmgren photometry of cluster M79 with a Johnson photometry by Momany et al. (2003, private communication). The temperature differences were always 1000 K.
The stars m15-b130 and m15-b218 are in common with B00b. Our sin measurements and B00b values for this two stars are in agreement within the errors (5 3 vs. 5.07 0.24 and 13 3 vs. 14.88 0.69), which reveals the consistency between both observations and the two independent methods applied for the rotational velocity measurement (B00 used a profile fitting method).
Figure 4 shows the complete set of projected rotational velocity data from 5 BT Galactic GCs: M79, NGC 1904, M80, M15 and M13. Besides the data from this paper (circles), Fig. 4 includes the B00b data for M15 (open triangles), plus the B00a (full triangles) and Peterson et al. (1995, full squares) measurements for M13.
As already pointed out in R02, all the stars hotter than Teff 11,500 K have sin 12 km/s, indicating that the bulk of these stars must be intrinsically slow rotators. At Teff 11,500 K (which is the temperature of the -jump of G99) there is an abrupt change in the rotational velocity distribution. Among the cooler stars (Teff 11,500 K), there is a range of rotation rates, with a group of stars rotating at 15 km/s or less, and a fast rotating group at 30 km/s. A few stars reach a projected rotation velocity of about 40km/s. As noticed by R02, the fraction of fast rotators is different in different clusters (cf. Fig. 1 and 2 in their paper), with fast rotators relatively more abundant in M13 and M79 than in the other clusters of the present sample. In M13 and M79, at least half of the stars cooler than Teff=11,500 K are fast rotators, while only 3 out of 22 stars rotate faster than 15km/s in M15. At the present time, no fast rotators have been identified in NGC 2808 and M80. Figure 5 shows the projected rotational velocities for the 16 target stars in NGC 2808, with the new stars presented in this paper added. All the newly observed stars are cooler than T11,500 K. Again, none of them has a projected rotation velocity higher than 13 km/s. However, on the cool side of the gap, we have rotation velocities for only 9 stars in NGC 2808 and 7 stars in M80. If the fraction of fast rotators in these two clusters is as low as in M15 (or lower), we might have missed them because of the small number of observed targets. The rotation rate distribution, and its variation from cluster to cluster must be studied. The advent of the multifiber spectrograph FLAMES at VLT will provide a unique opportunity to carry out this project. In particular, we plan to continue our study with new observations to increase statistics of rotational velocity measurements.
Figure 4 clearly suggests a link between the photometric G99 jump and the discontinuity in the distribution of the HB stellar rotation rates. Radiative levitation of metals has been invoked by G99 to explain the jump. Besides, the metal abundance anomalies (enhancements of metals, underabundance of He) found by Behr et al (1999) and B00b constitute an empirical evidence that radiative levitation and diffusion are effectively at work in the envelope of HB stars with K. As a consequence, R02 argue that the absence of fast rotators at K might be due to an increase of angular momentum removal caused by enhanced mass loss in the more metallic atmospheres of the stars hotter than the jump. An enhanced mass loss in highermetallicity atmospheres has been very recently calculated by Vink and Cassisi (2002), confirming this scenario. Radiative levitation and the “wind emission” effect is also the most likely explanation for the observed jump in the stellar gravities (Moehler et al. 2000, Vink and Cassisi 2002).
However, the real open problem is that we still lack of any plausible explanation for the presence of fast rotators (see discussion in R02).
Acknowledgements.
We thank L. R. Bedin, F. Grundahl and A. Rosenberg for gently providing their photometries. We are also grateful to S. Lucatello for useful discussions. We sincerelly thank the anonymous referee for the care and the interest dedicated to this work and the important contribution to the improvement of this paper. ARB recognizes the support of the Istituto Nazionale di Astrofisica(INAF). GP recognizes partial support from the Ministero dell’Istruzione, Università e Ricerca (MIUR), and from the Agenzia Spaziale Italiana (ASI).References
- Bedin (2000) Bedin, L. R., Piotto, G., Zoccali, M., Stetson, P.B., Saviane, I., Cassisi, S., & Bono, G. 2000, A&A, 363, 159
- Behr (1999) Behr, B.B., Cohen, J. G., McCarthy, J. K., & Djorgovski, S. G. 1999, ApJ, 517,L31
- Behr (2000a) Behr, B.B.,Djorgovski, S. G., Cohen, J. G., McCarthy, J. K., Ct, P., Piotto, G., & Zoccali, M. 2000, ApJ, 528, 849 [B00a]
- Behr (2000b) Behr, B.B., Cohen, J. G., & McCarthy, J. K. 2000b, ApJ, 531,L37 [B00b]
- Benz (1984) Benz W.& Mayor M. 1984, A&A, 138, 183
- Cassisi (1999) Cassisi, S., Castellani, V., degl’Innocenti, S., Salaris, M., & Weiss, A. 1999, A&AS, 134, 103
- Catelan (1998) Catelan, M., Borissova, J., Sweigart, A. V., & Spassova, N. 1998, ApJ, 494, 265
- Dubath (1990) Dubath, P., Meylan, G., Mayor, M. et al. 1990, A&A, 239, 142
- Grundahl (1999) Grundahl, F., Catelan, M., Landsman, W. B., Stetson, P. B., & Andersen, M. I. 1999,ApJ, 524, 242 [G99]
- Harris (1996) Harris, W. E., 1996,AJ, 112, 1487
- Lucat (2003) Lucatello, S. & Gratton, R.G., 2003, A&A, 406, 691L
- Melo (2001) Melo, C. H. F., Pasquini, L. & De Medeiros, J. R 2001, A&A, 375, 851
- Moehler (2000) Moehler, S., Sweigart, A.V., Landsman, W. B. & Heber, U., 2000, A&A, 360, 120
- Momany (2003) Momany, Y., 2003, private communication
- Peterson (1983) Peterson, R. C. 1983,ApJ,275,737
- Peterson (1985a) Peterson, R. C. 1985a,ApJ,289,320
- Peterson (1985b) Peterson, R. C. 1985b,ApJ,294,35
- Peterson (1995) Peterson, R. C., Rood, R. T., & Crocker, D. A. 1995,ApJ, 453; 214
- Piotto (1999) Piotto, G.,Zoccali, M.; King, I. R.;Djorgovski, S. G.; Sosin, C.; Rich, R. M.; Meylan, G., 1999,AJ, 118, 1727 [P99]
- Piotto (2002) Piotto, G.; King, I. R.; Djorgovski, S. G.; Sosin, C.; Zoccali, M.; Saviane, I.; De Angeli, F.; Riello, M.; Recio-Blanco, A.; Rich, R. M.;Meylan, G.; Renzini, A., 2002,A&A, 391, 945
- Nos (2002) Recio-Blanco, A., Piotto, G., Aparicio, A. & Renzini, A. 2002, ApJ, 572, 71 [R02]
- Renzini (1977) Renzini, A. 1977;in Advanced Stages in Stellar Evolution,Geneva Observatory, p.149
- Rosenberg (2000) Rosenberg, A., Piotto, G., Saviane, I., & Aparicio, A. 2000,A&AS,144,5
- Tonry (1979) Tonry, J., & Davis, M. 1979, AJ,84,1511
- Vink (2002) Vink, J.-S. & Cassisi, S. 2002 A&A
| Cluster | [Fe/H] | MV | (m-M)V | E(B-V) | log(rt/rc) | RGC (Kpc) |
|---|---|---|---|---|---|---|
| NGC 1904 | -1.37 | -7.86 | 15.59 | 0.01 | 1.72 | 18.8 |
| NGC 2808 | -1.21 | -9.36 | 15.56 | 0.23 | 1.77 | 11.0 |
| NGC 6093 | -1.43 | -8.23 | 15.56 | 0.18 | 1.95 | 3.8 |
| NGC 7078 | -2.12 | -9.17 | 15.37 | 0.10 | 2.50c | 10.4 |
 |
 |
 |
 |


| Star | u | (u-y) | S/N | log (Teff) | ||
|---|---|---|---|---|---|---|
| m79-489 | 05:24:10.6 | 24:32:46 | 17.861 | 0.516 | 11 | 4.184 |
| m79-535 | 05:24:16.6 | 24:31:59 | 18.075 | 0.607 | 15 | 4.158 |
| m79-555 | 05:24:15.8 | 24:30:36 | 18.183 | 0.631 | 14 | 4.151 |
| m79-434 | 05:24:16.6 | 24:31:37 | 17.782 | 0.859 | 10 | 4.095 |
| m79-469 | 05:24:08.2 | 24:32:13 | 18.004 | 0.897 | 11 | 4.086 |
| m79-392 | 05:24:13.4 | 24:30:25 | 17.684 | 0.939 | 30 | 4.076 |
| m79-363 | 05:24:13.4 | 24:31:26 | 17.879 | 0.982 | 15 | 4.065 |
| m79-389 | 05:24:16.3 | 24:31:30 | 17.781 | 1.075 | 13 | 4.043 |
| m79-354 | 05:24:07.9 | 24:32:17 | 17.929 | 1.294 | 10 | 3.991 |
| m79-366 | 05:24:15.4 | 24:31:26 | 17.987 | 1.378 | 14 | 3.971 |
| m79-297 | 05:24:17.2 | 24:30:18 | 17.852 | 1.394 | 9 | 3.967 |
| m79-327 | 05:24:14.0 | 24:29:54 | 18.000 | 1.574 | 10 | 3.924 |
| m79-281 | 05:24:27.2 | 24:29:16 | 17.958 | 1.609 | 8 | 3.916 |
| m79-298 | 05:24:21.6 | 24:28:59 | 17.967 | 1.615 | 10 | 3.914 |
| m79-289 | 05:24:17.5 | 24:31:23 | 17.957 | 1.635 | 9 | 3.910 |
| m79-295 | 05:24:02.0 | 24:31:35 | 18.016 | 1.648 | 15 | 3.906 |
| m79-275 | 05:24:17.9 | 24:30:40 | 17.970 | 1.723 | 8 | 3.889 |
| m79-243 | 05:24:19.6 | 24:32:26 | 17.959 | 1.725 | 13 | 3.888 |
| m79-294 | 05:24:18.9 | 24:31:49 | 17.999 | 1.754 | 10 | 3.881 |
| m79-209 | 05:24:16.2 | 24:32:16 | 17.852 | 1.797 | 16 | 3.871 |
| Star | U | (U-B) | S/N | log (Teff) | ||
| n2808-7596 | 9:11:24.9 | 64:52:46 | 17.714 | 0.785 | 7 | 4.453 |
| n2808-9432 | 9:12:23.8 | 64:52:08 | 18.219 | 0.666 | 8 | 4.363 |
| n2808-11222 | 9:12:53.6 | 64:51:05 | 18.370 | 0.591 | 7 | 4.314 |
| n2808-9655 | 9:11:59.8 | 64:47:45 | 18.287 | 0.532 | 9 | 4.277 |
| n2808-6427 | 9:11:41.6 | 64:49:16 | 17.574 | 0.371 | 7 | 4.185 |
| n2808-3159 | 9:12:12.2 | 64:58:23 | 16.967 | 0.157 | 7 | 4.081 |
| n2808-4512 | 9:11:18.7 | 64:57:14 | 17.136 | 0.149 | 9 | 4.077 |
| n2808-3715 | 9:12:25.9 | 64:55:13 | 17.003 | 0.081 | 8 | 4.049 |
| n2808-4991 | 9:11:24.2 | 64:49:59 | 17.294 | 0.057 | 11 | 4.039 |
| n2808-3721 | 9:11:58.1 | 64:57:09 | 17.092 | 0.004 | 10 | 4.016 |
| n2808-3435 | 9:12:18.3 | 64:49:37 | 16.999 | 0.026 | 15 | 4.008 |
| n2808-3841 | 9:11:49.8 | 64:57:30 | 17.043 | 0.044 | 20 | 4.002 |
| n2808-3949 | 9:12:17.2 | 64:46:41 | 17.077 | 0.068 | 7 | 3.993 |
| n2808-2333 | 9:12:23.4 | 64:52:00 | 16.804 | 0.174 | 22 | 3.957 |
| n2808-2445 | 9:11:42.3 | 64:52:51 | 16.853 | 0.290 | 25 | 3.872 |
| n2808-2909 | 9:12:03.9 | 64:49:27 | 16.904 | 0.150 | 20 | 3.965 |
| Star | F555W | (F439W-F555W) | S/N | log (Teff) | ||
| m80-509 | 16:17:05.2 | 22:58:47 | 16.622 | 0.216 | 12 | 3.946 |
| m80-820 | 16:17:08.2 | 22:58:30 | 16.684 | 0.209 | 14 | 3.953 |
| m80-1400 | 16:17:08.5 | 22:59:00 | 18.141 | 0.143 | 10 | 4.047 |
| m80-2044 | 16:17:05.8 | 22:57:54 | 16.998 | 0.141 | 12 | 4.053 |
| m80-2242 | 16:17:07.2 | 22:57:56 | 18.740 | 0.014 | 10 | 4.385 |
| m80-938 | 16:17:08.2 | 22:58:30 | 16.886 | 0.150 | 11 | 4.099 |
| V | (V-I) | |||||
| m80-107 | 16:17:02.5 | 23:02:25 | 16.88 | 0.221 | 10 | 4.049 |
| m80-109 | 16:17:00.1 | 23:00:44 | 16.86 | 0.232 | 10 | 4.034 |
| m80-83 | 16:17:17.9 | 22:58:27 | 16.57 | 0.270 | 11 | 3.988 |
| m80-1149 | 16:17:03.3 | 23:00:17 | 18.15 | 0.095 | 10 | 4.249 |
| m80-454 | 16:17:11.8 | 22:58:05 | 18.70 | 0.034 | 10 | 4.370 |
| Star | V | (B-V) | S/N | log (Teff) | ||
| m15-1813 | 21:30:03.8 | 12:10:26 | 16.04 | 0.124 | 16 | 3.930 |
| m15-5516 | 21:30:01.0 | 12:11:18 | 16.28 | 0.076 | 17 | 3.952 |
| m15-6143 | 21:29:59.1 | 12:08:37 | 16.21 | 0.084 | 18 | 3.954 |
| m15-2700 | 21:30:00.1 | 12:10:34 | 16.66 | 0.031 | 13 | 4.131 |
| m15-2917 | 21:29:57.9 | 12:11:08 | 15.98 | 0.119 | 15 | 3.926 |
| m15-3333 | 21:30:04.0 | 12:09:49 | 16.17 | 0.127 | 16 | 3.933 |
| m15-4047 | 21:29:59.0 | 12:11:10 | 16.15 | 0.110 | 16 | 3.935 |
| m15-4536 | 21:30:00.0 | 12:11:05 | 17.08 | 0.023 | 15 | 4.023 |
| m15-5168 | 21:30:00.0 | 12:08:45 | 16.88 | 0.022 | 15 | 4.108 |
| m15-768 | 21:30:03.8 | 12:10:46 | 16.94 | 0.011 | 14 | 4.086 |
| m15-817 | 21:30:02.8 | 12:10:30 | 17.04 | 0.010 | 16 | 4.078 |
| m15-b130 | 21:29:54.8 | 12:12:15 | 15.96 | 0.150 | 15 | 3.954 |
| m15-b218 | 21:29:45.6 | 12:11:25 | 15.99 | 0.160 | 17 | 3.908 |
| V | (V-I) | |||||
| m15-1048 | 21:30:03.3 | 12:12:02 | 16.79 | 0.027 | 16 | 4.058 |
| m15-699 | 21:29:47.0 | 12:09:51 | 16.63 | 0.064 | 14 | 4.035 |
| m15-788 | 21:29:49.5 | 12:12:37 | 15.94 | 0.239 | 15 | 3.904 |
| Star | sin | sin | sin | sin | sin | |
|---|---|---|---|---|---|---|
| (km/s) | (km/s) | (km/s) | (km/s) | (km/s) | (km/s) | |
| m79-489 | 196.1 0.9 | 5 | 4.7 | 2.3 | 0.3 | 5 |
| m79-535 | 199.2 0.8 | 13 | 2.8 | 0.3 | 1.7 | 3 |
| m79-555 | 201.5 0.9 | 8 | 4.0 | 1.3 | 0.8 | 4 |
| m79-434 | 207.3 1.0 | 3 | 2.5 | 3.0 | 0.0 | 4 |
| m79-469 | 202.6 0.8 | 3 | 2.6 | 3.0 | 0.0 | 4 |
| m79-392 | 204.3 0.8 | 6 | 4.8 | 1.9 | 0.5 | 5 |
| m79-363 | 198.7 0.8 | 10 | 3.7 | 0.7 | 1.2 | 4 |
| m79-389 | 195.8 0.9 | 5 | 4.5 | 2.3 | 0.3 | 5 |
| m79-354 | 209.0 1.3 | 5 | 4.5 | 2.3 | 0.3 | 5 |
| m79-366 | 205.1 1.1 | 7 | 2.4 | 1.7 | 0.7 | 3 |
| m79-297 | 202.2 1.7 | 20 | 2.4 | 2.6 | 2.8 | 5 |
| m79-327 | 204.2 1.6 | 24 | 3.6 | 4.0 | 3.5 | 6 |
| m79-281 | 213.1 1.8 | 5 | 4.5 | 2.3 | 0.3 | 5 |
| m79-298 | 214.2 2.2 | 26 | 3.6 | 4.6 | 3.8 | 7 |
| m79-289 | 205.5 1.8 | 22 | 1.8 | 3.3 | 3.2 | 5 |
| m79-295 | 208.2 1.1 | 26 | 1.8 | 4.6 | 3.8 | 6 |
| m79-275 | 206.5 2.9 | 27 | 5.6 | 4.9 | 3.9 | 8 |
| m79-243 | 207.1 0.6 | 16 | 2.8 | 1.3 | 2.2 | 4 |
| m79-294 | 208.9 1.5 | 20 | 2.6 | 2.6 | 2.8 | 5 |
| m79-209 | 199.1 0.4 | 3 | 2.7 | 3.0 | 0.0 | 4 |
| n2808-7596 | 101.6 5.4 | 6 | 6.3 | 1.8 | 0.6 | 7 |
| n2808-9432 | 104.5 3.5 | 6 | 5.7 | 2.0 | 0.5 | 6 |
| n2808-11222 | 105.7 2.6 | 6 | 5.6 | 2.0 | 0.5 | 6 |
| n2808-9655 | 106.3 1.7 | 7 | 6.8 | 1.7 | 0.7 | 7 |
| n2808-6427 | 102.7 1.4 | 6 | 5.7 | 2.0 | 0.5 | 6 |
| n2808-3159 | 102.4 1.2 | 5 | 4.8 | 2.3 | 0.3 | 5 |
| n2808-4512 | 101.1 1.0 | 8 | 4.7 | 1.3 | 0.8 | 5 |
| n2808-3715 | 101.3 1.2 | 4 | 4.4 | 2.5 | 0.2 | 5 |
| n2808-4991 | 102.9 1.2 | 5 | 4.8 | 2.3 | 0.3 | 5 |
| n2808-3721 | 101.6 1.2 | 6 | 5.7 | 2.0 | 0.5 | 6 |
| n2808-3435 | 114.5 1.4 | 11 | 4.5 | 0.3 | 1.3 | 5 |
| n2808-3841 | 96.4 1.2 | 13 | 3.4 | 0.3 | 1.7 | 4 |
| n2808-3949 | 103.3 1.3 | 8 | 5.6 | 1.3 | 0.8 | 6 |
| n2808-2333 | 109.4 0.6 | 5 | 4.8 | 2.3 | 0.3 | 5 |
| n2808-2445 | 85.7 0.4 | 5 | 4.7 | 2.3 | 0.3 | 5 |
| n2808-2909 | 105.6 1.2 | 10 | 4.7 | 0.7 | 1.2 | 5 |
| Star | sin | sin | sin | sin | sin | |
|---|---|---|---|---|---|---|
| (km/s) | (km/s) | (km/s) | (km/s) | (km/s) | (km/s) | |
| m80-509 | 7.9 0.5 | 7 | 3.7 | 1.7 | 0.7 | 4 |
| m80-820 | 8.6 1.1 | 8 | 5.8 | 1.3 | 0.8 | 6 |
| m80-1400 | 5.7 0.7 | 5 | 4.7 | 2.3 | 0.3 | 5 |
| m80-2044 | 23.5 0.5 | 8 | 3.6 | 1.3 | 0.8 | 4 |
| m80-2242 | 26.6 1.2 | 7 | 5.6 | 1.7 | 0.7 | 6 |
| m80-938 | 17.8 0.8 | 5 | 4.7 | 2.3 | 0.3 | 5 |
| m80-107 | 15.9 0.9 | 6 | 5.6 | 2.0 | 0.5 | 6 |
| m80-109 | 14.1 0.6 | 3 | 3.6 | 3.0 | 0.0 | 5 |
| m80-83 | 10.0 1.1 | 10 | 4.5 | 0.7 | 1.2 | 5 |
| m80-1149 | 18.3 1.4 | 9 | 5.7 | 1.0 | 1.0 | 6 |
| m80-454 | 0.7 1.0 | 4 | 4.2 | 2.5 | 0.2 | 5 |
| m15-1813 | 98.7 1.0 | 10 | 4.5 | 0.7 | 1.2 | 5 |
| m15-5516 | 99.0 1.2 | 12 | 3.6 | 0.0 | 1.5 | 4 |
| m15-6143 | 101.7 0.8 | 5 | 4.5 | 2.3 | 0.3 | 5 |
| m15-2700 | 148.0 0.9 | 7 | 5.8 | 1.7 | 0.7 | 6 |
| m15-2917 | 109.7 0.7 | 7 | 4.8 | 1.7 | 0.7 | 5 |
| m15-3333 | 91.9 1.6 | 12 | 4.5 | 0.3 | 1.5 | 5 |
| m15-4047 | 93.1 1.5 | 5 | 4.7 | 2.3 | 0.3 | 5 |
| m15-4536 | 101.9 1.2 | 4 | 4.2 | 2.5 | 0.2 | 5 |
| m15-5168 | 102.9 0.9 | 6 | 5.7 | 2.0 | 0.5 | 6 |
| m15-768 | 102.6 0.9 | 4 | 3.8 | 2.7 | 0.2 | 5 |
| m15-817 | 110.8 1.3 | 4 | 4.3 | 2.7 | 0.2 | 5 |
| m15-b130 | 113.9 0.6 | 5 | 2.5 | 2.3 | 0.3 | 3 |
| m15-b218 | 94.6 0.5 | 13 | 2.1 | 0.3 | 1.7 | 3 |
| m15-1048 | 101.2 0.6 | 11 | 3.7 | 0.3 | 1.3 | 4 |
| m15-699 | 103.2 2.7 | 23 | 3.4 | 3.7 | 3.3 | 6 |
| m15-788 | 103.0 0.7 | 7 | 4.8 | 1.7 | 0.7 | 5 |