A spectrophotometric study of RW Trianguli
On the basis of spectrophotometric observations we reconstruct the accretion disk of the eclipsing novalike cataclysmic variable RW Tri in the wavelength region 3600-7000Å. We find a radial temperature profile that is, on average, consistent with that expected on the basis of the theory of optically thick, steady state accretion disks and infer a mass-accretion rate in RW Tri of M⊙ yr-1. The line emission is dominated by two areas: one around the hot-spot region and one near the white dwarf. Both emission regions have appreciable vertical extension, and seem to be decoupled from the velocity field in the disk. In our observations RW Tri shows a number of features that are characteristic of the SW Sex sub-class of novalike stars. The appearance of a novalike system as a UX UMa/RW Tri or SW Sex star seems to be mainly governed by the mass-transfer rate from the secondary at the time of observation.
Key Words.:
accretion, accretion disks — binaries: eclipsing — Stars: individual: RW Tri —novae, cataclysmic variables1 Introduction
RW Tri is one of the earliest known cataclysmic variables (CVs), discovered by Protitch (1937). It has been studied extensively photometrically, but has been largely neglected in spectroscopic studies. To our knowledge only two extensive optical spectrophotometric studies, by Kaitchuck et al. (1983) and Still et al. (1995) have been made of this system. RW Tri is generally assumed to be a standard novalike CV (see Warner, 1995 for a general overview of CVs), but both spectroscopic studies have shown that the phase depedence and the light curves of the emission lines show features that are difficult to explain in a standard CV picture.
RW Tri was included in the broad-band photometry eclipse mapping studies of Rutten et al. (1992) who showed that the radial temperature profile of its accretion disk is consistent with the dependence expected on the basis of accretion disk theory (see e.g. Frank et al. 1992). RW Tri is in this respect similar to UX UMa that has been shown spectrophotometrically to follow the same temperature profile (Rutten et al., 1993; 1994).
RW Tri is also known to undergo irregular brightness variations of up to one magnitude in its out-of-eclipse brightness, as was first shown by Walker (1963). It has even been observed (Still et al., 1995) to be more than three magnitudes brighter than its ‘quiescent’ value at AB13.5. This irregular behaviour is not unique for RW Tri (see e.g. the recent results on GS Pav; Groot et al., 1998), although it is the best documented case.
2 Observations
On the nights of 22-26 October 1994, we obtained a total of 671 low-resolution (8Å) spectra using the Intermediate Dispersion Spectrograph with the R300V grating and a 1k1k TEK CCD, attached to the 2.5m Isaac Newton Telescope on the island of La Palma. A wide slit (25) and a second star on the slit (48′′ NW of RW Tri) were used to obtain differential photometry. For absolute flux calibration the spectral flux standard BD +28 4211 (Oke, 1990) was used with a 5′′ wide slit for the standard as well as for RW Tri and its comparison star.
All spectra were obtained with a 50s on-target integration time. With a 60s dead-time for CCD readout and data storage, we obtained an effective time resolution of 110s, or 1/182nd of the orbital period. A total of five eclipses were observed. Throughout the nights CuAr arc spectra were taken for wavelength calibration. All data were reduced in the standard fashion using the ESO-MIDAS package, with additionally written software and they were optimally extracted (Horne, 1986).
Based on the colour excess given by Rutten et al. (1992) of =0.1 we have dereddened all our spectra using the galactic reddening coeffcients given by Cardelli et al. (1990), assuming a standard =3.1.
3 Ephemeris and System Parameters
We have phase folded all spectra using the ephemeris given by Robinson et al. (1991). Trial eclipse maps using the system parameters given in Table 1 showed a phase shift in the phase of minimum light. Shifting the phases by –0.0046 of an orbital period, as has been found before by Smak (1995), corrected for this. A revised ephemeris is given in Eq. 1
| (1) |
The system parameters of RW Tri are rather uncertain, especially the () pair, where is the mass ratio (/) and the orbital inclination. Values for range between 67∘ (Kaitchuck et al., 1983) to as high as 80∘ (Mason et al., 1997), with the component masses varying accordingly. Previous studies agree that the mass ratio is close to unity. We have chosen to use the values as given in Rutten et al. (1992, see also Table 1).
| Period | 20034.717 s |
| MWD | 0.7 M⊙ |
| Msec | 0.6 M⊙ |
| Inclination | 75∘ |
| Distance | 330 pc |


4 Continuum light curves
The continuum light curves of RW Tri (Fig. 1) show that the system varied up to 30% in its out-of-eclipse light level from night to night. These short term variations of RW Tri have been long known (Walker 1963, Smak 1995). In our observations the system varied, at 4500Å, between AB=13.2 (18.5 mJy) on the night of October 23, to AB=12.9 (23 mJy) on October 26.
The light curves show the eclipse as the most prominent feature. As in other novalike systems, only a weak orbital hump is seen before the eclipse. The eclipse shape itself, however, does show a prominent hot-spot egress feature.
5 Spectral line behaviour
5.1 Average Spectrum
In Fig. 2 we show the average flux calibrated spectrum of RW Tri during our observations. The spectrum shows the usual emission lines of H i, He i and He ii. All lines appear single peaked in our low-resolution spectra. In the average, non hot-spot, non mid-eclipse, spectrum (middle curve in Fig. 2) we can see absorption troughs underlying the Balmer series, especially well visible in the higher members, H and higher. These troughs become deeper when the hot-spot is visible (top spectrum in Fig. 2). The red part of the spectrum shows the Earth’s atmospheric features at 6300Å and 6900Å.
5.2 Trailed spectra
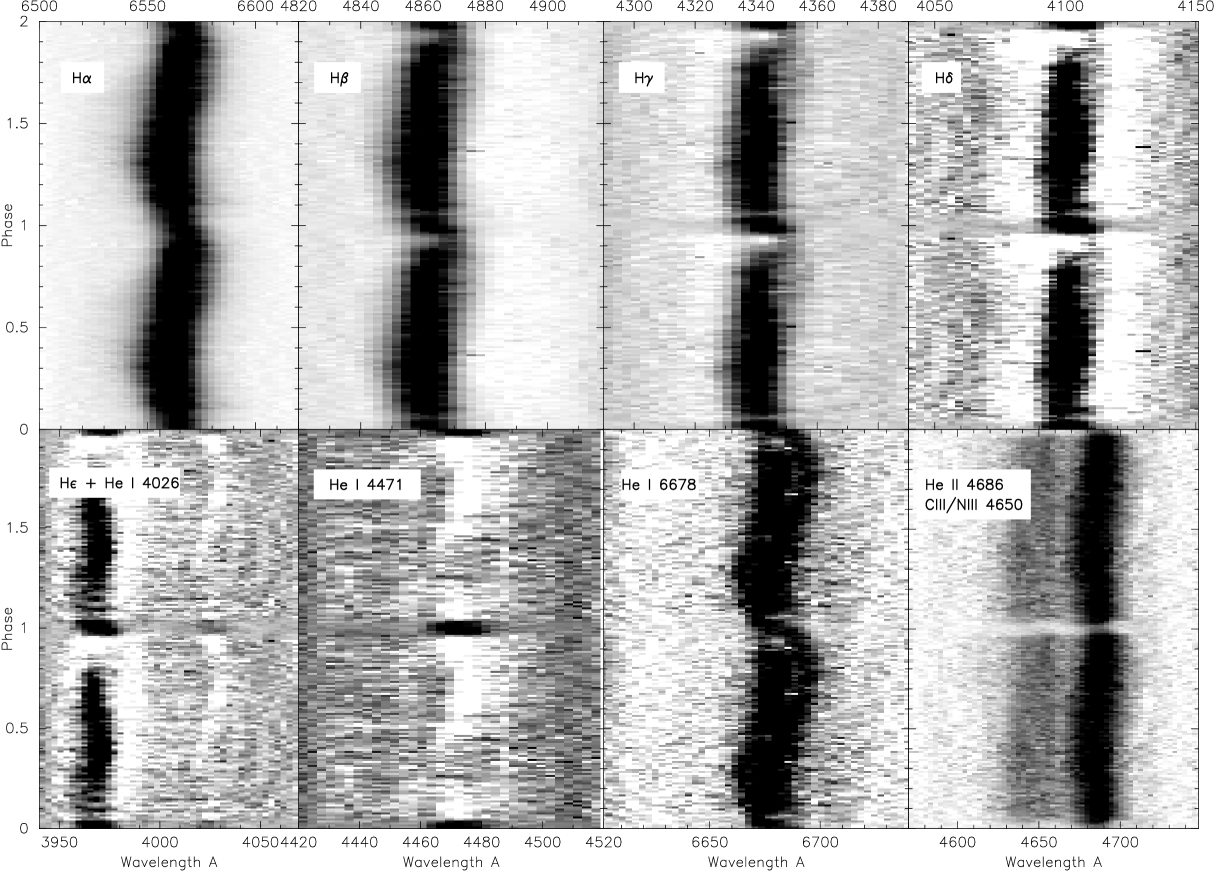
In Fig. 3 we show the trailed spectra of the main lines in RW Tri after having subtracted the continuum contribution by making a linear fit to the adjacent continuum.
In Fig. 3 we see that most of the lines consists of at least two components, best seen in the He i 6678 line. A component with very low radial velocity amplitude dominates the lower Balmer (H, H), the He ii 4686 and lower He i lines. In all these lines a second component, with higher radial velocity is also seen. It is this second component that is the only one seen, and in absorption, in the He i 4026 and 4471 lines. The lower He i lines show this component in emission. We will use the H and He ii 4686 lines to derive the phasing and amplitude of the low-velocity component since this component dominates in these lines. The He i 4471 absorption line will be used to derive the radial velocity and phasing of the higher velocity component. We will here make the assumption that the amplitude and phase of these two components is the same in all the lines.
5.2.1 Radial velocity curves
We have used an auto-correlation technique to determine the radial velocity curve of the low-velocity component dominating H and He ii 4686. In Fig. 5 we show the radial velocity curve and a sinusoidal fit to the phase interval 0.10.9. Both H and He ii 4686 show the same phase lag and radial velocity amplitude, indicating that they are formed in the same region. The phase lag shows that the emission site is not on the line of centers, connecting the secondary, the center-of-mass of the system and the white dwarf.
The radial velocity curve of He i 4471 (Fig. 6) shows that the high-velocity component is in anti-phase with the secondary star and has an amplitude of 330 km s-1.
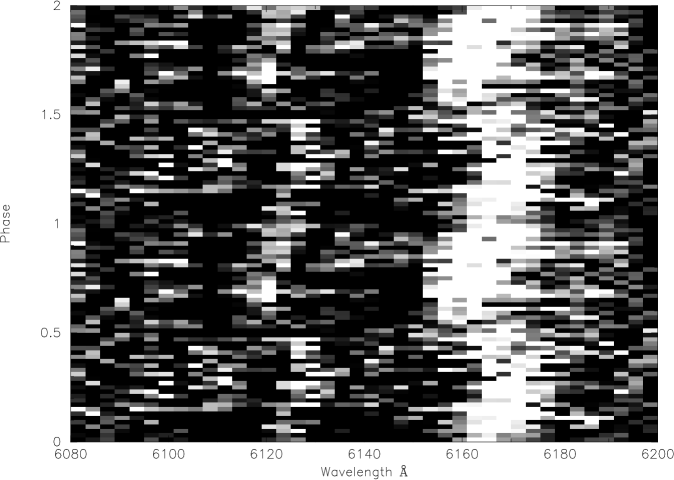
Smith et al. (1993) have shown the secondary to be a K7-type star. Among the most prominent lines in late K-type stars is the Ca i triplet at 6200Å.
In Fig. 7 we show a trailed spectrum of the region around 6160Å. We see that indeed there are absorption lines present, at 6160Å at 6120Å and a trace can be seen of a third line around 6100Å. These three wavelengths uniquely identify this set of lines as the Ca i triplet of 6102, 6122 and 6162.
We have determined the radial velocity curve of the secondary by auto-correlating the absorption profile of the 6162 line at all phases with the profile between phase 0.650.7 (Fig. 4). A sinusoidal fit to the phase interval 0.10.9 shows that the phasing of the line coincides with that of the secondary star and the derived amplitude is consistent with that derived by Smith et al. (1993) from the near infrared Na i lines. The strength of the absorption lines reaches a minimum between phase 0.450.55, caused by irradiation.

6 Line light curves
In Fig. 8 we show the light curves of the same lines as shown in Fig. 3 at a phase resolution of 0.01Porb. All lines show a similar behaviour, with the possible exception of He ii 4686. The light curve of this line, however, is very similar to that of the continuum. The decrease of light in the Balmer lines during eclipse is very moderate and much less pronounced than that of the continuum, which already indicates that most of the line emitting region remains visible during eclipse.
To explain in more detail the behaviour of the lines, we show an expanded view of the light curve of H, at 0.005 phase intervals, and a schematic view of the light curve in Fig. 9
Between phases 0.30.6 the light curve is roughly constant. At phase 0.65 a decrease in the line intensity starts. This decrease is part of a very wide (0.60.2), slightly skewed, V-shaped feature, that is centered on 0.95. This phase interval and its center coincides with the visibility of a radiating hot-spot on the rim of a geometrically thick accretion disk (e.g. as in IP Peg, Marsh, 1988; Groot, 1999). Marsh (1988) and Groot et al. (2001) have shown the hot-spot to be typically around 10 000 K, corresponding to a late B, early A-type spectrum. This spectral type is characterized by very strong absorption lines of the Balmer series. We therefore expect the hot-spot region in RW Tri to be the source of strong Balmer (and He i) absorption lines. We conclude that the broad V-shaped feature between 0.60.2 is due to the visibility of these strong absorption lines in the hot spot radiation.
Between phase 0.95 the line intensity increases again, and in the higher Balmer series (H and up) actually reaches emission levels that are higher than outside eclipse. This phase-interval coincides with the eclipse of the accretion disk, and we conclude that the rise in line intensity is due to the fact that the hot spot and accretion disk continuum, with its deep absorption lines, is eclipsed during this phase interval. That the intensities in the higher Balmer lines reach higher levels than outside eclipse is because their line strength is a combination of isotropic emission from an extended, optically thin, region, anisotropic absorption from the hot spot and isotropic absorption from the rest of the disk. During eclipse both absorption components are occulted, leaving solely the emission.
At phase interval the line intensity decreases slightly again. This is seen for H in Fig. 9, but the same behaviour is also shown by the other lines (as seen at lower phase resolution in Fig. 8). This short-lasting decrease can only be due to the eclipse of the emission site itself. The brief central dip is off-centered with the respect to the line connecting the secondary star with the white dwarf, very similar in phasing to the hot spot. We therefore conclude that the main emission region of both the Balmer lines as well as the Heii 4686 line and the Bowen blend is centered on the hot spot region, which was also concluded from the offset in the radial velocity curves.


7 Spectral Eclipse Mapping
For the eclipse mapping procedure, we used the run-combined light curve to obtain sufficient phase resolution and phase coverage. Analysis of the light curves showed that the profile of the eclipse of October 24 deviated in its shape from the rest of the eclipse profiles, especially in the steepness of the egress feature. This eclipse profile has therefore been excluded from the run-combined average.

We have straightened the out-of-eclipse profiles by fitting a spline curve to the phases –0.12 and 0.12, and also brought the light curves to a common scale, which was chosen to be the brightness of RW Tri on the first night at AB=13.0 at 4500Å.
The phase-resolved spectra of RW Tri have been divided in 80 narrow band light curves, each 40Å wide, except around the spectral lines, which were taken as single bins. In Fig. 10 we show the corrected light curves in three narrow band wavelength regions, spanning the wavelength range covered. We see that, despite the variation in the level of the out-of-eclipse light, the eclipse profiles themselves are very similar. The amount of scatter on the narrow-band light curves increases when going to the red. This is most likely caused by an inaccurate slit correction in the red part of the disk.
For the eclipse mapping reconstruction we have used a 5151 pixel map, phasebins of 0.005 in phase and the system parameters as given in Table 1.

7.1 Disk size
To measure the size of the accretion disk at different wavelengths we have used the distance (R0.1) where the intensity on the disk has fallen to 10% of the central intensity. This measure was used by Rutten et al. (1992) to compare the relative sizes of the disks in six different novalike systems. We find from our eclipse maps that R0.1 = 0.250.10R at 4420Å. The rather large error is caused by a relatively flat run of the reconstructed intensity with radial distance at this wavelength. For 6270Å the disk size has increased to R0.1 = 0.450.05R. Both values are comparable to the values found by Rutten et al. (1992) at 4410Å (R0.1=0.280.03R) and 8010Å (R0.1=0.430.03R).

7.2 Accretion disk annuli spectra
We have defined seven regions in the accretion disk of RW Tri, labeled ‘A’ through ‘G’ at radii of 0.1, 0.2, 0.3, 0.4, 0.5, 0.7 R and a hot-spot region ranging from 0.2-0.7 R and 0.80.03 (Fig. 11). The spectra of these regions are shown in Fig. 12. We see that there is a strong change in the slope of the spectrum from blue near the white dwarf to red in the outer parts of the accretion disk. No clear signature of any spectral lines (apart perhaps from the Balmer series in absorption in region ‘A’) is seen. Not surprisingly the non-eclipsed light (region ‘H’) shows the spectral lines (H , Hei 5875, H, He ii 4686, H and H) in emission on top of a continuum level that rises to the red.

7.3 Distance to RW Tri
In order to convert the reconstructed fluxes to specific intensities, from which temperatures can be derived by e.g. blackbody fitting, it is imperative to have a good estimate of the distance to the system. The distance of RW Tri was recently determined by parallax measurements using the HST Fine Guidance Sensor to be 34135 pc (McArthur et al., 1999).
The distance of RW Tri can also be estimated by allowing the distance as well as the temperature to vary in blackbody fits to the reconstructed accretion disk spectra. Blackbody fitting in the wavelength region 4000-6200Å gives a distance to RW Tri of 33040 pc, in excellent agreement with the parallax measurements and also with the estimate of the fractional contribution of the secondary by Rutten et al. (1992; 330 pc). We refer to McArthur et al. (1999) for a comparison with other distance estimates. We will use the value of 330 pc in the further analysis.
7.4 The radial temperature profile
To determine the radial temperature profile of the accretion disk we have used the wavelength region of 4000Å-6200Å, from which the emission lines have been eliminated. The blue cut-off has been chosen to avoid any influence of the Balmer jump and the red cut-off has been chosen because trial blackbody fits showed that the reconstructed intensities at these wavelengths strongly deviated from the expected values based on the trend in the bluer part of the wavelength which generally agreed well with the blackbody fits.

After the determination of the distance as described in the previous paragraph (33040 pc), we fixed the distance at this value and fitted only for the temperature. For this we have taken the spectrum at each pixel (in specific intensities) and fitted a temperature to this spectrum. We show the radial temperature profile of the accretion disk in RW Tri in Fig. 13, which also shows the theoretical predictions for the radial temperature profile based on optically thick, steady state accretion disks. To calculate these theoretical profiles we have used the white dwarf mass as given in Tab. 1 and the white dwarf mass-radius relation of Nauenberg (1972).
To determine the position of the hot-spot we have taken the ratio of the continuum intensity maps at 4060Å and one at 6270Å to maximize the constrast between the and blue hot-spot and the cooler outer disk. This ratio shows the position of the hot-spot to be centered on () of (0.5R,0.875).
8 Discussion
8.1 Continuum radiation from the eclipse maps: mass-transfer rate
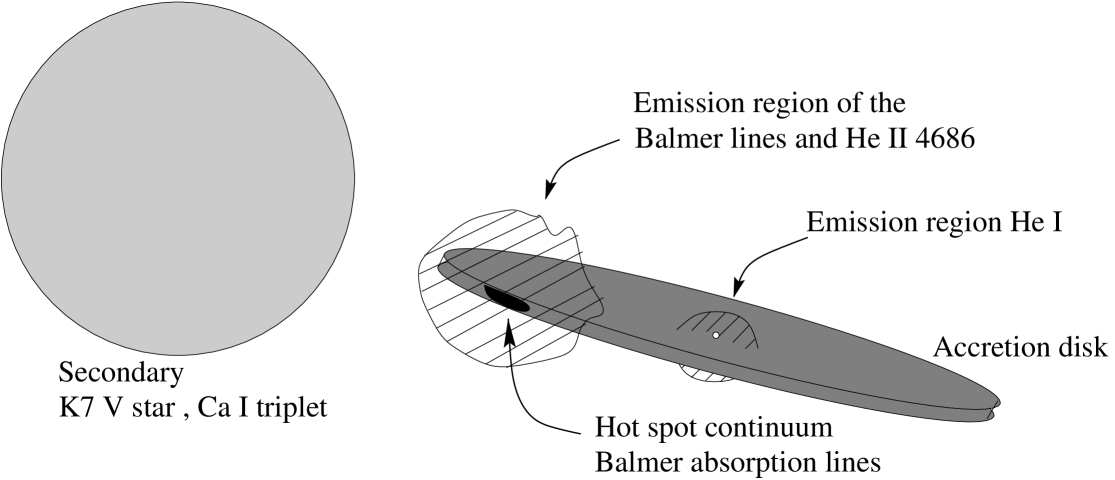
From the wealth of information RW Tri displays in our dataset we construct a conceptual model of the structure of RW Tri (see Fig. 14).
The accretion disk, although showing substantial variation on its radial temperature profile, on average follows the standard, steady state, T R-3/4, profile predicted from theory and observed in RW Tri before (Rutten et al., 1992), up until a radius of 0.15 R from the white dwarf, where the temperature profile flattens off. Comparing our temperature profile with those derived by Rutten et al. (1992) on the basis of four-colour photometry and by Horne & Stiening (1985) on the basis of brightness temperature estimates of their B band photometry, we see that our profile already levels off at a larger distance from the white dwarf (at 0.15R here and at 0.06R in Rutten et al., 1992 and Horne & Stiening, 1985.)
From the radial temperature profile between 0.2 - 0.56 R we deduce a mass-transfer rate through the disk of 10-8 M⊙ yr-1. This mass transfer rate is somewhat higher than in Rutten et al. (1992), but this is partly caused by the lower distance (270 pc) used in that study.

8.2 Line profiles: velocities and emission sites
The strong presence of emission lines in the uneclipsed light indicates that they are formed out of the plane of the disk.
The fact that during eclipse an emission component appears in He i 4026 and 4471, suggests that the absorption we see during most of the orbit is a combination of absorption and emission, where the absorption is caused by material close to the disk, which is back-lit by the white dwarf and surroundings, and the emission is caused by material higher above the disk, which is, in our line-of-sight, not back-lit by material behind it. This would also explain why the He i 6678 line is in emission, since this is the line with the lowest excitation level and therefore presumably the largest emission region.
In the trailed spectra the emission lines are characterized by a high and low velocity component. The phasing of the high-velocity component indicates that the component originates on the line of centers and on the white dwarf side of the center-of-mass. The amplitude is too low to be connected with any rotational velocity in the accretion disk (which is assumed to have a Keplerian rotation field, with a minimum velocity of 500 km s-1 in the outer regions of the disk). Considering both these two facts (no phase lag and an amplitude that is too low for rotation of the accretion disk) it appears that the white dwarf itself or its immediate surroundings is the place of origin of the high velocity component. In this case the (uncertain) amplitude of 330 km s-1 would reflect the orbital velocity of the white dwarf.
The radial velocity curve of the low-velocity component shows a significant offset with respect to the line of centers, and this phase lag puts is at the position where the hot-spot is located. The amplitude also coincides with the velocity of the hot-spot region in the binary frame. This means that both the gas at the emission site of the low-velocity component, as well as that at the emission site of the high-velocity component must be decoupled from the Keplerian flow in the disk.
Overall it appears that the spectral lines are dominated by two emission regions that both have appreciable vertical extension with respect to the disk. The most dominant of these region is located at the hot spot (located at (r,) = 0.5R, 0.875), as evidenced by the phase lag, radial velocity amplitude and light curve of the Balmer and He i emission lines. Also the He ii 4686 line (and the Ciii/Niii Bowen blend) is formed in this region, as evidenced by the identical radial velocity curves of H and He ii 4686. The marked difference in the H and He ii 4686 line light curves, where the H light curve shows a very broad absorption lasting from 0.60.2, whereas the He ii 4686 light curve is very similar to that of the continuum is caused by the fact that the hot spot is too cool to cause appreciable anisotropic He ii 4686 absorption, and the He ii 4686 light curve therefore shows ‘just’ the eclipse by the secondary star. Also, the He ii 4686 emission region is much smaller than the Balmer region, since no central emission is seen at mid-eclipse.
8.3 SW Sex behaviour
During our observations RW Tri showed some features that are commonly used as identifiers of the SW Sex sub-class of novalike CVs (see Thorstensen et al., 1991 and Groot et al., 2001): single-peaked emission lines, low amplitude radial velocity curves of the main Balmer lines, phase lags of the Balmer lines, shallow eclipses of the Balmer lines, a flat radial temperature profile and He ii 4686 emission. Although some of these indicators may be more hinted at in our observations than firmly proven, the combined occurence of these indicators raises the question whether RW Tri should be considered to be an SW Sex star.
Groot et al. (2001) showed that in recent observations of SW Sex in a low state, this system lacked some of the SW Sex features, e.g. the phase 0.5 absorption. Combined with the RW Tri observations presented here it appears that the boundary between UX UMa-, RW Tri- and SW Sex-like novalikes (see Warner 1995 for definitions) is vague and depends on the brightness of the system at the moment of observation. It appears that the behaviour that is ‘standard’ for the sub-classes are the extremes of a sliding scale, most likely depending on the mass-transfer rate, where the SW Sex behaviour becomes more prominent with increasing mass-transfer rate.
Acknowledgements.
PJG whishes to thank Alex de Koter for pleasant discussions on the line formation mechanisms in non-LTE regimes, and Claudio Moreno and the staff of the ING observatory for their hospitality during various visits. We would also like to thank the referee, dr. Bruch, for his very useful comments and Janet Drew for reading and commenting on the manuscript. PJG acknowledges partial support by NWO Spinoza grant 08-0 to E.P.J. van den Heuvel and an NWO-VIDI grant 639.042.201 to P.J. Groot. The Isaac Newton Telescope is operated by the Isaac Newton Group in the Spanish Observatorio del Roque de los Muchachos of the Instituto de Astrofísica de Canarias.References
- (1) Cardelli, J. A., Clayton, G. C. & Mathis, J. S., 1990, ApJ, 345, 245
- (2) Frank, J., King, A. R. & Raine, D., 1992, in Accretion Power in Astrophysics, Cambridge Astrophysics Series No. 21, CUP, Cambridge, UK
- (3) Groot, P. J., Augusteijn, T., Barziv, O. & Van Paradijs, J., 1998, A&A, 340, L31
- (4) Groot, P. J., 1999, PhD Thesis, University of Amsterdam
- (5) Groot, P. J., Rutten, R. G. M. & Van Paradijs, J., 2001, A&A, 368, 183
- (6) Horne, K., & Stiening, R. F., 1985, MNRAS, 216, 933
- (7) Horne, K., 1986, PASP, 98, 609
- (8) Kaitchuck, R. H., Honeycutt, R. K. & Schlegel, E. M., 1983, ApJ, 267, 239
- (9) Marsh, T., 1988, MNRAS, 213, 1117
- (10) McArthur, B. E., et al., 1999, ApJ, 520, L59
- (11) Mason, K. O., Drew, J. E. & Knigge, C., 1997, MNRAS, 290, L23
- (12) Nauenberg, M. , 1972, ApJ, 175, 417
- (13) Oke, J. B., 1990, AJ, 99, 1621
- (14) Protitch, M., 1937, Bull. Astr. Obs. Belgrade, 9-10, 38
- (15) Robinson, E. L., Shetrone, M. D. & Africano, J.L., 1991, AJ, 102, 1176
- (16) Rutten, R. G. M., Van Paradijs, J. & Tinbergen, J., 1992, A&A, 260, 213
- (17) Rutten, R. G. M., Dhillon, V. S., Horne, K., Kuulkers, E. & Van Paradijs, J., 1993, Nature, 362, 518
- (18) Rutten, R. G. M., Dhillon, V. S., Horne, K. & Kuulkers, E., 1994, A&A, 283, 441
- (19) Smak, J., 1995, ActA, 45, 259
- (20) Smith, R. C., Cameron, A. C. & Tucknott, D. S., 1993, in Cataclysmic Variables and Related Physics, O. Regev G. Shaviv, IoP, Bristol, p. 70
- (21) Still, M. D., Dhillon, V. S. & Jones, D. H. P., 1995, MNRAS, 273, 849
- (22) Thorstensen, J. R., Ringwald, F. A, Wade, R. A., Schmidt, G. D. & Norsworthy, J. E., 1991, AJ, 102, 272
- (23) Walker, M. F., 1963, ApJ, 137, 485
- (24) Warner, B., 1995, Cataclysmic Variable Stars, Cambridge Astrophysics Ser. 28, CUP, Cambridge, UK