Reflections of AGN Outbursts in the Gaseous Atmosphere of M87
Abstract
We combined deep Chandra, ROSAT HRI, and XMM-Newton observations of M87 to study the impact of AGN outbursts on its gaseous atmosphere. Many X-ray features appear to be a direct result of repetitive AGN outbursts. In particular, the X-ray cavities around the jet and counter jet are likely due to the expansion of radio plasma, while rings of enhanced emission at 14 and 17 kpc are probably shock fronts associated with outbursts that began years ago. The effects of these shocks are also seen in brightenings within the prominent X-ray arms. On larger scales, 50 kpc from the nucleus, depressions in the surface brightness may be remnants of earlier outbursts. As suggested for the Perseus cluster (Fabian et al.), our analysis of the energetics of the M87 outbursts argues that shocks may be the most significant channel for AGN energy input into the cooling flow atmospheres of galaxies, groups, and clusters. For M87, the mean power driving the shock outburst, ergs s-1, is three times greater than the radiative losses from the entire “cooling flow”. Thus, even in the absence of other energy inputs, outbursts every years are sufficient to quench the flow.
Subject headings:
galaxies: active - galaxies: individual (M87, NGC4486) - X-rays: galaxies1. Introduction
M87 (NGC4486) provides a unique laboratory to study the interaction between energy generated by a supermassive black hole and the hot intracluster medium. Its proximity allowed the disk surrounding its active nucleus to be resolved by HST providing a measure for the mass of the central black hole of M⊙ (Harms et al. 1993, Ford et al. 1994, Macchetto et al. 1997). M87’s proximity also provides a unique view of its jet, detected in optical, X-ray, and radio (e.g., Sparks, Biretta, & Macchetto 1996, Perlman et al. 2001, Marshall et al. 2002, Harris et al. 2003).
M87 is the central elliptical in the rich Virgo cluster and is surrounded by an extensive gaseous atmosphere with a mean temperature of keV (Mathews 1978, Bahcall & Sarazin 1977, Fabricant & Gorenstein 1983, Böhringer et al. 2001, Matsushita et al. 2002). X-ray structure in the gaseous halo of M87 was first reported by Feigelson et al. (1987) using Einstein Observatory observations. Using ROSAT and XMM-Newton observations, Böhringer et al. (1995), Churazov et al. (2001) and Belsole et al. (2001) discussed the relationship between the observed X-ray structure and the radio emission.
Like many other optically luminous galaxies at the centers of clusters, M87 has been considered to be a classic example of a “cooling flow” system, where the gas cooling time is relatively short compared to the age of the system (e.g., Stewart et al. 1984, Nulsen & Böhringer 1995, Böhringer et al. 2001). However, observations with XMM-Newton have shown that cooling flows, like that around M87, deposit cooled gas at much lower rates than expected in the standard cooling flow model (Fabian 1994; Peterson et al. 2003 and references therein). This requires considerable energy input to compensate for radiative losses. M87, with its proximity, its active nucleus, jet, and extensive system of radio lobes, provides an ideal system for studying the energy input from the AGN to the hot, cooling gas.
Using radio studies, Owen, Eilek & Kassim (2000; see also Binney 1999) pioneered the view that the mechanical power produced by the supermassive black hole at the center of M87 was more than sufficient to compensate for the energy radiated in X-rays. Tabor & Binney (1993) and Binney & Tabor (1995) developed models without mass deposition and included energy injection from the central AGN. Heinz, Reynolds & Begelman (1998; see also Reynolds, Heinz & Begelman 2001) modelled shock heating of the IGM by an expanding radio source. Churazov et al. (2001; see also Kaiser & Binney 2003, Bruggen 2003, De Young 2003, Kaiser 2003) argued that the morphology of the X-ray and radio observations could be explained by radio emitting plasma bubbles buoyantly rising through the hot X-ray emitting gas. These buoyant bubbles could uplift the coolest gas and provide energy input as bubble enthalpy is converted to kinetic energy, then thermalized into the gas in the bubble wake.
The results outlined above relied primarily on pre-Chandra observations of M87 that lacked sufficient angular resolution to allow detailed comparison to the radio structures shown in the Owen et al. (2000) study. Young, Wilson & Mundell (2002) used a 37 ksec Chandra observation to confirm previous structures, as well as to describe several new features including two nearly spherical “edges” at and that they attribute to activity in the nucleus associated with jet production. The Chandra images also show cavities and filaments in the eastern and southwestern X-ray arms. Young et al. argued that the arms were overpressurized and multi-temperature. Molendi (2002) used XMM-Newton observations to show that the X-ray arms required two-temperature models with gas temperatures in the range keV and keV.
In this paper, we combine deep Chandra, ROSAT HRI, and XMM-Newton observations to study the impact of AGN outbursts on the gaseous atmosphere around M87 and the interaction of the radio emitting plasma with the hot gas. As others have noted, the Chandra, XMM-Newton, and ROSAT HRI observations show rich structure on many angular scales. These include knots in the jet, surrounding cavities, a coincident X-ray and radio bubble just budding from the southeast of the radio core region, a weak shock, filaments and cavities in the east and southwest arms, and an arc-like region of enhanced emission coincident with the outer edge of the southern radio halo. In this paper, we describe the X-ray observations and discuss the origin of these features in M87.
2. Observational Details
M87 has been well studied at all wavelengths as well as by each new X-ray mission. Here, we describe our analysis for Chandra, XMM-Newton, and the ROSAT HRI. X-ray observations were obtained from the Chandra, XMM-Newton, or HEASARC archives. While Chandra provides unprecedented angular resolution, XMM-Newton and the ROSAT HRI yield large FOV images to study the larger scale structures around M87. We adopt a distance for M87 of 16 Mpc (Tonry et al. 2001) which yields a scale of 4.65 kpc per arc minute.
For all analyses of radial distributions, projections, and spectra, point sources were detected and then excluded (231 for Chandra) as was the bright M87 nucleus and jet.
2.1. Chandra
M87 was observed with Chandra on 29-30 July 2000 (OBSID 352) and 6-8 July 2002 (OBSID 2707) for 37 ksec and 105 ksec respectively with ACIS-S at the focus. Details for the July 2000 and July 2002 observations are given by Young et al. (2002) and Jordan et al. (2003) respectively. The July 2002 observation was used by Jordan et al. (2003) to analyze the point source population of M87. We applied standard screening to the event list, omitting ASCA grades 1, 5, and 7, known hot pixels, bad columns, and chip node boundaries.
Because the Virgo cluster is both bright and extended, we used the ACIS S1 chip to monitor the instrument background rate in the energy band 2.5-6.0 keV (see Markevitch 2001). We found significant background flaring in both observations and the corresponding time intervals were removed. The remaining exposure times for OBSID’s 2707 and 352 were 87.9 ksec and 30.0 ksec for a total observation time of 117.9 ksec. For all imaging analyses, we generated images, exposure maps, and backgrounds separately and then combined the results in sky coordinates. We normalized the exposure maps between frontside and backside illuminated CCD’s, assuming the emission was characterized by thermal emission from hot gas with keV. For spectral analyses, we extracted spectra separately from each observation and fit the spectra jointly in XSPEC. Response matrices and effective areas were averaged by weighting by the observed X-ray emission.
2.2. XMM-Newton
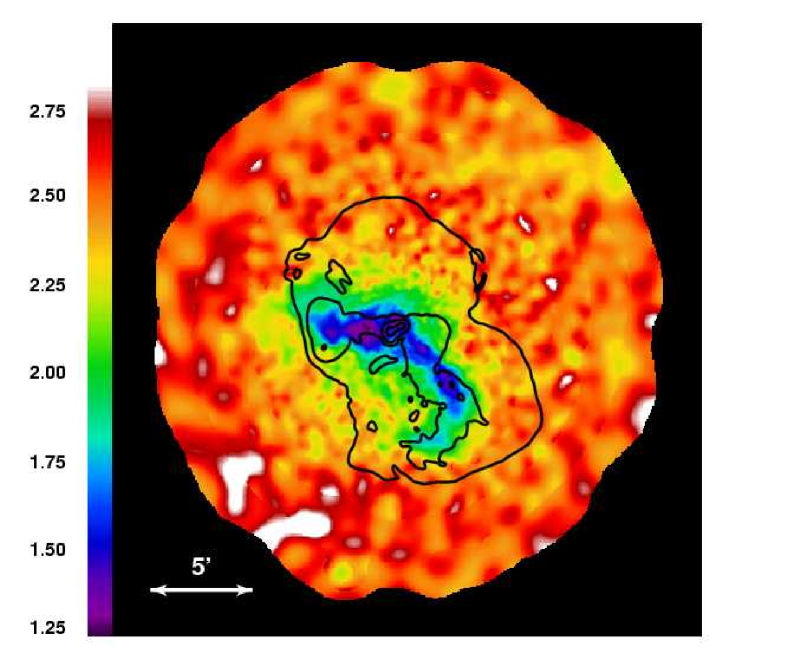
XMM-Newton observed M87 for 57.4 ksec on 19 June 2000. Details for this observation are given by Bohringer et al. (2001) and Belsole et al. (2001). We report on results obtained with the MOS instrument. Calibrated event lists were generated using SAS v5.3. The MOS background was calculated using the blank field data accumulated over a large number of observations (Lumb et al. 2002) For analysis, we used MOS data with patterns in the range 0-12 and the recommended value of the flag (XMM_EA). For generating the temperature map, we use one of the MOS response matrices provided by the XMM SOC and assume that the same response (corrected for energy dependent vignetting) is applicable for all regions. The gas temperature map was calculated as described by Churazov et al. (1996; see also Churazov et al. 2003 for this method applied to XMM-Newton data for the Perseus cluster). An adaptive smoothing also is applied to the map so that each value of the temperature is calculated using regions containing counts. Comparison of the overall structure with the results of direct spectral fitting of individual regions shows good agreement.
2.3. ROSAT HRI
M87 was observed seven times with the ROSAT HRI between 1992 and 1997 (ROSAT sequence numbers rh700214, rh702081, rh704000, rh701712, rh702774, rh701713, rh702775) for a total observation length of 171.6 ksec. A detailed description of the ROSAT HRI observations is given by Harris, Biretta & Junor (1997) and Harris et al. (2000). We generated images from each observation using PHA channels 3-9 to reduce the instrumental background and improve the signal-to-noise for the diffuse emission. The images were then summed for further analysis.
3. X-ray Imaging
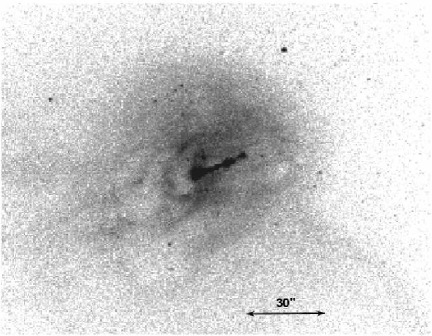
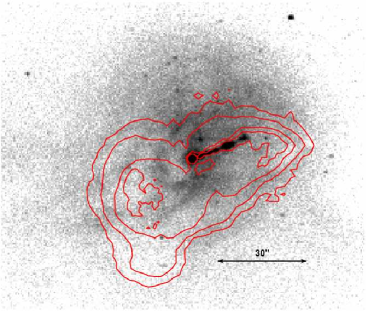
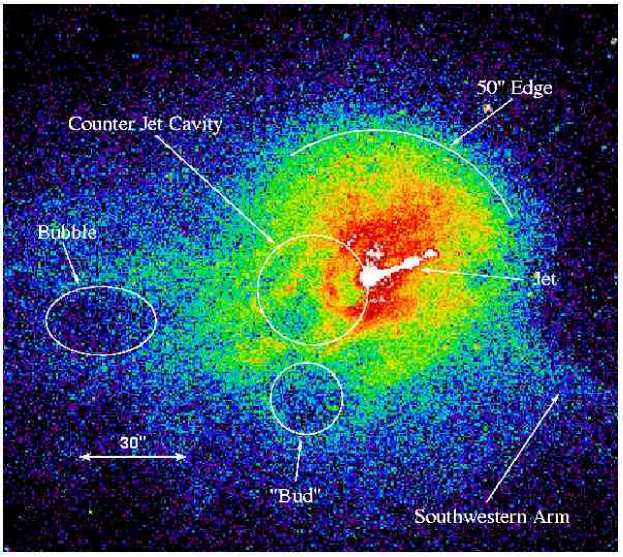
X-ray images of the two merged M87 Chandra observations are shown in Fig. 1 and 2. Fig. 1a shows the central region at full resolution (1 pixel ) in the energy band 0.5-2.5 keV. Fig. 1b covers a slightly smaller region and includes 6 cm radio contours. Fig. 1c labels the features discussed in the text below. Fig. 2 is an adaptively smoothed image. On the smallest scales, Fig. 1 and Fig. 2 show:
-
•
The well-known X-ray jet extending from the nucleus with the brightest emission coming from the nucleus and knot A, and showing emission from at least seven knots (Marshall et al. 2002, Harris et al. 2003).
-
•
X-ray cavities surrounding the jet (including one surrounding the location of the unseen counterjet) with an overall extent described as an ellipse with semi-major and semi-minor axes respectively of and oriented along the jet direction (approximately west northwest) and coincident with the bright radio emission seen at 6 cm (see Fig. 1b). The radio lobe cavities, particularly the counterjet cavity, are delineated by bright rims of X-ray emission.
-
•
An X-ray cavity (with a radius of about ), delineated by a bright X-ray rim, coincident with radio emitting plasma “budding” from the southeast of the 6 cm radio lobes.
-
•
An X-ray bright core region, surrounding the 6 cm radio lobes, with a radius of approximately with more pronounced emission to the north (overexposed region in Fig. 3). Young et al. (2002) suggested that an edge at 3.9 kpc radius arises from sound waves driven by nuclear activity. Alternatively, this structure could originate either as a cold front (see the XMM-Newton temperature map in Fig. 6) or as a sheath of cool material surrounding the cocoon. The southern edge of the radio cocoon is bounded by a bright X-ray rim (just south of the outermost radio contour in Fig. 1b).
-
•
At least four cavities (typical scales of ) extending into the eastern arm with associated filamentary structures that surround them.
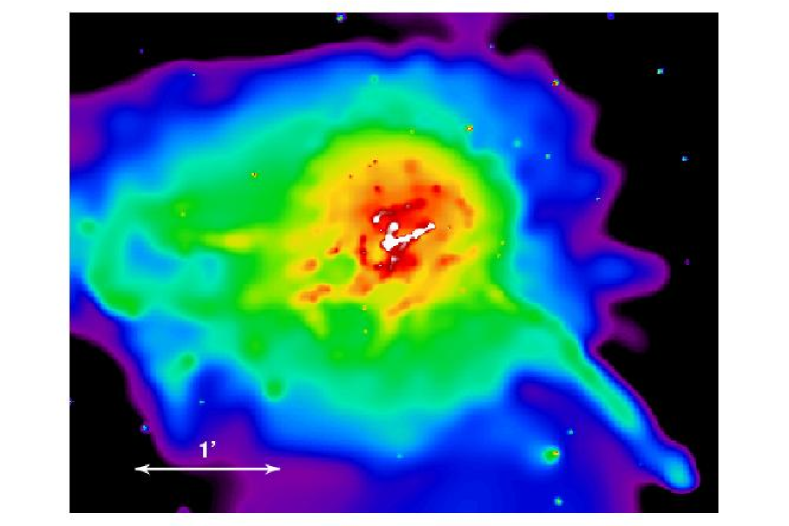
To study the emission on larger scales, we have used the Chandra ACIS-S2 and S3 CCD’s as well as the ROSAT HRI and XMM-NEWTON observations of M87. The Chandra large-scale image was prepared by 1) extracting the 0.5-2.5 keV images from each pointing, 2) generating “exposure” maps (accounting for vignetting, quantum efficiency, and bad pixel/columns/gaps with an assumed keV thermal spectrum to normalize the front and back side CCD chips), 3) smoothing (Gaussian of ) each of the images and exposure maps, 4) dividing each image by its exposure map and 5) summing the two flat-fielded images. The resulting Chandra image is shown in Fig. 3.
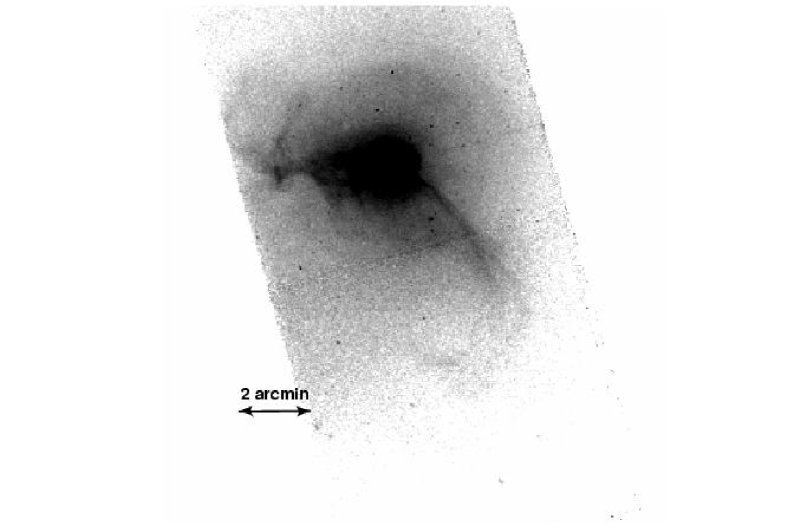
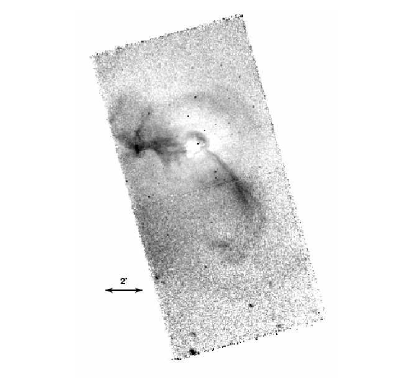
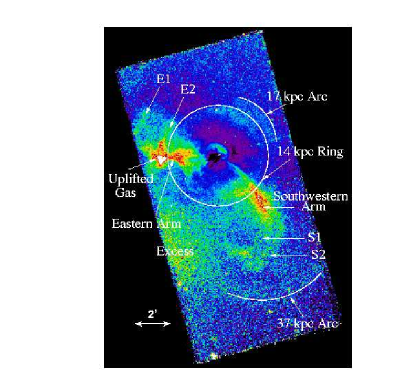
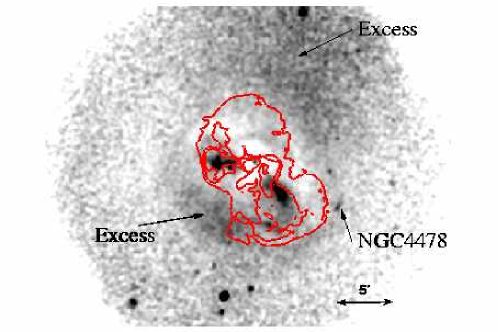
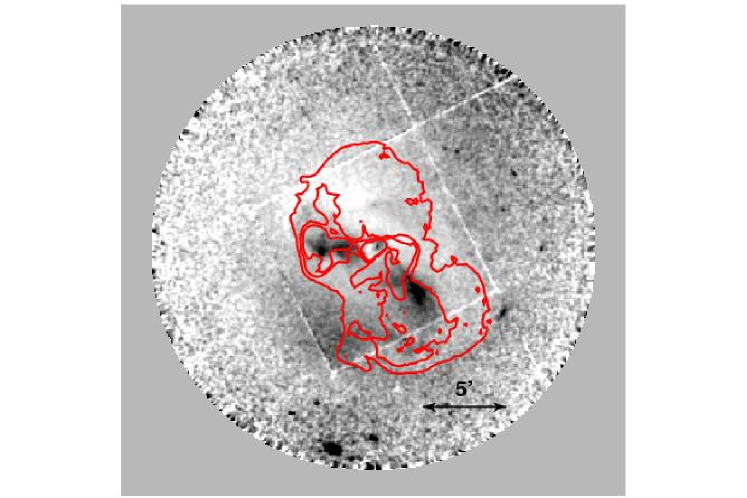
To enhance the view of the faint asymmetric structures, we processed the Chandra, XMM-Newton and ROSAT images to remove the large scale radial surface brightness gradient. Fig. 4 and Fig. 5 show the relative deviations of the surface brightness from a radially averaged surface brightness model (-model for Chandra and ROSAT and an azimuthal average for XMM-Newton) i.e. . These images show evidence on large scales for buoyant bubbles and energetic outbursts powered by the supermassive black hole in the M87 nucleus. These features, outside the core, are labeled in Fig. 4b and Fig. 5. The features include:
- •
-
•
a second partial ring of enhanced emission, just beyond the 14 kpc ring, at a radius of 17 kpc, most prominent at azimuths of ∘ from west (see Fig. 4) that we also interpret as a shock
-
•
the prominent eastern and southwestern arms that brighten significantly at approximately the radius of the 14 kpc ring
- •
- •
- •
4. XMM-Newton Temperature Map
The XMM-Newton temperature map with its large field of view and high signal to noise (compared to Chandra) is shown in Fig. 6 and is consistent with the discrete temperature fits performed by Molendi (2002; see also Belsole et al 2001). The continuous nature of our map clearly shows some of the large scale structures. The eastern and southwestern arms are distinctly cooler than the surrounding gas, although we found no abundance differences between the arms and the ambient M87 atmosphere. The temperature map shows, at least as clearly as the surface brightness map, the clockwise rotation to the east of the southwestern arm.
Perhaps the most striking feature of the temperature map is the similarity of the eastern and southwestern arms. In particular, the temperatures are similar and at the end of the arms, when they start to deviate from the approximately linear structure, each bends clockwise.
5. Analysis and Interpretation
We discuss the origin of prominent X-ray features seen in the Chandra, ROSAT HRI, and XMM-NEWTON images in terms of energetic outbursts from the supermassive black hole at the M87 nucleus. Previous authors have provided ages for the eastern and southwestern arms and buoyant bubbles ( years; Churazov et al. 2001) and the outer radio lobes ( years; Owen et al. 2000). We note that while we describe the outer radio lobes as buoyant bubbles, they must be continuously resupplied with energetic particles as Owen et al. (2000) have emphasized.
5.1. Gas Density and Temperature Deprojection
To obtain ambient gas density and pressure profiles (see Fig. 7), we deprojected the X-ray surface brightness and gas temperatures in a sector north of the nucleus at azimuths (from north) between and , a region chosen for its relative absence of asymmetric structure. The deprojection is standard (Nulsen et al. 2002), except for the handling of weights for the outermost region. Because the outer edge of the region is well within the cluster, a model was needed to allow for cluster emission beyond the deprojected volume. This was done by assuming that the surrounding gas is isothermal, with a power-law density profile (, that accurately matches the profile from , see Fig. 7c). The outermost ring was assumed to represent emission from the surrounding gas and its weight was determined accordingly in the spectral deprojection.
5.2. X-ray Core and Inner Radio Lobes
The inner radio lobes, the cocoon region, originated in an episode of recent activity. We can use the X-ray observations to estimate the energetics associated with their formation. The counterjet cavity is well-described as an ellipse with semimajor-axes of and on the plane of the sky (see Fig. 1c). Using the innermost gas temperature of 1.65 keV from our deprojection (Fig. 7), and assuming the transverse expansion of the cavity is subsonic, we estimate that its age is more than years. The one-sidedness and super-luminal motion of the jet suggest that its path is close to our line-of-sight. If the axis of the cavity makes an angle of 20∘ to the line-of-sight (Biretta, Sparks & Macchetto 1999), then the head of the cavity is advancing at km s-1. If the cavity is years old, the average speed of the head of the cavity is mildly supersonic.
If the cavity is prolate and lies in the plane of the sky, its volume is . Using the pressure for the innermost ring of our deprojection (centered at a radius of ), gives erg. If the cavity is relativistic (and the presence of the synchrotron emitting plasma strongly argues in favor of this), then its enthalpy is , otherwise it is . Correcting for the 20∘ angle between the line-of-sight and the axis of the cavity increases the volume of the cavity by a factor and shifts the center of the cavity to larger radius by the same factor. At this position, the gas pressure is 2.6 times smaller, so that our estimate of the enthalpy is only slightly altered, based on the assumption that the pressure inside the cavity is uniform (due to the high sound speed of the relativistic gas). Note that the fact that the external pressure changes over the extent of the cavity implies that the configuration must be dynamic – either parts of the lobe far from the nucleus (where the external pressure is lower) are overpressured and thus expanding into the gaseous atmosphere, or the inner parts, close to the nucleus, are underpressured, and thus collapsing, or both. The maximum overpressure of a factor of 2.6 would imply that the head of the cavity is advancing at a Mach number of 1.5. Since the cavity itself is likely oriented close to the line of sight, it is quite possible that the assumption of sphericity breaks down in the inner bins and that the derived pressure is therefore an overestimate. In either case, a detailed hydrodynamical model is needed to make a more accurate estimate of the enthalpy, but it is unlikely to increase over our estimate by more than 50%, and certainly not by more than a factor of 2.6. Doubling the calculated enthalpy to allow for the jet cavity to the west, the total enthalpy of these cavities is erg. Additional radio emitting plasma and X-ray cavities surround the jet cavities. Therefore, given the bubble formation time calculated below, this material is probably produced in the current outburst as well. Including this material would at most double the total enthalpy of the radio plasma from the outburst.
5.3. Azimuthal Rings
5.3.1 The 14 kpc () and 17 kpc () Rings
The 14 kpc ring is the clearest example of a shock-driven feature in M87. Although most prominent to the north and west, it is seen over nearly 360∘ in azimuth centered on the M87 nucleus (Fig. 4). As described in section 5.1, we measured the surface brightness and temperature profiles in a sector north of the nucleus. The deprojected gas density profile is shown in Fig. 7, along with the deprojected gas temperature. If we identify the inner radio lobes with the piston that drives this shock, since they are small compared to the volume encompassed by the expanding front, the event that drove the shock may be treated as instantaneous. If the shock is expanding into a spherically symmetric medium, it will become increasingly spherical, regardless of the shape of the initial outburst. Thus we model the outburst required to generate the 14 kpc ring by assuming that energy is injected in a single event into the atmosphere by the central AGN. Our estimate of the outburst energy is robust to varying details of the actual outburst. Before the passage of the shock, the gaseous atmosphere is hydrostatic and isothermal, with a power law density profile , chosen to match the surface brightness profile immediately outside the shock. We derived the parameters of the outburst by matching calculated surface brightness profiles to that observed and verifying that the temperature data were consistent with those calculated. The model that best matches the data is characterized by an energy deposit of ergs about yrs ago and is shown in Fig. 7 (right panel) compared to the observed surface brightness distribution. The shock is mildly supersonic, with ( km s-1). A weak temperature enhancement at the position of the ring (Fig. 7) is consistent with the calculated model (as is the slight temperature reduction inward of the shock). Although the temperature evidence is not strong, the remarkably spherical appearance of this feature is compelling evidence that it is a weak shock driven by the AGN. This description for the formation of the 14 kpc ring is similar to that of Ruszkowski et al. (2003) in which impulsive energy injection generates weak shocks as the injected energy forms a cocoon in the galaxy atmosphere in the Virgo core. We note that the time estimate, years, for the onset of the activity that gave rise to the 14 kpc ring is robust and the simple model gives this age to an accuracy of about 10%.
A second partial ring is seen to the west at a radius of 17 kpc () extending over ∘ in azimuth (see Fig. 4c). To form this surface brightness enhancement, a disturbance traveling at the sound speed would have originated approximately years before the event that created the 14 kpc ring. The amplitude of the 17 kpc ring is comparable to that of the 14 kpc ring and therefore would require a similar amount of injected energy. The timescale between the two events lies well within the range, – yrs, expected for repetitive AGN outbursts.
In our shock model for the 14 kpc and 17 kpc rings, one or both may be associated with the inflation of the inner cocoon. This is consistent with radio source models in which the radio outburst commences with rapid expansion, driving a shock. As the expansion slows, the shock separates from the driver, weakens and becomes more spherical (the “sonic boom phase” in Reynolds, Heinz, & Begelman 2001). The current energy input by the jet is estimated to be ergs s-1 by Bicknell & Begelman (1996). Owen et al. (2000) used the radio observations to derive a minimum value of the instantaneous energy input by the jet of a few ergs s-1. The energy input is more than sufficient to power the lobes and generate a roughly spherical pulse.
The spherical shock model provides an estimate of the total energy in the outburst. This energy is significantly greater (a factor of 3 or more) than the enthalpy of the cavities also created by the AGN outburst (see section 5.2). This suggests that shocks may be the most significant channel of AGN energy input into “cooling flow” atmospheres in early type galaxies, groups, and galaxy clusters. Fabian et al. (2003) find similar shocks and “edges” around NGC1275 in the Perseus cluster. They also argue that the energy deposited as these features dissipate can compensate for the energy radiated by the cooling gas in the inner 50 kpc core. For M87, the mean power of the shock outburst averaged over the past years is . Within 70 kpc, the radiative loss from the “cooling flow” is ergs s-1 (corresponding to 10 M⊙ yr-1; Stewart et al. 1984). Thus, one such outburst every years is sufficient to quench the cooling flow in the absence of any other heat source. In addition to the energy input from the outburst we have modelled, energy is also being supplied by the buoyantly rising features seen in the radio maps (Churazov et al. 2002).
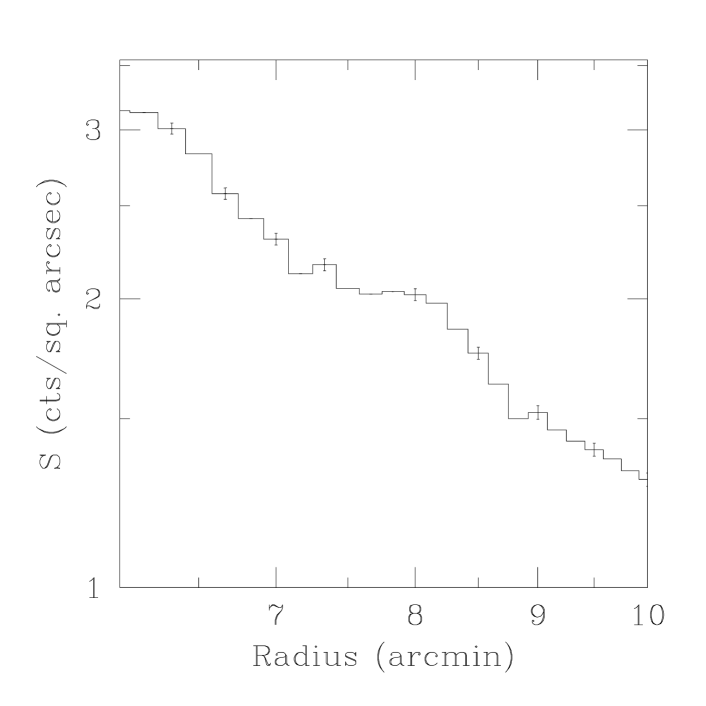
5.3.2 Southern 37 kpc () Arc
South of the nucleus at a radius of 37 kpc (), a surface brightness enhancement appears as an arc or partial ring in observations by Chandra, ROSAT HRI, and XMM-Newton (see Fig. 4 and Fig. 5a, b). This partial ring extends over an azimuth of at least 45∘. Statistically, its significance is shown in the radial profile in Fig. 8 made from the Chandra image. As Fig. 5 shows, the southern 37 kpc arc lies just outside the large scale radio lobes characterized by Owen et al. (2000) as the oldest ( yrs) structures in M87. In the model by Churazov et al. (2001), these radio lobes were originally buoyant bubbles that have risen in the gaseous atmosphere surrounding M87 and are now thin disks (“pancakes”) seen in projection. Each yr old bubble is partially surrounded by gas that has been displaced by the bubble’s rise. This gas could be material piled up on the edge of the bubble during its expansion or alternatively, gas that was uplifted by the bubble and is draining off the bubble along its sides. The XMM-Newton spectra show that the gas associated with this feature has a similar temperature ( keV) but high abundance ( of solar for an APEC model) compared to other gas at the same radius (0.4-0.5 of solar).
Rims of cool gas are a common feature of cavities created by radio lobes (e.g. Finoguenov & Jones 2001, McNamara et al. 2000, Fabian et al. 2002, Blanton et al. 2001). In M87 we see rims most clearly in the bright edge of the counterjet cavity, the southeastern “bud”, and the southern edge of the outer radio lobes. The presence of bright rims over such a wide range of scales illustrates the ability of the radio plasma to exclude hot gas and attests to their surprising stability (Nulsen et al. 2002).
At the western end of the 37 kpc arc, a brightness enhancement is seen in both the XMM-Newton and ROSAT HRI images (Fig. 5a, b). This feature is extended from northwest to southeast (, 2.3 kpc, in length) and is likely associated with a Virgo cluster member, the E2 galaxy NGC4478 (RA=12:30:17.4, DEC=+12:19:43) that is coincident with the X-ray feature. The X-ray luminosity of the galaxy is ergs s-1 and its optical absolute magnitude is (for a distance of 16 Mpc). The X-ray and optical luminosities are consistent with the correlation for the emission from hot gas in early type galaxies (e.g., Forman, Jones & Tucker 1985). David, Forman & Jones (1991) showed that early type galaxies with would be transitioning from atmospheres with partial to total subsonic winds, assuming a supernova rate of 0.15 SN Ia per per century (van den Bergh, Maclure & Evans 1987). If the supernova rate in NGC4478 is slightly less than this assumed value or if some fraction of the supernova energy is not transferred to the hot atmosphere, then NGC4478 could maintain a barely stable atmosphere. Such an atmosphere could be ram pressure stripped in the dense Virgo core, producing the extended X-ray emission seen in the ROSAT HRI and XMM-Newton images. Thus, most likely, we are observing the gaseous halo of an elliptical galaxy being stripped by the atmosphere around M87 and the feature is probably not associated directly with the southern arc.
5.3.3 Large Scale Surface Brightness Asymmetries
On the largest scales, the XMM-Newton and ROSAT images (Fig. 5a, b) show surface brightness enhancements and depressions outside the outer radio lobes and beyond the 37 kpc arc. In particular, in 30∘ wide sectors at a radius of kpc, the surface brightness in the ROSAT HRI has a maximum 18% above the mean in the northwest and a minimum 10% below the mean in the southwest. At somewhat smaller radii, Fig. 5 shows higher surface brightness to the southeast, just beyond the outer radio lobe.
Some of these asymmetries could arise from an elliptical gravitational potential or they could result from subtracting an azimuthally symmetric model for the surface brightness from an elliptical distribution. Alternatively, such an asymmetrical distribution could arise from “ghost cavities” (e.g., Ensslin 1999) of relativistic plasma, produced by earlier epochs of AGN activity, but no longer emitting at observable radio frequencies. The outer radio lobes are approximately years old and, as Owen et al. (2000) argued, their detection requires ongoing energy injection. Any older cavities, at larger radii, may no longer have a connection to the nucleus and, hence, would no longer be detectable at radio wavelengths.
5.4. A Budding Bubble
In most systems, X-ray cavities or radio plasma bubbles generally are consistent with having been directly filled by an active jet and are aligned with the jet axis or lie on opposite sides of the active nucleus. Clear examples of such alignments include a wide variety of systems ranging from galaxies with very modest gaseous atmospheres like Cen A (Kraft et al. 2003) and M84 (Finoguenov & Jones (2001) to rich luminous clusters including Hydra A (McNamara et al. 2000, David et al. 2001, Nulsen et al. 2002), and Perseus (Böhringer et al. 1996, Fabian et al. 2002).
While many of the inner X-ray structures in M87 are clearly aligned along the direction of the M87 jet axis, the southeastern bubble (extending from to from the M87 nucleus) is an exception (see Fig. 1). This bubble corresponds precisely to a radio feature and appears as a “bud” emanating from the southeast of the bright radio core. Fig. 1b shows the X-ray image with the 6 cm radio contours superposed (Hines, Owen & Eilek 1989). The surrounding X-ray emission traces the outline of the outer radio contour and shows that the X-ray cavity is filled with radio emitting plasma.
The “bud” emanates from the inner radio cocoon (just south of the cavity corresponding to the counterjet), almost perpendicular to the axis defined by the jet. While its origin is likely associated with an outburst from the active nucleus and an episode of energy injection into the inner cocoon, the location of the bubble may mark a magnetically weak region of the inner cocoon (the counterjet cavity) with buoyancy forces driving the bubble perpendicular to the dominant axis of recent activity.
If we assume that the rise of the budding bubble (radius , 0.85 kpc) is governed by buoyancy and limited by the drag of M87’s hot gaseous atmosphere, we can estimate the formation time, , as the time for the bubble to rise through its own diameter. If is the distance from the cluster center to the current position of the bubble and is the total gravitating mass within , then
| (1) |
where we have used (), the projected distance from the cluster center, and (Côté et al. 2001). is the drag coefficient for a roughly spherical bubble. Since the actual distance to the cluster center almost certainly exceeds the projected distance, this gives a lower limit for the rise time. Furthermore, according to (1), the speed of the bubble, , exceeds half of the sound speed and so is overestimated. Thus its rise time is underestimated, even if the budding bubble lies in the plane of the sky.
During its rapid initial expansion, the boundary of the bubble will generally be stable. As a result, the motion of the bubble boundary generally needs to be subsonic before a bubble even starts to form. This adds a further delay to after the outburst, but before the bubble is formed. If we do associate the budding bubble with an energetic nuclear event, then the constraints on its formation timescale make it quite reasonable to associate it with the current outburst (associated with the jet) that commenced about years ago.
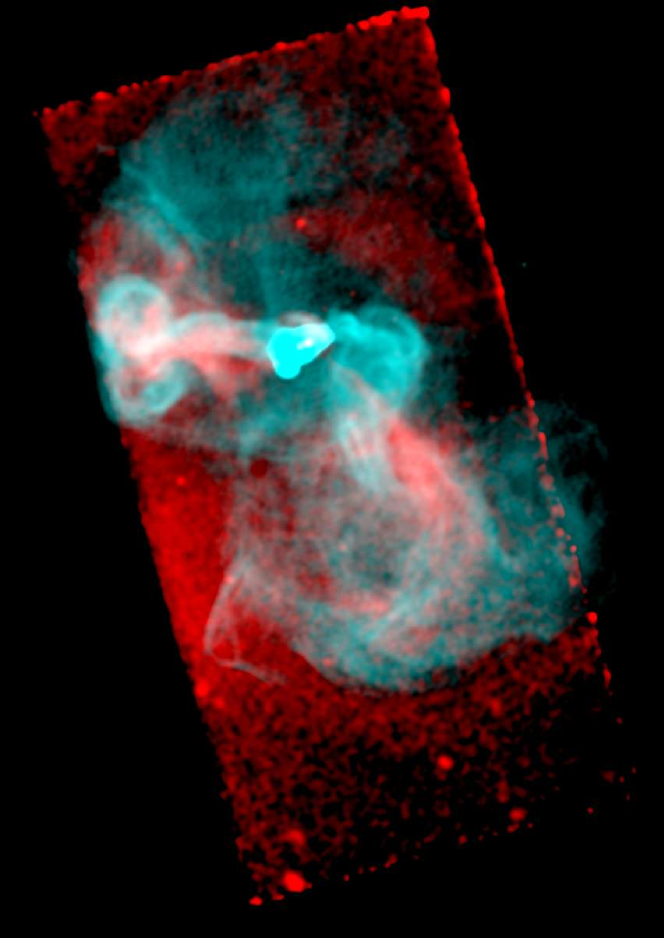
5.5. Buoyant Bubbles and the Structure of the Eastern and Southwestern Arms
The most striking X-ray features in M87 are the two arms that extend east and southwest from the inner lobe region. These also are seen in the 90 cm image (see Fig. 11 for a composite X-ray-radio view of M87). Previous spectroscopic studies of the arms have utilized the XMM-Newton observations (Belsole et al. 2001, Molendi 2002). They find that the arms are cool and portions are poorly fit by single temperature components. Our Chandra results agree with these previous analyses, as does the XMM-Newton temperature map (Fig. 6). We find that the arms require at least two components (with variable abundances, VMEKAL or VAPEC) with the low and high temperature components in the range 1-1.5 keV and 2-2.7 keV respectively. Although the two arms are likely related to the same outburst, we discuss each separately.
5.5.1 Eastern Arm
The eastern X-ray and radio arm begins at the eastern edge of the inner radio cocoon, but its appearance is much more amorphous than that of the southwestern arm (see Fig. 1, 3, and 4). At the base of the filament (Fig. 1 and 2) are at least four bubbles with sizes comparable to that of the “bud” discussed above and streamers of gas bounding these buoyantly rising bubbles. Typical bubble sizes are (0.8 kpc) in radius and are reminiscent of the “effervescent” heating described by Begelman (2003). Fig. 9 shows a projection across one of these “effervescent” bubbles (5.8 kpc) east of the M87 nucleus (labeled “bubble” in Fig. 1c).
The temperature structure (Fig. 6) of the eastern arm shows X-ray features that are consistent with cool material uplifted by a rising torus (Churazov et al. 2001). First, the largest concentration of the coolest gas lies midway along the eastern arm ( from M87’s nucleus). Second, the cool gas column in the eastern arm narrows at the edge of the radio torus closest to the M87 nucleus and then broadens within the torus (labeled “Uplifted Gas” in Fig. 4b), just as one might expect for gas uplifted by a buoyant toroidal plasma bubble (see Fig. 11 and Fig. 3 and 4 in Churazov et al. 2001).
A projection along the arm, Fig. 10, shows a 25% brightening at the radial distance of the 14 kpc ring. A similar brightening occurs at about the same angular distance on the southwestern arm. While the feature in the southwestern arm is partially obscured by the change from the ACIS S3 to S2 chip in the Chandra image, it is clearly seen in both the ROSAT HRI and XMM-Newton images (Fig. 5). If this brightening is associated with the passage of the same shock that produced the ring, then this arm (and the southwestern arm as well) must lie close to the plane of the sky.
If this brightening does arise from the passage of the shock, it is likely that the so called “radio ear”, the vortex-like structure that forms the end of the bright eastern radio filament (see Fig. 11), falls between the shocks associated with the 14 kpc and 17 kpc rings. This could alternatively explain the flat, ring-like appearance of this radio feature, since passage of a shock through a bubble of relativistic plasma embedded in a background of cold thermal material will induce strong vorticity in the plasma, turning it into a ring-like structure (Ensslin & Bruggen 2002). Combined with the effect of vorticity creation in buoyantly rising bubbles described by Churazov et al. (2001), this could account for the rather filamentary appearance of this feature.
At the end of the eastern arm ( east of the M87 nucleus), the X-ray image (Fig. 4) shows an almost circular enhancement (radius of centered at RA=12:31:05.397 DEC=+12:25:10.01) extending to the north (beyond the northern “ear” of the radio emitting torus). This circular feature is bounded on three sides by X-ray enhancements (see Fig. 4) which originate at the eastern arm and it is bounded to the northwest by a pair of radio arcs (best seen in the 90 cm image; see Fig. 11). The X-ray temperature of this circular region is intermediate in temperature (1.8-1.9 keV) as seen in Fig. 6 and is comparable to that of the end of southeastern arm (as it swings to the east). The two enhancements, labeled E1 and E2 in Fig. 4c), which bound the circular region, appear similar to the two filaments into which the southwestern arm divides (see below). We suggest that the outer portions of the eastern arm are similar to the southwestern arm, but seen from a different orientation.
5.5.2 Southwestern Arm
The southwestern X-ray arm originates (see Fig. 1 and Fig. 2) as a narrow filament of width approximately (0.8 kpc) at its narrowest when it exits from the bright inner core (at a distance of , 3.9 kpc from the nucleus). The filament extends in an almost straight line to the southwest for (9.3 kpc). As seen in Fig. 11, over this distance it appears uncorrelated with the radio filament that extends in approximately the same direction. At a distance of about (15.8 kpc), the X-ray filament bifurcates (the two sections are labeled S1 and S2 in Fig. 4c). and the correspondence between the radio plasma and X-ray gas becomes more direct. The brightest radio emission lies between the two X-ray arms as they both rotate clockwise in the plane of the sky and eventually turn due east.
Young et al. (2002) suggested that the arms are overpressurized. Assuming the southwestern arm is a cylinder lying in the plane of the sky, we find that the pressure in the arm is roughly twice that of the hotter ambient gas. We found no elemental abundance differences that could explain the surface brightness enhancement in the arms. However, the pressure difference seems unphysical, since the time for the pressure to come to equilibrium (the sound crossing time of the arm) is short compared to the sound travel time along the length of the narrow arm. Therefore, the axis of the arm would need to make a sufficiently small angle with our line-of-sight (roughly 15∘) to make its projected path length about 4 times its width, in order to account for its high emission measure. This seems unlikely, given that the brightening along the arm is at a comparable radius to that of the eastern arm and both are at a radius similar to that of the 14 kpc () ring. However, in computing the overpressure of the arm, we did not include any contribution to the external pressure from non-thermal particles or from magnetic field which could contribute to the confinement. Magnetic tension could also serve to confine the gas in the southwestern arm since the radio emission from the southwestern arm appears to spiral around the X-ray gas (see Fig. 11). Alternatively, the southwestern arm may not be formed by rising bubbles as seen in the eastern arm, but is instead a thin sheath of gas exterior to a large plasma bubble related to the southwestern radio arm. This is consistent with a roughly 20% increase in surface brightness from west to east across the arm.
6. Conclusions
We have presented a discussion of several of the remarkable structures seen in the Chandra, XMM-Newton, and ROSAT HRI observations of M87. Many of these, particularly the bubbles emanating from the central region, the nearly circular rings of enhanced emission at 14 kpc and 17 kpc, and the brightening of the X-ray arms at these radii, can be attributed to AGN outbursts. The 14 kpc and 17 kpc rings, similar to the “ripples” seen in the Perseus cluster (Fabian et al. 2003), can be interpreted as shock waves driven by the current outburst that began about years ago. The outburst also inflated the inner radio lobes (and cocoon). Outbursts like those that produced these shocks can quench the M87 cooling flow, if they occur approximately every years. Since the enthalpy associated with the inner cavities, produced by the outburst, is only 30% of the energy of the outburst, shock heating is probably the dominant heating mechanism for the gas in the inner regions of “cooling flow” systems.
At larger radii, we see highly enriched gas along the outer edge of the southern radio lobe (the 37 kpc arc). Asymmetric gas distributions at radii of 50 kpc may be evidence for older ( years) outbursts as are the outer radio lobes.
The hot X-ray emitting gas contains reflections of previous episodes of AGN activity in the form of bubbles and their bright rims, shocks, and buoyantly uplifted gas structures. With the detailed observations at X-ray and radio wavelengths of M87, we can probe the interaction between the central AGN, the relativistic plasma, and the X-ray gas. We are beginning to understand the cyclic heating of the X-ray gas and the energy transfer mechanisms between the central supermassive black hole and the hot gaseous atmosphere that surrounds central cluster galaxies.
References
- (1)
- (2) Bahcall, J. & Sarazin, C. 1977, ApJL, 213, L99
- (3) Belsole, E. et al. 2001, A&A, 365, L188
- (4) Begelman, M. 2003, astro-ph/0303040
- (5) Bicknell, G. & Begelman, M. 1996, ApJ, 467, 597
- (6) Binney, J. & Tabor, G. 1995, MNRAS, 276, 663
- (7) Binney, J. 1999, in “Proceedings of the Ringberg Castle Workshop, 15-19 September 1997 (eds. Roser & Meisenheimer), Springer (New York), 116
- (8) Biretta, J, Sparks, W., Macchetto, F. 1999, ApJ, 520, 621
- (9) Blanton, E. L., Sarazin, C. L., McNamara, B. R., & Wise, M. 2001, ApJ, 558, L15
- (10) Böhringer, H., Nulsen, P., Braun, R. & Fabian, A. 1995, MNRAS, 274, L67
- (11) Böhringer et al. 2001, A&A, 365, L181
- (12) Bruggen, M. 2003, ApJ, 592, 839
- (13) Churazov, E., Gilfanov, M., Forman, W. & Jones, C. 1996, ApJ, 471, 673
- (14) Churazov, E., Bruggen, M., Kaiser, C., Böhringer, H. & Forman, W. 2001, ApJ, 554, 261
- (15) Churazov, E., Sunyaev, R., Forman & Böhringer, H. 2002, MNRAS, 332, 729
- (16) Churazov, E., Forman, W., Jones, C. & Böhringer, H. 2003, 590, 225
- (17) Côté et al. 2001, ApJ, 559, 828
- (18) David, L., Forman, W. & Jones, C. 1991, ApJ, 369, 121
- (19) David, L. et al. 2001, ApJ, 557, 546
- (20) De Young, D. 2003, MNRAS, 343, 719
- (21) Ensslin, T. & Bruggen, M. 2002, MNRAS, 331, 1011
- (22) Ensslin, T. 1999, in Diffuse Thermal and Relativistic Plasma in Galaxy Clusters, p275, astro-ph/9906212
- (23) Fabian, A. 1994, ARA&A, 32, 277
- (24) Fabian, A., Celotti, A., Blundell, K., Kassim, N. & Perley, R. 2002, MNRAS, 331, 369
- (25) Fabian, A. C., Sanders, J. S., Allen, S. W., Crawford, C. S., Iwasawa, K., Johnstone, R. M., Schmidt, R. W., & Taylor, G. B. 2003, MNRAS, 344, L43
- (26) Fabricant, D. & Gorenstein, P. 1983, ApJ, 267, 535
- (27) Feigelson, E., Wood, P, Schreier, E., Harris, D., Reid, M. 1987, ApJ, 312, 101
- (28) Finoguenov, A. & Jones, C. 2001 , ApJL, 547, L107
- (29) Ford, H. et al. 1994, ApJL, 435, L27
- (30) Forman, W., Jones, C. & Tucker, W. 1985, ApJ, 293, 102
- (31) Harms, R. J., et al. 1994, ApJ, 435, L35
- (32) Harris, D., Biretta, J., & Junor, W. 1997, The M87 Ringberg Workshop’, September 1997, Springer Lecture Notes in Physics Series, eds. Roeser and Meisenheimer (astro-ph/9804200)
- (33) Harris, D. E., Owen, F. N., Biretta, J. A., & Junor, W. 2000, in Diffuse Thermal and Relativistic Plasma in Galaxy Clusters, ed. H. Bohringer, L. Feretti, P. Schuecker, & V. K. Kapahi (MPE Rep. 271; Garching: MPE), 111 (astro-ph/0002464)
- (34) Harris, D., Biretta, J., Junor, W. , Perlman, E., Sparks, W. & Wilson, A., 2003, ApJL, 586, L41
- (35) Heinz, S., Reynolds, c., Begelman, M. 1998, ApJ, 501, 126
- (36) Hines, D., Owen, F. & Eilek, J. 1989, ApJ, 347, 713
- (37) Jordan, A., Côté, P., Ferrarese, L., Blakeslee, J.P., Mei, S., Merritt, D., Milosavljević, M., Peng, E., Tonry, J.L., & West, M.J. 2003, ApJ, submitted
- (38) Kaiser, C. 2003 MNRAS 343 1319
- (39) Kaiser, C. & Binney, J. 2003, MNRAS, 338, 839
- (40) Kraft, R. et al. 2003, ApJ, 592, 129
- (41) Lumb, D., Warwick, R., Page, M., & De Luca, A. 2002, A&A, 389, 93
- (42) Macchetto, F., Marconi, A., Axon, D. J., Capetti, A., Sparks, W., & Crane, P. 1997, ApJ, 489, 579
- (43) McNamara, B. R., Wise, M., Nulsen, P. E. J., David, L. P., Sarazin, C. L., Bautz, M., Markevitch, M., Vikhlinin, A., Forman, W. R., Jones, C., & Harris, D. E. 2000, ApJ, 534, L135
- (44) Markevitch, M. 2001, Chandra calibration memo,
- (45) http://asc.harvard.edu/cal/, “ACIS,” “ACIS Background” and
- (46) http://cxc.harvard.edu/contrib/maxim/acisbg/COOKBOOK
- (47) Marshall, H., Miller, B., Davis, D., Perlman, E., Wise, M., Canizares, C., Harris, D. 2002, ApJ, 564, 683
- (48) Mathews, W. 1978, ApJ, 419, 213
- (49) Matsushita, K., Belsole, E., Finoguenov, A. & Böhringer, H. 2002, A&A, 386, 77
- (50) Molendi, S. 2002, ApJ, 580, 815
- (51) Nulsen, P. & Böhringer, H. 1995, MNRAS, 274, 1093
- (52) Nulsen, P., David, L., McNamara, B., Jones, C., & Forman, W. 2002, ApJ, 568, 163
- (53) Owen, F., Eilek, J. & Kassim, N. 2000, ApJ, 543, 611
- (54) Perlman, E. S., Biretta, J. A., Sparks, W. B., Macchetto, F. D., & Leahy, J. P. 2001, ApJ, 551, 206
- (55) Peterson, J. et al. 2003, Proceedings of “The Riddle of Cooling Flows in Clusters of Galaxies” eds. Reiprich, Kempner, Soker, astro-ph/0310008
- (56) Reynolds, C., Heinz, S., Begelman, M. 2001, ApJL, 549, L179
- (57) Ruszkowski, M., Bruggen, M. & Begelman, M. 2003, astro=ph/0310760
- (58) Sparks, W. B., Biretta, J. A., & Macchetto, F. 1996, ApJ, 473, 254
- (59) Stewart, G., Fabian, A., Nulsen, P. & Canizares, C. 1984, ApJ, 278, 536
- (60) Tabor, G. & Binney, J. 1993, MNRAS, 263, 323
- (61) Tonry, J. et al. 2001, ApJ, 546, 681
- (62) van den Bergh, S., McClure, R. & Evans, R. 1987, ApJ, 323, 44
- (63) Young, A., Wilson, A., Mundell, C. 2002, ApJ, 579, 560
.