Dynamical Mass Constraints on Low-Mass Pre–Main-Sequence Stellar Evolutionary Tracks: An Eclipsing Binary in Orion with a 1.0 M⊙ Primary and an 0.7 M⊙ Secondary111Based on data collected with the Hobby-Eberly Telescope and the WIYN Telescope.
Abstract
We report the discovery of a double-lined, spectroscopic, eclipsing binary in the Orion star-forming region. We analyze the system spectroscopically and photometrically to empirically determine precise, distance-independent masses, radii, effective temperatures, and luminosities for both components. The measured masses for the primary and secondary, accurate to %, are and , respectively; thus the primary is a definitive pre–main-sequence solar analog, and the secondary is the lowest-mass star yet discovered among pre–main-sequence eclipsing binary systems. We use these fundamental measurements to test the predictions of pre–main-sequence stellar evolutionary tracks. None of the models we examined correctly predict the masses of the two components simultaneously, and we implicate differences between the theoretical and empirical effective temperature scales for this failing. All of the models predict the observed slope of the mass-radius relationship reasonably well, though the observations tend to favor models with low convection efficiencies. Indeed, considering our newly determined mass measurements together with other dynamical mass measurements of pre–main-sequence stars in the literature, as well as measurements of Li abundances in these stars, we show that the data strongly favor evolutionary models with inefficient convection in the stellar interior, even though such models cannot reproduce the properties of the present-day Sun.
1 Introduction
Pre–main-sequence stellar evolutionary models are fundamental to our paradigm of star formation and early stellar evolution. These models are the means by which masses and ages are assigned to young stars and brown dwarfs, and are therefore central to our understanding of physical processes that depend, directly or indirectly, on knowledge of stellar masses and ages. Indeed, pre–main-sequence (PMS) stellar evolutionary models touch upon the most basic questions in star formation research: the nature and origin of the initial mass function; the timescale for circumstellar disk evolution and planet formation; and the initial distribution of stellar angular momentum, its evolution in time, and the dependence of that evolution on stellar mass, accretion, and other mass-dependent properties. Thus, the absolute calibration of PMS evolutionary models with respect to stellar mass is of foundational importance to star formation research.
Empirical mass determinations exist in the literature for 15 individual PMS stars (Popper, 1980; Andersen, 1991; Casey et al., 1998; Simon, Dutrey, & Guilloteau, 2000; Covino et al., 2000; Steffen et al., 2001; Alencar et al., 2003), with only 6 of these in the mass domain of 1 M⊙ or below. Moreover, many of these measurements, while of high precision, potentially suffer from systematic errors (primarily distance uncertainties) that limit their accuracy. Indeed, there is no PMS star with whose mass has been measured with an accuracy of better than a few percent.
Consequently, the absolute mass calibration of theoretical PMS evolutionary tracks remains weakly constrained by observations. The dearth of accurate measurements below 1 M⊙ is particularly salient because low-mass stars dominate studies of young stellar populations, and it is in this mass domain that key, outstanding questions remain with respect to, e.g., the nature of the initial mass function (Hillenbrand, 1997; Muench et al., 2002) and the evolution of stellar angular momentum (SMMV, ; Herbst et al., 2002; Rebull, 2001).
Eclipsing binary stars provide a uniquely powerful means of determining absolute stellar masses because the mass determinations are distance-independent. Eclipsing binaries also yield direct measurement of the stellar radii, permitting the determination of stellar luminosities that are also distance independent. To date, only four eclipsing binaries with PMS components have been reported in the literature (Andersen, 1991; Popper, 1980; Casey et al., 1998; Covino et al., 2000).
Here we report the discovery of a previously unknown, double-lined, spectroscopic, eclipsing binary system in the Orion star-forming region, V1174 Ori (catalog ). We combine time-series photometry with high-resolution spectroscopy to determine all of the fundamental physical properties of the system and of its stellar components. We then use these measurements to test the predictions of a variety of PMS stellar evolutionary models.
We begin by describing the discovery of V1174 Ori (catalog ) and its identification as a PMS eclipsing binary in §2. In §3, we present our photometric and spectroscopic observations and the methods used in their reduction. We analyze these observations in §4 to determine the system ephemeris and to derive a precise double-lined orbit solution, providing absolute stellar masses. We conduct a thorough spectroscopic analysis that includes determination of the stellar rotational velocities, measurement of the primary-to-secondary flux ratio, spectral classification and determination of effective temperatures, measurement of Li abundances, and measurement of the equivalent width of H emission. We also present a full analysis of our multi-band time-series photometry using synthetic light-curve fitting to determine precise, absolute stellar dimensions. The results of our analysis are presented in §5, including an independent determination of the distance to V1174 Ori (catalog ).
In §6 we use our empirically determined stellar masses, radii, effective temperatures, and luminosities to test a variety of PMS stellar evolutionary tracks possessing a variety of characteristics, including different atmosphere models and treatment of convection. We assess the performance of the theoretical models both against the components of V1174 Ori (catalog ) alone as well as against the ensemble of all PMS stars with empirical mass determinations in the literature. We consider how the tracks compare quantitatively to the data in both high- and low-mass regimes, in both binary and single systems, and in both the H-R diagram and mass-radius observational planes. Moreover, we examine the general behavior of the tracks to suggest, in qualitative terms, how their performance against the data might be improved.
In addition, we assay the ensemble of empirical mass determinations independent of the models to explore the degree of internal consistency in the data themselves, and we show how Li abundances can be used in some cases to resolve apparent contradictions. Finally, we discuss more general insights that can be gleaned from the Li abundances, arguing that the data strongly favor models with inefficient convection in the stellar interior during the PMS stage of evolution, even though such models cannot reproduce the properties of the present-day Sun. We present a summary of our conclusions in §7.
2 Discovery
Here we describe the discovery of V1174 Ori (catalog ) as a PMS eclipsing binary system. Its position is :34:27.85, :41:37.8 (J2000.0).
2.1 Data from the Literature
V1174 Ori (catalog ) has been included in a number of previous surveys of stars in the vicinity of the Orion Nebula Cluster (ONC), dating back to the catalog of Parenago (1954) (star # 1478). The General Catalog of Variable Stars, whose designation we use in this paper, reports a range of 1.1 mag (in the photographic system) between its high and low states.
More recently, the ROSAT observatory included V1174 Ori (catalog ) (designation ROS-ORI 166) in a deep PSPC pointing centered on the Trapezium region. The analysis of these data by Geier, Wendker, & Wisotzki (1995) assigns a net of 75 X-ray photons to V1174 Ori (catalog ), for a count rate of 17.02 cts/ks. This corresponds to an X-ray luminosity of erg/s in the ROSAT bandpass (0.07 to 2.4 keV), assuming the ONC distance to V1174 Ori (catalog ) of 470 pc (e.g. Genzel et al. (1981)). V1174 Ori (catalog ) has not been included in any of the Chandra observations of the ONC currently in the public archive, but this X-ray luminosity is fairly typical among the PMS stars that have been observed by Chandra (e.g. Feigelson et al. (2002)).
V1174 Ori (catalog ) was observed in the -band survey of the Orion A cloud by Ali & Depoy (1995) (# 2176 in their catalog), but their reported -band magnitude of 9.00 is at the bright limit of their survey, making this measurement suspect. More recently, Carpenter, Hillenbrand, & Skrutskie (2001) presented light curves of V1174 Ori (catalog ) (star number 4008 in their catalog), as part of their analysis of time-series photometry of the Orion star-forming region, conducted as an extension of the 2MASS project222See http://www.ipac.caltech.edu/2mass for information about 2MASS. Their light curves show rms scatters of 0.08–0.09 mag. In addition to low-level variability, their light curves display evidence for a possible eclipse event in the form of a single observation (seen in all three filters) that is 0.3–0.4 mag dimmer than the mean brightness level.
Finally, V1174 Ori (catalog ) was included in the study of Rebull et al. (2000) (# 1-665 in their catalog), whose photometry places V1174 Ori (catalog ) on the locus of Orion PMS stars in the vs. color-magnitude diagram. They report a spectral type for V1174 Ori (catalog ) of M0 on the basis of low-resolution spectroscopy, but derive extinctions of and , indicating potential problems with the spectral classification or photometry. While V1174 Ori (catalog ) was included in the region covered by the time-series study of Rebull (2001), they do not report it as a periodic variable. V1174 Ori (catalog ) was in eclipse during at least 7 of the 30 nights covered by their observations (assuming the ephemeris we adopt in §4), but with only one observation per night their light curves were presumably too sparse to detect periodic behavior (if they detected the eclipses at all).
2.2 Identification as a PMS Double-Lined Eclipsing Binary
We first identified V1174 Ori (catalog ) as a candidate eclipsing binary from an -band light curve obtained by us in 1994 December as part of a photometric study of stellar rotation in the ONC (Stassun et al. 1999; hereinafter SMMV ). The discovery light curve was by itself very compelling, showing eclipse-like variability with a period of days.
V1174 Ori (catalog ) was also included in several pointings during our spectroscopic survey of the region with the WIYN333The WIYN Observatory is a joint facility of the University of Wisconsin-Madison, Indiana University, Yale University, and the National Optical Astronomy Observatories. multi-object spectrograph, which showed V1174 Ori (catalog ) to have strong Li absorption (an indicator of stellar youth) and revealed it to be a single-lined spectroscopic binary. We confirmed the spectroscopic presence of the secondary in a spectrum kindly obtained by G. Basri with the Keck HIRES spectrograph, which also clearly revealed the presence of Li absorption due to the secondary (Fig. 1). This spectrum also allowed us to determine that the primary was of roughly mid-K spectral type.
3 Observations and Data Reduction
Having identified V1174 Ori (catalog ) as a PMS eclipsing binary and double-lined spectroscopic binary, we obtained multiple high-S/N, high-resolution spectra with which to determine a precise, double-lined orbit solution. We also obtained high-precision, high-cadence light curves at multiple wavelengths in order to (a) firmly establish the system ephemeris, and to (b) determine, via light-curve synthesis and modeling, such parameters as the orbital inclination, component radii, and ratio of component effective temperatures. The one remaining piece of information needed to fully establish all system parameters is the effective temperature of one of the components, a datum also provided by our high-resolution spectroscopy.
Here we present the photometric and spectroscopic data we obtained, and describe the procedures we employed in their reduction.
3.1 Photometry
We observed V1174 Ori (catalog ) photometrically with CCDs at 1m-class telescopes at 6 separate epochs spaced over 8 years. Table 1 summarizes the time-series photometry we obtained. The individual measurements are available electronically and are shown in Figs. 2, 4, and 6.
| UT Dates | N (nights) | Observatory | Filter | Ref. | ||
|---|---|---|---|---|---|---|
| 1994 Dec 11–27 | 16 | 49698.340–49714.491 | KPNO 0.9m, USNO 1m, Wise 1m | 128 | SMMV | |
| 2001 Jan 20–27 | 8 | 51929.588–51936.775 | CTIO 0.9m | 152 | this study | |
| 51929.608–51936.768 | 144 | this study | ||||
| 51929.590–51936.776 | Str. | 158 | this study | |||
| 51929.594–51936.783 | Str. | 154 | this study | |||
| 51929.623–51936.735 | Str. | 130 | this study | |||
| 2001 Jan 31 | 1 | 51940.591–51940.819 | USNO 1m | 20 | this study | |
| 51940.589–51940.817 | 20 | this study | ||||
| 2001 Nov 14–24 | 9 | 52227.746–52237.996 | WIYN 0.9m | 78 | this study | |
| 2002 Nov 17–26 | 10 | 52595.745–52605.000 | 110 | this study | ||
| 52595.802–52605.004 | 96 | this study | ||||
| 52595.806–52604.984 | 96 | this study | ||||
| 2002 Dec 05–16 | 11 | 52613.810–52624.946 | 24 | this study |
All CCD data were processed in the manner described in SMMV . Briefly, we reduced our CCD frames using the IRAF444IRAF is distributed by the National Optical Astronomy Observatories, which is operated by the Association of Universities for Research in Astronomy, Inc., under cooperative agreement with the National Science Foundation. CCDRED or XCCDRED (for CTIO quad-readout data) packages, and performed aperture photometry on all stars in the field of view using the IRAF APPHOT package. We then applied an algorithm similar to that of Honeycutt (1992) to our raw light curves to remove non-cosmic frame-to-frame photometric variations (due to changes in, e.g., seeing, sky brightness, atmospheric transparency). In all cases, the resulting photometric precision in the light curves of V1174 Ori (catalog ) is limited by systematics (flat-fielding, PSF variations, etc.) at the mag level, which we determine from inspection of non-variable stars in the field of comparable brightness.
In addition to these differential time-series observations, we obtained calibrated photometry of V1174 Ori (catalog ) on 1995 Feb 02 at the USNO 1m telescope. These data were obtained out of eclipse, at orbital phase 0.35, based on the ephemeris presented in §4.1. Calibrated photometry of V1174 Ori (catalog ) has been reported by Rebull et al. (2000), and Carpenter, Hillenbrand, & Skrutskie (2001) report measurements. These measurements are summarized in Table 3.1.
Rebull et al. (2000) do not report the precise times of their observations. However, the color reported by them is identical to that measured by us, which leads us to believe that their observations were also obtained out of eclipse. Carpenter, Hillenbrand, & Skrutskie (2001) report mean magnitudes and colors, averaged over all of their observations which span 36 days (excluding the two non-contiguous measurements obtained in 1998 Mar and 2000 Feb). The magnitude we adopt is the mean of their non-eclipse observations. The and colors do not show significant variations in their observations and so we do not adjust the values reported by those authors.
| Filter(s) | Mag./Color | Mag./Color | UT Date(s) | Ref. |
|---|---|---|---|---|
| observed | calculatedaaAssuming main-sequence colors, bolometric corrections, and . See §5.1. | |||
| 13.95 | 1995 Feb 02 | 1 | ||
| 1.24 | 1 | |||
| 1.48 | 1 | |||
| 1998 Jan | 2 | |||
| 2.33 | 2 | |||
| 11Value adjusted from that reported in Carpenter, Hillenbrand, & Skrutskie (2001), in order to account for eclipses. | 11.52 | 2000 Mar 04 – Apr 0822Contiguous portion of light curve only. | 3 | |
| 0.65 | 3 | |||
| 0.14 | 3 |
3.2 Spectroscopy
In order to derive a precise, double-lined orbit solution for V1174 Ori (catalog ), we obtained 15 high S/N observations in queue observing mode with the High Resolution Spectrograph (HRS) on the Hobby Eberly Telescope555The Hobby-Eberly Telescope is operated by McDonald Observatory on behalf of The University of Texas at Austin, the Pennsylvania State University, Stanford University, Ludwig-Maximilians-Universität München, and Georg-August-Universität Göttingen. The observations described here were obtained through community access made possible by NOAO. (HET) on 15 different nights between 2001 Nov 22 and 2002 Feb 23. The spectrograph setup we used yielded a resolving power of , with wavelength coverage from 5095Å to 8860Å, and centered at 6948Å. The 51 echelle orders in each spectrum are imaged onto two CCDs, with the “blue” chip imaging the 32 orders from 5095Å to 6803Å and the “red” chip imaging the remainder. The spectrograph was also set up with a single sky fiber so that simultaneous sky spectra could be obtained with each observation. The CCD images were binned on readout such that a spectral resolution element corresponds to approximately 3 pixels in the extracted spectra.
The exposure times were initially sec, and later increased to sec, and we combined the individual exposures in each set with cosmic-ray rejection. Each observation of V1174 Ori (catalog ) was bracketed by an observation of a ThAr lamp. In addition, all but one observation was accompanied by an observation of a bright radial-velocity standard star (typically obtained shortly after the V1174 Ori (catalog ) exposure) in order to closely monitor and correct for instrumental drifts in the radial velocities.
In addition, we obtained a single, very high S/N () observation of a late-type radial-velocity standard star for use as a radial-velocity template in our cross-correlation analysis (§4.2.2). Once we had established the approximate spectral types of the components of V1174 Ori (catalog ) (§4.3), we also obtained single observations of two appropriate spectral-type standard stars, of types K3 and K7666More careful analysis of the V1174 Ori (catalog ) spectra after the observations were obtained indicates that the components of V1174 Ori (catalog ) have spectral types of K4.5 and M1.5 (see §4.3.3), but this does not significantly affect our analysis.. Table 3 summarizes our spectroscopic observations with HET HRS.
| # | UT Date | HJD11Heliocentric Julian Date (2450000+) | Object | Exp. Time (s) | S/N22Signal-to-noise is per 3-pixel resolution element, measured near 6500Å. | Comments |
|---|---|---|---|---|---|---|
| 0 | 2001 Oct 29 | 2212.74347 | HD 18884 (catalog ) | 30 | 245 | R.V. template, SpT = M2 III |
| 1 | 2001 Nov 22 | 2235.85217 | V1174 Ori (catalog ) | 1800 | 85 | |
| 2235.87681 | HD 26162 (catalog ) | 5 | 120 | R.V. standard, SpT = K2 III | ||
| 2 | 2001 Nov 23 | 2236.84827 | V1174 Ori (catalog ) | 1800 | 80 | |
| 2236.89321 | HD 26162 (catalog ) | 15 | 145 | |||
| 3 | 2001 Dec 10 | 2253.80559 | V1174 Ori (catalog ) | 1800 | 60 | |
| 2253.82748 | HD 26162 (catalog ) | 10 | 85 | |||
| 4 | 2001 Dec 18 | 2261.78887 | V1174 Ori (catalog ) | 1800 | 40 | |
| 2261.80695 | HD 26162 (catalog ) | 10 | 90 | |||
| 5 | 2001 Dec 21 | 2264.77976 | V1174 Ori (catalog ) | 1800 | 80 | |
| 2264.79712 | HD 26162 (catalog ) | 10 | 95 | |||
| 6 | 2001 Dec 22 | 2265.76822 | V1174 Ori (catalog ) | 1800 | 75 | |
| 2265.83415 | HD 26162 (catalog ) | 10 | 95 | |||
| 7 | 2001 Dec 23 | 2266.76687 | V1174 Ori (catalog ) | 1800 | 105 | |
| 2266.81776 | HD 26162 (catalog ) | 10 | 120 | |||
| 8 | 2002 Jan 26 | 2300.67336 | V1174 Ori (catalog ) | 2400 | 125 | |
| 9 | 2002 Jan 27 | 2301.66941 | V1174 Ori (catalog ) | 2400 | 95 | |
| 2301.72972 | HD 26162 (catalog ) | 10 | 100 | |||
| 10 | 2002 Jan 28 | 2302.66839 | V1174 Ori (catalog ) | 2400 | 105 | |
| 2302.72798 | HD 26162 (catalog ) | 10 | 140 | |||
| 11 | 2002 Feb 07 | 2312.64124 | V1174 Ori (catalog ) | 2400 | 100 | |
| 2312.70694 | HD 26162 (catalog ) | 10 | 105 | |||
| 12 | 2002 Feb 09 | 2314.63298 | V1174 Ori (catalog ) | 2400 | 120 | |
| 2314.69301 | HD 26162 (catalog ) | 10 | 160 | |||
| 13 | 2002 Feb 13 | 2318.63282 | V1174 Ori (catalog ) | 2400 | 95 | |
| 2318.68518 | HD 26162 (catalog ) | 10 | 130 | |||
| 14 | 2002 Feb 21 | 2326.61211 | V1174 Ori (catalog ) | 2400 | 90 | |
| 2326.62791 | HD 26162 (catalog ) | 10 | 115 | |||
| 15 | 2002 Feb 23 | 2328.60823 | V1174 Ori (catalog ) | 1800 | 100 | |
| 2328.62179 | HD 26162 (catalog ) | 10 | 110 | |||
| 16 | 2002 Mar 07 | 2340.93213 | HD 110463 (catalog ) | 180 | 140 | SpT standard, SpT = K3 V |
| 2340.64503 | HD 237903 (catalog ) | 240 | 160 | SpT standard, SpT = K7 V |
All spectra were processed with the IRAF CCDPROC and ECHELLE packages. The steps involved in producing the final spectra include bias subtraction, flat-fielding, bad-column interpolation, order tracing (for both object and sky apertures), sky subtraction, wavelength calibration, and heliocentric velocity correction. Extraction of the spectra from the raw data was not straightforward, particularly with respect to order tracing which required a high degree of manual intervention. The orders are highly angled on the CCD, have flat-topped profiles in the cross-dispersion direction, and are separated from the sky orders by only a few pixels. We thus encountered difficulties with the automated order-finding and tracing frequently “skipping” between the object and sky apertures. However, we found that these problems could be circumvented manually.
ThAr arc spectra were extracted similarly. We found that relatively high-order polynomials both along and across the orders were required to provide a good mapping between pixel, order number, and wavelength. In the end we adopted third-order and seventh-order polynomial fits along and across the orders, respectively. The wavelength solutions were applied to the object spectra by taking an average of the ThAr spectra taken before and after the object spectra, weighted by their proximity in time to the object spectra.
Heliocentric velocity and date corrections were computed via the IRAF RV package. We carefully assigned mid-exposure observation times to each combined spectrum, taking into account the flux levels of the 3 sub-exposures (which occasionally differed from one another) and their time spacing relative to one another.
As ours was the first community program to use HET HRS, we unfortunately encountered an unforseen problem that rendered the “red” orders in our spectra unusable. The “red” HRS CCD in use at the time of our observations suffers from severe fringing, which would normally be removed by a spectrum of a bright continuum source such as an internal lamp. However, in the case of the HRS, the fringing pattern produced by the internal flat-field calibration lamp is different from the pattern present in the data. This is in part due to the fact that a different fiber is used for calibration purposes, which results in the flat-field beam having a different -ratio as compared to the science-object beam (M. Shetrone, priv. comm.). Thus in our spectroscopic analyses we use only the orders on the “blue” CCD, which show no such fringing problems.
4 Analysis
4.1 Eclipse timings: System ephemeris
We use eclipse timing measurements from our photometric light curves (§3.1) to determine a precise period and ephemeris for V1174 Ori (catalog ). Our -band data, which span a total of 2927 days, include 7 primary and 5 secondary eclipses. Some of these eclipses were also observed in other filters, providing additional (though not fully independent) eclipse timing information. We measure the time of each eclipse minimum by fitting a gaussian to the points in the light curve in and around the eclipse. These eclipse timings and their uncertainties are reported in Table 4.
We searched the combined -band lightcurves for a period via the Phase-Dispersion Minimization (PDM) technique (Stellingwerf, 1978), and found a best period of 2.61156 days. However, visual inspection of the combined data folded on this period revealed that the algorithm had chosen a beat period whereby the primary eclipses from the 2001 data were overlaid on the secondary eclipses from the 1994 data. Thus we refined the period by searching our radial-velocity measurements (§4.2.2) for periods near this value. This yielded a best period of days. A final visual inspection of the light curve folded on this period suggested a small manual refinement to days.
In Fig. 8 we show the phase residuals of the eclipse timings from Table 4 using this period. To show the residuals of the secondary eclipse together with those of the primary, we have subtracted 0.5 phase from the secondary residuals, which assumes a circular orbit. These residuals have an r.m.s. of 0.0015 in phase (5.5 min), and show no trends over the 2900-day span (some 1100 cycles) of the data. While there appears to be a weak effect in the Jan 2001 data for the primary eclipse values to be systematically negative and for the secondary eclipse values to be systematically positive, it should be borne in mind that the eclipse timings from the different filters in Jan 2001 are not truly independent, as these light curves share a common sampling pattern. The eclipse timings are therefore consistent with the assumption of a circular orbit.
We thus adopt the following ephemeris for the remainder of our analysis:
where is the epoch number, and the zero-point corresponds to primary eclipse (i.e. the deeper minimum).
| UT Date | HJD11Heliocentric Julian Date (2400000+) | Filter | Eclipse type | |
|---|---|---|---|---|
| 1994 Dec 11 | Primary | |||
| 1994 Dec 13 | Secondary | |||
| 1994 Dec 15 | Secondary | |||
| 1994 Dec 17 | Primary | |||
| 1994 Dec 21 | Secondary | |||
| 1994 Dec 27 | Primary | |||
| 2001 Jan 23 | Primary | |||
| meanaaMean of the measurements obtained from the individual filters. | ||||
| 2001 Jan 27 | Secondary | |||
| meanaaMean of the measurements obtained from the individual filters. | ||||
| 2001 Jan 31 | Primary | |||
| meanaaMean of the measurements obtained from the individual filters. | ||||
| 2001 Nov 14 | Primary | |||
| 2001 Nov 18 | Secondary | |||
| 2001 Nov 22 | Primary |
Note. — values are with respect to the ephemeris for primary minimum HJD 2,449,703.7504 2.634727 (see text).
4.2 Radial velocities and orbit solution
We use our HET HRS observations (Table 3) to measure precise radial velocities for both components of the V1174 Ori (catalog ) binary. Here we describe our procedure for measuring radial velocities, and discuss our assessment of potential systematic effects that may degrade the accuracy of the masses that we derive from them.
4.2.1 Radial velocities
We measure radial velocities by cross-correlating each V1174 Ori (catalog ) spectrum with a high-S/N spectrum of the radial-velocity standard HD 18884 (catalog ) (see Table 3), for which we adopt the heliocentric radial velocity of km s-1 as determined by Udry et al. (1999), whose long-term monitoring of this star shows it to be non-variable to a precision level of 0.3 km/s over nearly 300 observations. We chose this late-type (M2) template in the hopes of maximizing the cross-correlation peak of the faint, late-type secondary star.
We cross-correlate each of the 32 spectral orders in a given spectrum separately, and measure the centroid of the primary and secondary star peaks (see Fig. 9a). For each spectrum we thus in principle have 32 separate (but not independent) radial-velocity determinations for each of the primary and secondary. In practice, however, some orders consistently produce poor radial velocities, typically due to the presence of very broad lines (e.g. the Na D lines) which result in cross-correlation peaks that do not lend themselves well to centroiding. In addition, we were unable to securely identify the peak corresponding to the secondary star in most orders, due to other low-level structure in the cross-correlation function. To be conservative, we thus typically only accepted a few very good orders, orders where the spectral features of the secondary are particularly strong. Finally, we found that it was necessary to avoid spectral regions with strong nebular emission, which often subtracted poorly. By carefully selecting the spectral regions to be used in each order for each spectrum, we were able to maximize the number of orders yielding radial velocities.
For the secondary star, we use all orders that unambiguously show a secondary peak to define a mean radial velocity in each spectrum. With the primary star, for which most of the spectral orders yield a velocity measurement, we can be even more discriminating to maximize our precision. As shown in Fig. 9b, the scatter in the primary radial velocities produced by the different spectral orders is a function of correlation peak height; empirically, we find that the scatter is smallest among spectral orders that yield correlation peak heights above a certain threshhold value, typically around 0.6 (as in the example of Fig. 9b). We thus determine primary radial velocities from each spectrum by taking the mean of only those spectral orders with correlation peak heights greater than this threshold. Finally, we further refined the primary velocities by iteratively excluding orders that deviated by greater than 2 from the mean, which typically resulted in the rejection of at most one order per spectrum.
In Table 5 we report the primary and secondary radial velocities that we derive in this manner. In addition to the mean velocities adopted for each star, we give the number of spectral orders participating in defining the mean. In addition, we report the velocity residuals compared to our best-fit orbit solution (see below) for each of the primary and secondary velocities. The uncertainty reported with each velocity is simply the standard deviation of the mean. These uncertainties, which average around 0.3 km/s for the primary and 1.4 km/s for the secondary, thus represent an estimate of our internal errors only; we discuss instrumental and systematic errors in §§4.2.3 and 4.2.4.
Some of our observations were taken at orbital phases near eclipse, resulting in blended cross-correlation peaks that were difficult to separate securely. Indeed, the velocity centroids in these cases can be adversely affected for at least a couple of reasons. Cross-correlation peaks in close proximity to one another can suffer from “peak pulling”, whereby blending of the two components can cause apparent shifts in the peak centroids. In addition, partial blocking of the stellar disc of one star by the other causes the stellar line profiles of the blocked star to become asymmetric, narrower, and shifted with respect to the center-of-mass velocity. For our orbit solution analysis we thus discarded measurements obtained within 0.05 phase of either eclipse, thereby ensuring that the correlation peaks would be reasonably well separated and that occultation effects would not be a concern. The only exception to this is the spectrum obtained on UT 2002 Feb 21, which occurs at the phase where the secondary is almost completely eclipsed by the primary, so that the secondary spectrum is practically not present in the observed light.
The presence of spots on the stellar surfaces can also introduce distortions that affect the observed radial velocities. The importance of this effect for our observations can be evaluated from the light curve solutions discussed below, which include the effects of spots. Our model fits to the light curves obtained in January 2001 show that the effect is rather small. The theoretical radial-velocity distortions due both to stellar occultation (the Schlesinger-Rossiter effect; Rossiter (1924); Schlesinger (1909)) and the presence of surface spots are shown in Fig. 10. For the primary star, the radial velocity distortions due to spots are undetectable at the precision of our study, having an amplitude of at most 0.2 km/s, and less at most orbital phases. For the secondary star, the distortions are more pronounced, but still have an amplitude no larger than 1 km/s, and only at certain phases. As the light curve data were not obtained simultaneously with the radial velocity data, we do not correct the observed velocities for these distortions, noting again that the effect is in any case probably negligible.
| #aaSee Table 3. | UT Date | HJDbbHeliocentric Julian Date (2450000+) | Phase | NP | NS | ||||
|---|---|---|---|---|---|---|---|---|---|
| 2 | 2001 Nov 23 | 2236.84827 | 0.427 | 11 | 2 | ||||
| 3 | 2001 Dec 10 | 2253.80559 | 0.863 | 12 | 0 | ||||
| 4 | 2001 Dec 18 | 2261.78887 | 0.893 | ccMeasurement discarded in preferred solution (see text). | 11 | 3 | |||
| 6 | 2001 Dec 22 | 2265.76822 | 0.404 | 15 | 6 | ||||
| 7 | 2001 Dec 23 | 2266.76687 | 0.783 | 15 | 7 | ||||
| 8 | 2002 Jan 26 | 2300.67336 | 0.652 | 17 | 2 | ||||
| 10 | 2002 Jan 28 | 2302.66839 | 0.409 | 20 | 3 | ||||
| 11 | 2002 Feb 07 | 2312.64124 | 0.194 | 17 | 3 | ||||
| 12 | 2002 Feb 09 | 2314.63298 | 0.950 | 17 | 2 | ||||
| 14 | 2002 Feb 21 | 2326.61211 | 0.497 | 20 | 0 | ||||
| 15 | 2002 Feb 23 | 2328.60823 | 0.254 | 17 | 8 |
4.2.2 Orbit solution
We determined an orbit solution to the radial-velocity measurements in Table 5 by applying a least-squares fit simultaneously to the primary and secondary velocities. The orbit solution involves seven parameters: the mass ratio, ; the orbital period, ; the semi-amplitudes of the primary and secondary velocities, and ; the eccentricity, ; the center-of-mass velocity, ; and the time of primary minimum, .
With the system ephemeris determined precisely from the eclipse timing data (see §4.1), we chose to fix the values of and to those determined photometrically, and forced the orbit to be exactly circular (i.e. ). The assumption of circularity is corroborated by the eclipse timings analysis (§4.1), and is certainly expected for a short-period binary such as this. In any case, we did try a solution with as a free parameter, but found a best-fit value that was statistically insignificantly different from zero.
Using all of the radial velocities resulted in a fit with r.m.s. residuals for the primary and secondary of km/s and km/s, respectively. However, the measurement of the secondary’s velocity from the UT 2001 Dec 18 spectrum showed a residual of km/s, considerably larger than the other measurements. Indeed, a close look at the distribution of the secondary residuals revealed this measurement to be a clear outlier; excluding this measurement yielded a fit with km/s, consistent with the internal errors of the measurements.
We carefully re-examined (and even reprocessed) the spectrum of UT 2001 Dec 18 and the cross-correlation functions to see if we could discern any reasons for the large discrepancy of this measurement. The primary’s measurement is not obviously discrepant, and neither is the velocity of the standard star observed on this night (see §4.2.4). We note however that this spectrum does have the poorest S/N of all our HET HRS observations (Table 5). Interestingly, our light curve analysis (§4.4) suggests that spots might be significant near the orbital phase of this measurement (see Fig. 10).
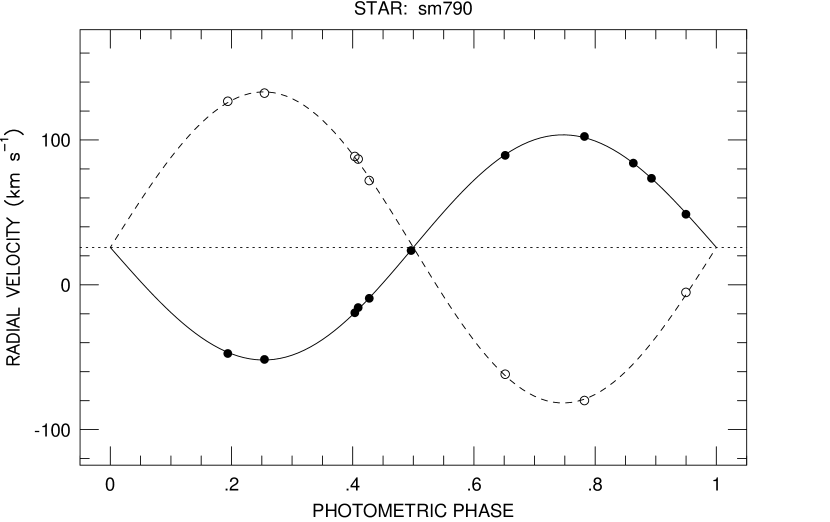
In Table 6 we present the orbital parameters of V1174 Ori (catalog ) resulting from our best-fit orbit solution, and display this solution along with the radial-velocity measurements in Fig. 11.
| Parameter | Value |
|---|---|
| (d) | |
| (km s-1) | 0.66 |
| (km s-1) | 1.41 |
| 0.7238 0.0057 | |
| 0aaAdopted. | |
| (km s-1) | 25.27 0.19 |
| (km s-1) | 77.75 0.29 |
| (km s-1) | 107.41 0.67 |
| (R⊙) | 9.638 0.041 |
| (M⊙) | 1.005 0.015 |
| (M⊙) | 0.728 0.008 |
4.2.3 Instrumental stability
Our spectroscopic observations allow us to determine an orbit solution with high precision, that in turn results in very precise (%) determination of the stellar masses (Table 6). As noted above, the residuals of the radial velocity measurements about the best-fit orbit solution are km s-1 and km s-1 for the primary and secondary, respectively. Evidently, the instrumental stability of the HET HRS is at least as good as 0.65 km s-1.
To assess the instrumental stability more carefully, we analyzed our observations of the radial-velocity standard star HD 26162 (catalog ), which was observed along with V1174 Ori (catalog ), in the same way as our V1174 Ori (catalog ) observations. Specifically, we cross-correlated each HD 26162 (catalog ) spectrum against the same radial-velocity template (HD 18884 (catalog )) that we used to derive the V1174 Ori (catalog ) velocities. The results are tabulated in Table 7 and shown graphically in Fig. 12.
The velocity deviations of HD 26162 (catalog ) relative to its published velocity of 24.8 km s-1 (Udry et al., 1999) reveal a high level of stability of the HET HRS system over the 90-day timescale spanned by our observations. As Fig. 12 shows, the system does exhibit low-level, secular drifts, but the dispersion of these drifts is small. The deviations have an rms of 0.52 km s-1 when we consider all of the nights on which V1174 Ori (catalog ) was observed, and an rms of 0.26 km s-1 when we consider only those nights used in our orbit solution777The lower rms of this subset of the radial-velocity measurements could be due to chance, given the apparently non-random nature of the deviations shown in Fig. 12..
This rms of 0.26 km s-1 is only about 1/2 of the rms residuals in our orbit solution fit to the primary velocities (0.65 km s-1), and about 1/5 of the secondary (1.41 km s-1). Evidently, some other source of measurement uncertainty dominates the errors in the radial velocity measurements of V1174 Ori (catalog ). These could include: the lower S/N of the V1174 Ori (catalog ) spectra as compared to the HD 26162 (catalog ) spectra (Table 3), particularly for the secondary star; the double-peaked nature of the V1174 Ori (catalog ) cross-correlation functions; differences in the track length of the V1174 Ori (catalog ) observations as compared to the HD 26162 (catalog ) observations (1800 sec vs. 10 sec); a source of astrophysical noise (e.g. surface activity such as spots, flares, etc.); and/or the presence of an unseen tertiary companion (see §5.1). In any case, instrumental stability does not appear to be the dominant source of uncertainty in our radial velocity measurements.
4.2.4 Systematic errors
For this experiment, where the primary goal is to determine accurate stellar dimensions for comparison to stellar evolutionary models, it is critical that we ascertain the extent to which systematic effects may limit the accuracy of the absolute stellar dimensions that we determine.
The semi-amplitudes of the primary and secondary velocities ( and ) are the parameters from the spectroscopic orbit solution that directly determine the stellar masses, so the masses are directly sensitive to systematics in these quantities. One possible source of systematic error in these quantities is spectral-type mismatch between V1174 Ori (catalog ) and the radial-velocity template.
There is in fact some evidence for a systematic offset of the secondary velocities relative to the primary. As Fig. 12a shows, the velocities of the radial-velocity standard HD 26162 (catalog ) show a median velocity in our observations that is 0.36 km/s larger than the published value. We speculate that this offset is due to the fact that HD 26162 (catalog ) has an earlier spectral type (SpT = K2 III) than the radial-velocity template star (SpT = M2 III). Our best estimate for the spectral types of the components of V1174 Ori (catalog ) are K4.5 and M1.5 (see §4.3.3), so a similar systematic shift might be expected between the measured velocities for the two components of V1174 Ori (catalog ), leading to systematic errors in the radial velocity semi-amplitudes.
We tried an orbit solution where we allowed for an arbitrary systematic offset between the primary and secondary velocities to be fit. We find a best-fit value of km s-1 for the offset, which is interesting in its similarity to the offset of 0.36 km s-1 we find above. Including this free parameter and its uncertainty results in slightly different stellar masses than those listed in Table 6, and with slightly larger uncertainties: and . Thus, while our orbit solution formally allows for an offset of order 1 km s-1 at the level, it is not statistically significant and its effect on the final uncertainties on the derived stellar masses is very small. For our subsequent analyses and discussion, we adopt the orbit solution provided in Table 6.
| #aaSee Table 3. | |
|---|---|
| 1 | 25.03 0.08 |
| 2 | 25.33 0.08 |
| 3 | 25.17 0.07 |
| 4 | 24.76 0.07 |
| 5 | 23.61 0.08 |
| 6 | 25.20 0.07 |
| 7 | 25.35 0.07 |
| 9 | 25.51 0.07 |
| 10 | 25.38 0.07 |
| 11 | 24.96 0.08 |
| 12 | 24.74 0.09 |
| 13 | 24.33 0.07 |
| 14 | 25.24 0.07 |
| 15 | 25.49 0.08 |
4.3 Spectral analysis
Having determined precise dynamical masses from our spectroscopic orbit solution, we now require stellar radii and effective temperatures for a complete analysis of the V1174 Ori (catalog ) system and for comparison with PMS stellar evolutionary tracks. Our light curve analysis (§4.4) provides precise values for the radii, the inclination, and the ratio of effective temperatures. Thus we need to establish the effective temperature of one of the components independently.
In this section we conduct a more detailed spectral analysis to determine the primary star’s effective temperature. To begin, we measure the rotational velocities of the two stars and determine their flux ratio. This information guides our spectral classification of the primary by establishing the rotational broadening of the primary spectrum and the extent to which the secondary spectrum contaminates the lines that we use to classify the primary. The rotational velocity and flux ratio information will also prove useful in constraining our light curve analyses below. Finally, we measure the strength of two spectral features of interest in studies of young stars, Li and H, the former of which serves to establish stellar youth and the latter of which serves as a proxy for chromospheric activity and/or accretion.
4.3.1 Rotational velocities
We measure the rotational velocities, , of the two components of V1174 Ori (catalog ) in two ways. First, the cross-correlation functions we used to measure radial velocities (§4.2.1) contain rotational information in the sense that the peak widths are related to . Second, we use the ratio of the widths of the primary and secondary Li lines to constrain the ratio of of the two components.
Because the widths of the cross-correlation peaks reflect the convolution of the intrinsic stellar with both the instrumental response function and the radial-velocity template spectrum, the peak widths do not directly yield a measure of . We calibrated the width of the cross-correlation peak to by artificially rotationally broadening our narrow-lined (lines unresolved) spectral standards (see Table 3) and then cross-correlating these broadened spectra against the same radial-velocity template used with our V1174 Ori (catalog ) spectra. This was done separately for each spectral order. We find that our cross-correlation functions permit us to discern values of km/s.
Using this calibration, we measured values for the components of V1174 Ori (catalog ) from each spectrum, averaging together the values from the multiple orders in a given spectrum. The resulting values are km/s and km/s for the primary and secondary, respectively. Here the uncertainties are the standard deviation of the mean.
We wish to emphasize that the uncertainties quoted above are strictly internal. Furthermore, we caution that we have not used standards for an external calibration. For our present purposes, what is robust here is that the rotational velocities for the stars are 20–25 km/s, and that the primary star rotates more rapidly than the secondary. This latter point is corroborated by our analysis of the primary and secondary Li lines below (§4.3.4).
4.3.2 Flux ratio
We use the temperature-insensitive Ca II lines at 6102,6122 to measure the flux ratio between the primary and secondary components of V1174 Ori (catalog ). We fit the V1174 Ori (catalog ) spectrum of UT 2002 Feb 07 by adding together at various ratios the spectra of our K3 and K7 standards888Our use of the K3 and K7 standards is based on the preliminary spectral types that we determined for the two components of V1174 Ori (catalog ), but as the Ca lines used are temperature-insensitive any two standards of roughly mid-K to early-M spectral type would suffice. (see Table 3) at the appropriate radial velocities and with the appropriate rotational broadening. We chose the UT 2002 Feb 07 spectrum because on this date the secondary was shifted a full 174 km/s (3.5Å at this spectral region) redward of the primary. The two components are thus well separated, and the 6102 line of the secondary is shifted into a region of the spectrum (6105.5Å) that is free of lines from the primary.
We find a best fit to the Ca II lines in the V1174 Ori (catalog ) spectrum when we combine the two templates in a 6:1 ratio, (Fig. 14), although ratios of 5:1 and 7:1 also fit the observed spectrum reasonably well.
4.3.3 Spectral classification
Our high-resolution HET HRS spectra permit spectral classification of the primary from careful examination of temperature-sensitive line ratios. As demonstrated by Basri & Batalha (1990) and by Lee (1992), the ratio of Ni I 6108 to V I 6112, the ratio of V I 6040 to Fe I 6042, the ratio of V I 6058 to Fe I 6056, and the ratio of Sc I 6210 to Fe I 6200 provide a good determination of spectral class from high-resolution spectra. These line ratios were also used by Steffen et al. (2001) in their analysis of the PMS binary NTT 045251+3016 (catalog ).
We have carefully examined these line ratios in our spectra that have the secondary sufficiently Doppler-shifted with respect to the primary. We find a spectral type for the primary of K4–K5, with an uncertainty of 1/2 subclass. As an example, in Fig. 13 we compare the first line pair above from our HET HRS spectrum of UT 2002 Feb 07 with four spectral standards of type K1, K3, K4, and K5. The observed line ratio indicates a K4.5 spectral type, but after correcting the primary’s V I line for contamination by the secondary’s Ni I line (using the flux ratio determined above), we find a K4 spectral type in this spectrum.
Taking all of these line-pair ratios from all of our observations into account, we find a mean spectral type for the primary of K. Due to the quantized nature of the spectral classification process (0.5 sub-type), this uncertainty is likely unreastically small, so we adopt a more conservative uncertainty of 0.5 spectral sub-type. Using the SpT- conversion of Schmidt-Kaler (1982), this implies an effective temperature for the primary of K.
Using this together with the ratio of determined from our light curve analysis below (§4.4), we infer that the secondary has an effective temperature of K, implying a spectral type of M1.5.
4.3.4 Lithium
The 6708 line of Li is a commonly used indicator of stellar youth, as stars rapidly destroy their natal Li content during the first few yr of their evolution. For very young stars, the Li line at 6708Å can be very strong, with equivalent widths from mÅ for early K stars to mÅ for mid-M stars (Dolan & Mathieu, 1999). Indeed, in our HET HRS spectra, the Li line is one of the few lines from the secondary that can be unambiguously identified by eye.
We have measured the equivalent widths of the primary and secondary Li lines in those spectra where the two stars are sufficiently Doppler-shifted relative to one another. As an example, the spectrum of UT 2002 Jan 28 has the secondary at a radial velocity of km/s relative to the primary. The Li equivalent width (EQW) we measure for the primary star in this spectrum is EQW(Li) mÅ. We measure the Li EQW of the secondary star to be EQW(Li) mÅ after correcting for the contribution of spectral features from the primary. These EQW measures also include a 5% correction for the presence of third light, based on our light curve analysis (§4.4.3) which indicates 0% third light at and 10% at .
If intrinsically equal, these EQW values would imply a flux ratio of 5.1. However, adopting spectral types of K4.5 and M1.5 for the two components implies that the intrinsic EQW of the secondary’s Li line is % greater than that of the primary (Dolan & Mathieu, 1999). Correcting the secondary’s EQW(Li) accordingly results in a flux ratio of 6.3, consistent with that derived from our analysis of the temperature-insensitive lines above (§4.3.2). Thus from this spectrum we infer intrinsic equivalent widths for the two stars of EQW(Li) mÅ and EQW(Li) mÅ. The other spectra for which we could cleanly separate the primary and secondary Li features yield values consistent with these. Adopting a flux ratio of 6:1, we find from the ensemble of our spectra EQW(Li) mÅ and EQW(Li) mÅ.
We can use these EQW measurements to infer Li abundances for the two stars. From the Li curve-of-growth analysis of Pavlenko & Magazzu (1996), we find (Li) and (Li) assuming LTE, and (Li) and (Li) for the non-LTE case. Note that these abundance estimates are likely to be slightly lower than the actual abundances, as the curve-of-growth values used assume , whereas the components of V1174 Ori (catalog ) have (see §5.1). In addition, the uncertainties listed reflect only the error in the measurement of the EQW; including the uncertainty in the stellar increases the abundance uncertainties to 0.2 dex.
Thus, the primary star’s Li abundance is consistent with at most 0.2–0.3 dex of depletion (assuming a “cosmic” Li abundance of (Li)), whereas the secondary shows dex of depletion. As discussed by D’Antona & Montalbán (2003) the pattern of PMS Li depletion as a function of stellar mass and age can provide important constraints on PMS tracks. We will return to the issue of Li abundances in §6.5.
Finally, we can also use the primary and secondary Li lines to infer the relative rotation rates of the two stars. We have already derived values from the widths of the cross-correlation peaks (§4.3.1). Using the ratio of the widths of the Li lines, we can independently infer the ratio of . We have measured this ratio from our spectra that have the primary and secondary Li lines sufficiently well separated to allow a clean measurement of their FWHM, and find a ratio of , consistent with the values determined from the cross-correlation analysis.
4.3.5
Emission of the H line is also of interest in studies of young stars. Indeed, emission stronger than EQW(H) Å is a defining criterion for classical TTS, which are believed to be PMS stars actively accreting from circumstellar disks. Even non-accreting TTS often show some amount of H in emission, which is thought to indicate the presence of strong chromospheric activity.
Based on the strength of H emission, V1174 Ori (catalog ) does not appear to be an actively accreting system, with neither component exhibiting H emission in excess of a few Å EQW in any of our spectra. In Fig. 15, we show the spectrum of UT 2002 Feb 23 in the vicinity of H. This spectrum has the components of V1174 Ori (catalog ) at their greatest radial-velocity separation, making it possible to detect their individual H emission apart from the very strong nebular emission. The observed equivalent widths measure EQW(H)Å and EQW(H) Å, after correcting for the continuum of the companion.
4.4 Light curve synthesis and modeling
Having determined an ephemeris for V1174 Ori, and having conducted a thorough spectral analysis of the system including determination of a double-lined orbit solution, we now analyze our multi-epoch, multi-band light curves (Table 1, Figs. 2–7) in detail to determine the orbital inclination of the system, for the secondary, and absolute radii for both components. Our analysis procedure makes use of a Wilson-Devinney (WD) based algorithm that models the observed photometric variations with synthetic light curves that include the effects of limb darkening, gravity brightening, mutual illumination and occultation, and spots. In addition, the code permits the use of either simple Planckian fluxes or detailed model atmospheres. Along the way, we use information provided by our spectroscopic analyses (, flux ratio, primary ) to further constrain the model light curve parameters.
4.4.1 Initial considerations
Although the light curves shown in Figs. 2, 4 and 6 are typical for a system with non-distorted components, apparently well-detached from their Roche lobes, they also reveal the presence of variations not related to the eclipses. From careful inspection of the light curves it becomes evident that these variations are most likely due to star spots that change from one epoch to the next, hindering the use of our photometric data from all epochs in a single, integrated analysis.
Thus, to begin, we used the data from the epoch with the most complete set of light curves—those obtained in Jan 2001 in 5 filters ()—to produce an initial set of light curve solutions. These initial light curve solutions were calculated without spots by fitting simultaneously the 5 light curves from Jan 2001 together with the radial velocity data from Table 5.
Our analysis was performed with the WD light-curve synthesis program (Wilson & Devinney, 1971; Wilson, 1993a, b). Besides other modifications (Vaz et al., 1995; Casey et al., 1997), our version of the WD code was implemented with the possibility of using the SIMPLEX solution method (Kallrath & Linnel, 1987; Vieira, 2003) as an alternative to the traditional least-squares method. Limb-darkening coefficients for both eclipsing components were described using the data from van Hamme (1993). All three limb-darkening laws (linear, linear-log, and linear-square root) were examined, with the coefficients calculated by bi-linear interpolations using the current values of and . The linear law gave marginally better solutions and was therefore adopted. Bolometric albedoes for both components were set equal to 0.5 as appropriate for atmospheres in convective equilibrium. Gravity-brightening exponents were calculated using the local value of for each point on the stellar surfaces, taking into account mutual illumination, according to Alencar & Vaz (1997) and Alencar et al. (1999). The radiated flux of both stars is described using the atmosphere model tables of Buser & Kurucz (1992), updated relative to the original versions of the WD code. As the of the secondary is lower than the minimum included in the published tables (4000 K), we extrapolated linearly in a log(theoretical magnitude) vs. log(temperature) scale. Both the radial velocities and the photometric times of minima indicated no sign of orbital eccentricity, so we assumed circular orbits in the light curve analysis.
In performing these initial calculations, we applied least-squares differential corrections between successive iterations to the orbital inclination, the secondary , the primary luminosity, both stellar surface gravitational pseudopotentials (stellar radii), the center-of-mass radial velocity, the mass ratio and an arbitrary phase shift to be added to the observations. The luminosity of the secondary was calculated from its size and . In addition, the limb-darkening coefficients, normalization magnitudes, surface gravities, and individual velocity amplitudes were all updated between successive runs to correspond to the solution from the previous iteration.
Initially, the WD code settled on a solution in which the secondary star was larger than the primary. However, this solution violated the observed luminosity ratio (§4.3.2) as well as the observed rotational velocities if synchronous rotation is assumed. By forcing the luminosity ratio constraint, the code found another solution in which the primary is larger. This solution matches the observed luminosity ratio and predicts rotational velocities similar to those observed. This solution thus served as a starting point for introducing additional parameters into the analysis, such as spots, as we now describe.
4.4.2 Star spots
After determining an initial solution as described above, we introduced spots in the WD calculation in order to model the out-of-eclipse variations observed. We started by introducing one cold spot on each component. For each spot on each star, four parameters are added to the WD calculation: the longitude and co-latitude of the spot, the spot radius (as seen from the center of the star), and the spot temperature factor ( for cold spots and for hot spots).
In this phase of the calculation, we found the SIMPLEX method to be much more efficient in finding best-fit solutions than the least-squares method, the latter being very sensitive to small corrections to the spot parameters, leading to frequent divergence of the solution. Although the WD algorithm can deal with spots that move in longitude across the surface of the star, we assumed that the spots rotate with the same angular velocity as the star. After convergence of each set of spots, we tried many different combinations of spot number and configurations, trying to minimize the number of spots on each star. Note that the WD code treats regions in which multiple spots overlap by multiplying their temperature factors999This differs from, e.g., the Nightfall program, which uses the average of the temperature factors. See http://www.lsw.uni-heidelberg.de/users/rwichman/Nightfall.html ..
Ultimately, both “cold” and “hot” spots were needed on each star to reproduce the light curves of Fig. 2. The cold spots made it necessary to extrapolate in the atmosphere tables, as mentioned above for the secondary star, for some points on the surface of the primary star as well. The calculations with atmosphere tables were compared with calculations using blackbodies, and we concluded that the extrapolation done (linearly in a logarithmic scale) was reasonable. Thus, except for the light curves for which Buser & Kurucz (1992) did not publish atmosphere calculations, we thus chose to use atmosphere models instead of simple Planck functions.
There exist multiple combinations of spots that can reproduce the observed out-of-eclipse variations reasonably well. We believe that the 3 spots on each star used in our final solution (Table 9) are physically realistic. Moreover, our use of light curves in five different bands makes the spot solution more robust, as we insisted that one spot configuration reproduce all of the light curves simultaneously. In any case, the goal of including spots in the light curve modeling is not to determine the properties of the spots per se, but rather to better constrain the morphology of the light curves around the eclipses and thereby to minimize the uncertainty in the parameters of true import: the system inclination, the ratio of , and the stellar radii.
4.4.3 Third light
The Jan 2001 light curves proved impossible to fit together unless we included 10% third light in . The light curve required a slightly negative amount of third light, which is physically meaningless. We thus forced , but left this parameter free to be adjusted at the other wavelengths. The final solution is shown in Figs. 2 and 3 and in Tables 8 and 9. With the exception of , the significance of the values found for the light curves is questionable as they do not follow a Planckian distribution with wavelength. They are probably artifacts of the data-reduction process (e.g. background subtraction in the aperture photometry, scattered light, etc.).
4.4.4 Final solutions
| parameter | value | parameter | value |
|---|---|---|---|
| (°) | 86.974 0.035 | pole | 0.1384 0.0006 |
| 7.942 0.026 | point | 0.1392 0.0006 | |
| 7.705 0.022 | side | 0.1387 0.0006 | |
| (K) | 4470. (fixed) | back | 0.1391 0.0006 |
| (K) | 3615.0 9.5 | pole | 0.1101 0.0012 |
| (%) | 9.90 0.71 | point | 0.1106 0.0012 |
| (%) | 0.00 (fixed) | side | 0.1103 0.0012 |
| (%) | 1.73 0.65 | back | 0.1106 0.0012 |
| (%) | 0.03 0.65 | Fout,A | 0.4247 0.0012 |
| (%) | 2.47 0.66 | Fout,B | 0.4548 0.0014 |
| 1.017 0.026 | |||
| 1.001 0.079 |
Note. — WD solutions for V1174 Ori, based on the observations from Jan 2001. Parameters like the limb darkening coefficients, gravity darkening exponents, and surface gravities were kept consistent during iterations. The solutions were attained by combining both the least-squares and the SIMPLEX methods. The errors quoted are the internal least-squares estimations, which are typically around 3-5 times larger then those estimated from the vertices of the SIMPLEX hyperpolyhedron after convergence. The third light contributions are given as percentages of the eclipsing system total light at the normalization phase (0.25). The radii resulting from the gravitational effective equipotentials (in terms of the orbital separation) and the fill-out factors, Fout (Mochnacki, 1984), are given, which indicate that the eclipsing components are well inside their Roche lobes. The errors quoted on the radii and fill-out factors represent the deviations caused by the uncertainties in the pseudopotentials and in the mass ratio. The rotation rates, calculated from the solutions and the measurements of §4.3.1 are shown, justifying the assumption of synchronism with the orbit.
| epoch | bands | spot/star | co-latitude (°) | longitude (°) | radius (°) | |
|---|---|---|---|---|---|---|
| Dec/1994 | 1 / A | 69. 13. | 140.5 8.6 | 7.2 1.6 | 0.69 0.24 | |
| 1 / B | 70.4 7.3 | 25.3 5.5 | 11. 11. | 1.44 0.32 | ||
| 2MASS | 1 / A | 21. 16. | 101.9 9.6 | 27. 5.3 | 0.88 0.18 | |
| 1 / B | 23. 13. | 336. 21. | 48. 4.2 | 0.61 0.14 | ||
| Jan/2001 | 1 / A | 18.2 7.4 | 78. 10. | 15.2 4.6 | 1.58 0.74 | |
| 2 / A | 16.2 5.7 | 110.8 6.2 | 26.0 4.7 | 0.76 0.25 | ||
| 3 / A | 13.34 0.69 | 159.6 1.3 | 31.2 1.5 | 0.508 0.042 | ||
| 1 / B | 155. 10. | 97.1 5.5 | 30.2 5.1 | 0.76 0.12 | ||
| 2 / B | 67. 19. | 246. 10. | 17.4 4.6 | 1.18 0.11 | ||
| 3 / B | 76. 17. | 297.4 5.6 | 26.0 5.6 | 0.662 0.091 | ||
| Nov/2001 | 1 / A | 48. 10. | 136.8 9.6 | 21.4 5.2 | 0.74 0.41 | |
| 1 / B | 70. 17. | 134.6 9.7 | 12.4 6.6 | 1.45 0.91 | ||
| Nov/2002 | 1 / A | 22.41 0.42 | 93.3 7.2 | 31.6 1.2 | 0.851 0.057 | |
| 1 / B | 16.35 4.1 | 306.1 9.1 | 56.1 5.7 | 0.69 0.11 | ||
| 2 / B | 21.99 4.2 | 348.2 9.8 | 44.7 8.4 | 0.605 0.095 |
Note. — The characteristics of the star spots used in the solution of the light curves from Table 1 and for the light curves from 2MASS (one point obtained at March 19th, 1998 and 23 points from February 6th to March 28th, 2000). The spots are listed for each component in each epoch with increasing longitudes. As in Table 8, the errors quoted are those internal to the least squares method. The standard deviation of the corresponding variables of the SIMPLEX method, after convergence, are much smaller: of the order of degree for the angular parameters and of for the temperature factor for both components. gives the spot temperature in units of .
In order to test the validity of the stellar parameters found above from the light curve solutions for the Jan 2001 data, we applied the same analysis procedure to the other sets of light curves (Table 1), now forcing all the parameters, except those corresponding to the star spots, to remain fixed. The resulting fits for the light curves obtained in Nov 2001 and the light curves obtained in Nov–Dec 2002 are shown in Figs. 4 and 5. The characteristics of the spots used are given in Table 9. The amount of third light at the different wavelengths were left as free parameters. and tended to become slightly negative, while was once again 10%. We thus used no third light for and , and adopted the value for shown in Table 8.
The -band discovery light curve obtained in Dec 1994 (Table 1) was also fit with the solution of Table 8 and a different spot configuration. The amount of third light was again fixed at the value shown in Table 8. Similarly, the light curves from Carpenter, Hillenbrand, & Skrutskie (2001), while not providing complete phase coverage, were also fit with this solution. No third light was included in the light curves because the third light parameter mainly affects the depth of the minima, and unfortunately the minima were not covered by the Carpenter, Hillenbrand, & Skrutskie (2001) observations. The solutions are shown in Figs. 6 and 7, and the spots used are listed in Table 9.
Overall, the quality of the synthetic light curve fits to the data is excellent. Indeed, all 5 bands from the Jan 2001 observations are fit extremely well, with only minor systematic effects visible in the residuals (Fig. 3). Small systematic residuals do persist in some of the light curves at other epochs. For example, in the Nov–Dec 2002 -band data there are 2 points that deviate by more than 0.02 mag relative to the theoretical light curve near secondary minimum (Figs. 4 and 5). The data points close to secondary minimum in and also show small deviations, although at only mag these are not by themselves statistically significant. A few deviant data points also appear at other phases (e.g. phase 0.3 in ). These might be indicative of erratic variations as have been reported in, e.g., AK Sco (Alencar et al., 2003) and TY CrA (Casey et al., 1997). Indeed, the most discrepant point near phase 0.5 in the Nov–Dec 2002 -band light curve was obtained by itself more than two weeks later than the other points near that phase; perhaps there was small amount of spot evolution or some other small change in the system over the course of the Nov–Dec 2002 epoch.
A limitation in our ability to analyze small-scale photometric variability over long timescales is that our differential photometric observations were not all reduced in one integrated procedure, but separately for each epoch. The Honeycutt (1992) algorithm we employ determines the differential photometric variations relative to a statistically defined ensemble of comparison stars, and this statistical ensemble is not necessarily common to all epochs. Consequently, the photometric calibrations from one epoch to the next are not absolutely tied to one another. In both AK Sco and TY CrA, secular changes in system brightness from one epoch to the next have been attributed to variable obscuration by dust. Unfortunately, we cannot determine from our current analysis whether such global changes in system brightness are taking place in V1174 Ori (catalog ) over long timescales.
Even so, the light curve analyses presented here show clear evidence for changes with time in both the number and the characteristics of the spots on both components. The time coverage of the observations was not adequate to follow the evolution of the spots in detail, but there are hints in Table 9 that some of the spots may persist on month timescales, drifting across the surfaces of the stars. The hot spots apparently come and go more sporadically and, besides occurring more frequently on the secondary than on the primary, they tend to be smaller than the cold spots. Finally, although the rotation rates of Table 8 indicate orbital synchronism within the errors, one of the reasons for spot drifting may be that the stars are not yet completely synchonized. The stars may also present differential rotation, as in the Sun and as recently determined for the rapidly-rotating RS CVn binary UZ Librae (Oláh et al., 2003).
In the end, while some questions remain as to the origin of the variability observed in some of our light curves at the finest level of detail, the overall match between the synthetic light curves and the data is excellent (Figs. 2–7), and for the remainder of our analysis we adopt the solution listed in Table 8.
5 Results
5.1 Fundamental stellar parameters
Combining our spectroscopic and photometric analyses presented above, we can establish all of the fundamental stellar properties for both components of V1174 Ori (catalog ). We report these parameters in Table 10.
| Primary | Secondary | |
|---|---|---|
| (M⊙) | ||
| (R⊙) | ||
| (K) | aaFrom measured spectral type of K4.5 , and SpT– conversion of Schmidt-Kaler (1982). | ccNote that the internal uncertainty on for the secondary is minuscule. The uncertainty we assign here is inherited from the uncertainty in the determination of for the primary, keeping the ratio fixed at the value determined in §4.4. |
| (L⊙) | ||
| (km/s) | ||
| 0.32 | ||
| Dist. (pc) | ||
We can in principle determine the extinction, , toward the system by fitting the observed colors (Table 3.1), assuming main-sequence intrinsic colors (Kenyon & Hartmann, 1995) and bolometric corrections (Popper, 1980) for the primary and secondary components of V1174 Ori (catalog ). There is not a single value of that simultaneously reproduces all of the observed colors. Formally, however, we find a best-fit value of , which results in a distance to the system of 419 pc when we normalize to the observed magnitude (see §5.2 below). The colors calculated with this extinction and distance are compared to the observed values in Table 3.1.
The agreement between the observed and calculated colors is best in , where the observed flux is dominated by that of the primary star, and in and , where the colors become largely degenerate for dwarfs of mid-K to early-M spectral type. The observed color is bluer than predicted by 0.11 mag, perhaps the result of a mild UV excess from one or both of the stars, as is common among chromospherically active PMS stars, and possibly consistent with the observed H emission (see §4.3.5) and hot spots (§4.4.2).
The observed color is somewhat redder than predicted (by 0.14 mag), roughly consistent with the level of third light inferred from our light curve modeling (§4.4) in the band (). Similarly, the observed magnitude is 0.30 mag brighter than predicted.
We can improve slightly the fit to the observed color and magnitude by increasing the . For example, adopting would predict and . Of course, this worsens the agreement in the other colors, most notably in , and results in a distance (401 pc) less compatible with that typically assumed for the ONC ( pc).
Together, the and discrepancies suggest the presence of a third, low-mass star in the system that contributes flux noticeably only at m. This would imply that V1174 Ori (catalog ) is in fact a hierarchical triple system, with the tertiary in a sufficiently wide orbit so as to not manifest itself in the observed radial velocities (§4.2.1). Curiously, TY CrA (Casey et al., 1998), one of the other three PMS eclipsing binaries in the literature, is also reported to be a triple system.
5.2 Distance to V1174 Ori
Since we measure the luminosities of the components of V1174 Ori (catalog ) directly from and , we can infer a distance to the system assuming a particular derived from the system colors (see above). The distance we derive to V1174 Ori (catalog ) of pc differs somewhat from that which has been quoted for the ONC in the recent literature. For example, Hillenbrand (1997) adopt a distance of 470 pc, and Bally, O’Dell, & McCaughrean (2000) use a distance of 460 pc.
Various other authors have determined distances to the ONC and to the various subgroupings of Orion OB1, ranging from 400–500 pc. Based on photometry of several tens of bright O and B stars, Warren & Hesser (1978) find a distance of 480 pc to the Trapezium cluster (Ori OB1d) and 430 pc to the foreground Ori OB1c, while Anthony-Twarog (1982), using the same data, find a distance of 434 pc for Ori OB1d. Using different photometric indices, Brown, de Geus, & de Zeeuw (1994) find a distance of only 400 pc for Ori OB1c. Perhaps the most robust constraint is that provided by the BN-KL masers, situated just behind the ONC, at 480 pc (Genzel et al., 1981).
Given precisely determined luminosities for the two eclipsing components of V1174 Ori (catalog ), our distance determination depends primarly upon , with lower values placing the system farther from the Sun. Based on our analysis of the observed colors, we do not believe that can be much lower than what we report above. Using the value of reported in Table 3.1, the discrepancy between the observed and predicted color is already consistent with the amount of third light that we find for the band from our light curve analysis. Decreasing would increase the discrepancy in , which would be incompatible with our light curve solution.
Once the value of is determined, we compute the distance via the distance modulus in . Our -band measurement has a formal uncertainty of 0.03 mag, which translates into an additional distance uncertainty of 6 pc. Of course, this uncertainty does not include any possible influence of spots which, from our analysis above (§4.4.2) has been observed to be mag peak-to-peak in . Our calibrated photometry was obtained in 1995, an epoch at which we unfortunately do not have light curves that could inform us as to the influence of spots on the calibrated magnitudes. If, for example, a cool spot were acting to depress the -band flux by 0.1 mag, then our derived distance would be underestimated by 20 pc.
Another, if subtler, consideration in our distance determination is the value assumed for the solar bolometric magnitude, . Lower values of (i.e. brighter) result in V1174 Ori (catalog ) being farther from the Sun. We have adopted the value of used by Caloi, D’Antona, & Mazzitelli (1997), which produces a distance roughly consistent with the other distance determinations discussed above. However, the value currently adopted by the IAU, , results in a distance to V1174 Ori (catalog ) of 390 pc.
Based on this discussion, we consider it likely that V1174 Ori (catalog ) is a member of the older, foreground Ori OB1c at a distance of pc, consistent with the slightly older age ( Myr) that we find below. Indeed, the position of V1174 Ori (catalog ) approximately 0.3 degrees to the south of C Ori places it just outside the region defined as Ori OB1d by Blaauw (1964) and in the region defined as Ori OB1c.
6 Comparison to theoretical pre–main-sequence evolutionary tracks
In this section, we use the empirically determined masses, radii, effective temperatures, and luminosities of the primary and secondary components of V1174 Ori (catalog ) to test the predictions of PMS stellar evolutionary models. We consider in turn four sets of PMS tracks commonly used in the literature: Baraffe et al. (1998) (§6.1), Palla & Stahler (1999) (§6.2), Siess, Dufour, & Forestini (2000) (§6.3), and Montalbán et al. (2003) (more recent version of the D’Antona & Mazzitelli (1997) tracks; §6.4).
These models differ primarily in their choice of atmospheres/opacities, the equation of state, and in their treatment of convection. With respect to the former, the models essentially differ in terms of whether the atmosphere models used are gray or non-gray, and whether molecular opacity effects are included at low effective temperatures. The differences with respect to convection are somewhat more subtle. Except for one set of models that uses the Full Spectrum Turbulence (FST) formalism of Canuto et al. (1996), the models we consider in this paper use a mixing-length theory (MLT) approach, typically characterized by the mixing parameter, , defined as the ratio of the convective mixing length to the pressure scale-height, i.e. . But as discussed by Montalbán et al. (2003) and D’Antona & Montalbán (2003), to fully characterize an MLT model requires specification of a larger set of ingredients than just the single parameter . These are: the mixing parameter used in the atmosphere calculation (); the mixing parameter used in the calculation of the interior (, which can be set equal to ); and the optical depth in the atmosphere at which these two calculations are matched up (). Requiring a fit to the present-day Sun generally requires more efficient convection in the interior than in the atmosphere, that is, (Baraffe et al., 1998; Montalbán et al., 2003). For a given choice of and , larger produce lower temperatures at the base of the convection zone, resulting in less Li depletion prior to the main sequence. The parameters used by the various models considered below are summarized in Table 11. All of the tracks considered assume solar metallicity.
| Authors | Atmosphere | Convection | Matches Sun? | |||
|---|---|---|---|---|---|---|
| MDKH03 | ATLAS9 | FST | 10 | Y | ||
| ATLAS9 | MLT | 0.5 | 2.3 | 10 | Y | |
| NextGen | MLT | 1.0 | 1.0 | 3aaThese authors have also computed NextGen-based models with , but these are equivalent to the BCAH98 tracks. | N | |
| BCAH98 | NextGen | MLT | 1.0 | 1.0 | 100 | N |
| NextGen | MLT | 1.0 | 1.9 | 100 | Y | |
| PS99 | gray approx. | MLT | 1.5 | N | ||
| SDF00 | Plez, Eriksson | MLT | 1.6 | 10 | Y |
For each set of tracks, we first consider the positions of the components of V1174 Ori (catalog ) in the H-R diagram ( vs. ) and compare the stellar masses inferred from the models to those we have measured. We also consider whether the theoretical isochrones lie parallel to the observed positions.
Comparing the observations to the models in the plane of the H-R diagram is not necessarily the most robust test of the models, however, and certainly does not take full advantage of the accuracy of the measurements. Placing the stars in the H-R diagram requires deriving from and . While the measurement errors in the radii are small, the values have not been determined directly but rather converted from the observed spectral type (for the primary) and then from the ratio determined from the light curve analysis (for the secondary). Consequently, the uncertainties in the derived luminosities are relatively large. Thus for each set of tracks we also do the comparison in the mass-radius plane. In this way, not only do we preserve the accuracy of the empirical masses and radii, we also test what is perhaps the most fundamental prediction of the models: the mass-radius relationship.
One final comment is in order, regarding the placement of the primary and secondary stars in the H-R diagrams shown in Figs. 16–21. In each H-R diagram we plot two nested boxes around the measured position of the primary star. The inner box represents the region of the (, ) space allowed by the combination of the uncertainty in the primary star’s (0.5 spectral sub-type; §4.3.3) and uncertainty in its radius ( R⊙; Table 10). The outer box corresponds to twice the uncertainty in and uncertainty on the radius. This outer box should thus be regarded as the region of high confidence for the location of the primary star in the H-R diagram. We plot similar nested boxes about the position of the secondary star, but the range of here is determined by keeping the secondary-to-primary ratio fixed at the value determined from the light curve analysis (§4.4), the uncertainty of which is minuscule compared to the uncertainty in the of the primary star. Because the two stars’ positions are linked via the ratio, it is important to bear in mind that the positions of the two stars in the H-R diagram are very strongly correlated. While it may be tempting to adjust the position of each star within its own bounding box independently, the positions of the two stars relative to one another are in fact rigidly constrained.
6.1 BCAH98
We begin by considering the PMS tracks of Baraffe et al. (1998). Of the models that we consider here, these are perhaps the most generally favored in the recent literature (White et al., 1999; Simon, Dutrey, & Guilloteau, 2000; Luhman et al., 2003). The tracks use the non-gray NextGen atmospheres of Hauschildt, Allard, & Baron (1999) and treat convection using MLT. These models are shown in Figs. 16 and 17 for two different values of (1.0 and 1.9, respectively). Note that both models use NextGen atmospheres computed with (see Table 11); thus, these models differ in their convection properties only interior to an optical depth of . The tracks with are designed to match the properties of the present-day Sun.
Neither of these Baraffe et al. (1998) models succeed in simultaneously reproducing the observed positions of both components of V1174 Ori (catalog ) in the H-R diagram. The tracks with , favored by Steffen et al. (2001) in their analysis of the PMS binary NTTS 0452513016, predict a mass for the V1174 Ori (catalog ) primary of M⊙. The position of the primary excludes the 1.01 M⊙ track with confidence. Meanwhile, the track is consistent with V1174 Ori (catalog ) secondary at the level.
The tracks with , favored by the recent analysis of Luhman et al. (2003), are possibly consistent with the position of the primary of V1174 Ori (catalog ), but only by pushing the primary near the lower extreme of its bounding box. Forcing agreement with the primary in this way necessarily forces the secondary to the lower extreme of its bounding box as well. This would imply a mass for the secondary star of , completely inconsistent with its measured mass of . The 0.73 M⊙ track is K too hot relative to the position that the secondary would take if the primary were forced into agreement with its mass track.
Of the BCAH98 models considered here, only the tracks possess an isochrone in the H-R diagram (at Myr) consistent with coevality for the components of V1174 Ori (catalog ). The other tracks make the secondary appear over-luminous relative to the primary.
In the mass-radius (-) plane, both sets of tracks imply an age for the V1174 Ori (catalog ) system of Myr, though none of the tracks possess an isochrone precisely parallel to the empirical isochrone defined by the components of V1174 Ori (catalog ). Interestingly, this is true of the tracks as well, despite the fact that these tracks yield coevality for the two stars in the H-R diagram. Apparently, the empirical measurements and the theoretical isochrones translate differently between the - plane and the H-R diagram, almost certainly the result of differences in the scale. This is most readily seen in the tracks where, in the - plane, the secondary is situated below the 10 Myr isochrone and the primary is above it; in the H-R diagram their positions relative to this isochrone are reversed.
6.2 PS99
The PMS tracks of Palla & Stahler (1999) have been found to show reasonably good agreement with PMS mass measurements in a number of previous analyses (Steffen et al., 2001; Simon, Dutrey, & Guilloteau, 2000; Palla & Stahler, 2001). These models arguably use the most physically realistic initial conditions of any of the models, that of the stellar birthline (Stahler, 1983). They use a gray atmosphere approximation, and use the Alexander & Ferguson (1994) and Iglesias & Rogers (1996) opacities for below and above K, respectively. Convection is treated with MLT and . These tracks are compared with the observations of V1174 Ori (catalog ) in Fig. 18.
The PS99 models show good agreement with the position of the primary star in the H-R diagram, with the 1.01 M⊙ track passing within the inner bounding box of the primary’s position. However, the position of the secondary star excludes the 0.73 M⊙ track with confidence. As with the BCAH98 tracks, the 0.73 M⊙ track is K too hot compared to the position of the V1174 Ori (catalog ) secondary.
The PS99 models moreover yield ages for the two components of V1174 Ori (catalog ) that are non-coeval. The tracks give ages of 10 Myr and 5 Myr for the primary and secondary, respectively. Interestingly, this non-coevality in the H-R diagram is not borne out in the - plane, where the components lie precisely parallel to the theoretical isochrones (9 Myr in this case). Indeed, of the models considered in this paper, these models show the best agreement with the slope of the - relationship as defined by the components of V1174 Ori (catalog ).
6.3 SDF00
Next, we consider the PMS models of Siess, Dufour, & Forestini (2000). These models, shown in Fig. 19, use the Alexander & Ferguson (1994) and Iglesias & Rogers (1996) opacities, and the model atmospheres of Plez (1992) and Kurucz (1991). They treat convection with MLT and to match the present-day Sun.
These tracks behave in a similar fashion as the PS99 tracks. In particular, the position of the V1174 Ori (catalog ) primary is precisely matched by the theoretical 1.01 M⊙ track, but the agreement with the location of the V1174 Ori (catalog ) secondary is extremely poor. Indeed, the theoretical 0.73 M⊙ track is a full K too hot compared to the observed position of the secondary star. These tracks, like the others considered above, appear to be too compressed in to simultaneously fit the primary and secondary of V1174 Ori (catalog ).
As with the Palla & Stahler (1999) models, these tracks yield non-coeval ages for the two components of V1174 Ori (catalog ). Once again, the inferred ages for the primary and secondary stars differ by a factor : in this case, Myr and Myr for the primary and secondary, respectively. But as with the PS99 models, despite non-coevality in the H-R diagram, these models produce isochrones in superb agreement with the observations in the - plane (7 Myr).
6.4 MDKH03
Finally, we consider the new PMS evolutionary tracks of Montalbán et al. (2003), descended from the earlier models of D’Antona & Mazzitelli (1997). These authors have produced a variety of models that treat convection via MLT or FST, with the non-gray atmospheres from Hauschildt, Allard, & Baron (1999) or Heiter et al. (2002), respectively. For the models using the NextGen atmospheres of Hauschildt, Allard, & Baron (1999), the authors compute families of models with different values of . Here we consider three models as listed in Table 11. These models are compared with the measured positions of the components of V1174 Ori (catalog ) in Figs. 20–21.
The MLT models with NextGen atmospheres and are most comparable to the BCAH98 tracks in Fig. 16. As the only substantial difference between these models is the depth of the outer atmosphere ( for MDKH03 tracks vs. 100 for BCAH98 tracks), these tracks yield very similar results. The only notable difference appears to be in the rate at which the models contract, with the tracks yielding slightly younger ages, as seen in the - plane.
In contrast, both the MLT and FST models, with the ATLAS9 atmospheres of Heiter et al. (2002), show excellent agreement with the position of the V1174 Ori (catalog ) in the H-R diagram, with the FST models being K hotter. Unfortunately, these models do not permit a comparison with the V1174 Ori (catalog ) secondary as the Heiter et al. (2002) atmospheres do not extend below 4000 K. However, the general behavior of these tracks in the H-R diagram suggests that the 0.73 M⊙ track could intersect the position of the secondary if the calculation were extended to lower .
Indeed, these ATLAS9-based models differ qualitatively from all of the other models considered above in terms of the general shape of the tracks. These models exhibit a dramatic sweep to cooler , and then back to hotter , as the stars descend their tracks, particularly for . The effect is to spread the mass tracks over a larger range of at ages between 3–30 Myr, possibly consistent simultaneously with the primary and secondary of V1174 Ori (catalog ).
6.5 Other mass measurements of PMS stars
As we have seen, the empirical mass measurements of V1174 Ori (catalog ) provide important constraints on the absolute mass calibration of PMS evolutionary tracks, both in the H-R diagram and in the - plane, between 0.7 M⊙ and 1.0 M⊙. In this section, we combine our measurements of V1174 Ori (catalog ) with extant mass measurements of other PMS stars in order to extend our analysis to a larger range in stellar mass and to compare our findings among stars in both binary and single systems.
Empirical mass determinations exist in the literature for twelve101010We exclude from this discussion RS Cha A and B ( and respectively), because of their high masses. We also exclude BP Tau () because of the large uncertainty on the mass determination () and the large uncertainty on its distance (Simon, Dutrey, & Guilloteau, 2000). other PMS stars—8 in binary systems, 4 single—with masses accurate to better than and that are within the range covered by the PMS tracks considered above (). These are: TY CrA B with (Casey et al., 1998); AK Sco A and B, both with (Alencar et al., 2003); EK Cep B with (Popper, 1987); NTT 0452513016 A and B with and (Steffen et al., 2001); RXJ0529.40041 A and B with and (Covino et al., 2000); Lk Ca 15 with (Simon, Dutrey, & Guilloteau, 2000); GM Aur with (Simon, Dutrey, & Guilloteau, 2000); DL Tau with (Simon, Dutrey, & Guilloteau, 2000); and DM Tau with (Simon, Dutrey, & Guilloteau, 2000).
In Figs. 22–26 we show all of these stars together on H-R diagrams with the different PMS tracks discussed above. Binary and single stars are plotted separately in each figure. This ensemble of , luminosities, and the uncertainties therein are taken from the compilation of Luhman et al. (2003), which used the same temperature scale used in this study. To this compilation we have added the secondary of TY CrA (Casey et al., 1998), the two (identical) components of AK Sco (Alencar et al., 2003), and the two components of V1174 Ori (catalog ). Thus the measurements represented in Figs. 22–26 are all based on a consistent scale.
We note that the listed uncertainties in the masses of the single stars do not include systematic uncertainties on the distances to those stars, which can amount to an additional uncertainty on the masses (Simon, Dutrey, & Guilloteau, 2000). We note also that the meanings of the error bars in and in take on somewhat different meanings for the binary and single stars. For the single stars and the components of the astrometric binary NTT 042513016, these quantities are measured independently, whereas for stars in eclipsing binaries these quantities are coupled because is derived from and the stellar radii. Finally, we note that for the binary stars the individual masses are coupled to one another by virtue of the measured mass ratio; adjusting the mass of one component necessarily adjusts that of the other. These considerations constrain the extent to which individual objects can be “fine-tuned” into agreement with the models.
We do not find a set of tracks that reproduces the observed locations of these stars simultaneously at both high and low masses, and in both binary and single systems.
Consider the BCAH98 tracks with (Fig. 22), which have the coolest temperatures of all the tracks we have examined. These tracks agree with most of the binary stars, so long as the masses of individual objects are in some cases adjusted within their uncertainties. For example, for the tracks to be consistent with the primary of NTT 0452513016, its mass must be adjusted downward by . Of course, doing this requires that the mass of the secondary also be adjusted downward by , implying a true mass of 0.72 M⊙ for the secondary. Even so, the tracks miss this star by . The greatest challenge to these tracks among the binaries is the 1.01 M⊙ primary of V1174 Ori (catalog ), which has the most accurate mass determination of the lot. This failure to match the V1174 Ori (catalog ) primary is amplified by the position of LkCa 15; with a very similar mass of , it is located at almost precisely the same position in the H-R diagram. And like V1174 Ori (catalog ) A, LkCa 15 is not matched by these models.
Indeed, none of the single stars are matched by these tracks, the tracks being systematically too cool. The single stars are better matched by the BCAH98 tracks (Fig. 23), which are K warmer, a conclusion also reached by Luhman et al. (2003). However, these tracks have difficulty when compared against the binaries, especially for those with .
The other models show similarly mixed success in reproducing the observations. The PS99 tracks (Fig. 24) perform comparably to the BCAH98 tracks, matching the positions of all of the single stars and, with the notable exception of NTT 0452513016 A, matching the binaries with (including the primary of V1174 Ori (catalog )) very well. However, the lower-mass binary components—including the secondary of V1174 Ori (catalog )—are poorly matched by these tracks. The results for the SDF00 models (Fig. 25) are very similar as well, though with the warmest and most closely spaced tracks of those considered here, the discrepancies among the lowest-mass stars are particularly severe, even for the single star DM Tau. Finally, a full evaluation of the MDKH03 MLT ATLAS9 tracks (Fig. 26) is not possible because they do not extend below 4000 K. However, based on the qualitative behavior of these tracks it appears possible that they could perform well over a broad range of masses and for both binary and single stars. The lower temperatures of these tracks means that they agree with many of the higher-mass binary stars (though again with NTT 0452513016 A being a clear outlier), and with their horizontal sweep in —effectively stretching the scale for stars with —may be able to simultaneously match the positions of the lower-mass binaries and single stars.
For completeness, we show in Figs. 27–28 the mass-radius relation for the three PMS binaries for which empirical mass measurements exist for both components (V1174 Ori (catalog ), NTT 0452513016, and RXJ0529.40041). With the relatively large error bars on the components of NTT 0452513016 and RXJ0529.40041, we can draw limited conclusions here. All of the models show qualitative agreement with the general slope of the mass-radius relationship. However, the agreement does appear to be best among the tracks with low values of , with the BCAH98 tracks and the PS99 tracks providing the best fit to the observations. The SDF00 tracks perform reasonably well, whereas the tracks with large (e.g. BCAH98 with ) are least consistent with these measurements.
It is valuable and instructive to consider what insights can be gained from the observations alone, independently of the models. First of all, it appears clear that the masses of the components of NTT 0452513016 are over-estimated. The primary star is at a very similar position in the H-R diagram to that of the 1.01 M⊙ primary of V1174 Ori (catalog ), despite having a measured mass that is considerably larger. It does have a somewhat higher luminosity, so it is possible that it does indeed have a slightly higher mass than does V1174 Ori (catalog ) A. This conclusion is bolstered by the secondary of NTT 0452513016; its position in the H-R diagram, suggesting a mass slightly less than the 0.73 M⊙ secondary of V1174 Ori (catalog ), belies its measured mass of 0.81 M⊙. That NTT 0452513016 may be an outlier may not be surprising given the large uncertainties inherent to the analysis of this astrometric binary, for which only of the orbit has been mapped (Steffen et al., 2001). Indeed, simply adjusting the mass of the NTT 0452513016 primary down by 1–2, while keeping the mass ratio fixed, would appear to bring the measurements of NTT 0452513016 and V1174 Ori (catalog ) into closer empirical agreement.
Similar concerns arise with the components of the eclipsing binary RXJ0529.40041. Here, the position of the primary star in the H-R diagram coincides closely with that of TY CrA B, despite the latter having a precisely determined mass that is 30% larger. At the same time, however, the secondary of RXJ0529.40041 is located beween the two components of V1174 Ori (catalog ), which is appropriate for its measured mass intermediate beween those of V1174 Ori (catalog ) A and B. This suggests that the primary (and perhaps the secondary as well) are simply over-luminous, which would tend to implicate the stellar radii in this case since, again, the of the secondary appears approximately correct relative to the components of V1174 Ori (catalog ). Upon re-examination of the Covino et al. (2000) results for RXJ0529.40041, it appears that the uncertainties they report for the luminosities are underestimated. For example, the fractional uncertainty reported by them for the luminosity of RXJ0529.40041 A (8%) is smaller than the fractional uncertainty they report (11%) for the radius alone. Including the uncertainty in as well gives a more appropriate uncertainty in the luminosity of .
In some cases, the observations place objects of similar masses at similar positions in the H-R diagram, bolstering their credibility. For example, the primary of V1174 Ori (catalog ) and LkCa 15, both with , have very nearly the same and . The same is true for RXJ0529.40041 B and GM Aur, both with . Even though these latter measurements have somewhat larger uncertainties, the lower luminosity of RXJ0529.40041 B relative to (the presumably younger) GM Aur in effect provides an empirical mass track for between 3–10 Myr.
But there are also cases where the data seem at odds with one another. For example, V1174 Ori (catalog ) B and DM Tau occupy similar positions in the H-R diagram despite having masses of and , respectively. This is worrisome. One way to reconcile this apparent contradiction is to have mass tracks, like the MLT ATLAS9 tracks of Montalbán et al. (2003), that are double-valued in at low masses, allowing stars with different masses to have similar at certain times. While these tracks do not presently extend to the masses of V1174 Ori (catalog ) B and DM Tau, inspecting these tracks in Fig. 26 one can imagine that these stars’ positions would be well matched by their respective tracks, particularly with DM Tau being somewhat more luminous than V1174 Ori (catalog ) B.
Another possible explanation for the discordance between these measurements is that the uncertainties in the masses for the single stars are underestimated. Indeed, in contrast to the distance-independent masses derived for V1174 Ori (catalog ), the masses determined for the single stars (from spatially resolved disk rotation profiles; Simon, Dutrey, & Guilloteau (2000)) depend directly upon the distance assumed. As noted by Simon, Dutrey, & Guilloteau (2000), the distance uncertainty to any particular star in Taurus may be as large as , manifesting itself as a systematic error in the dynamical mass determination.
DL Tau may serve as a case in point. Its measured mass of 0.72 M⊙ is similar to the mass of 0.73 M⊙ we have measured for the secondary of V1174 Ori (catalog ). Yet DL Tau is 450 K hotter than V1174 Ori (catalog ) B, suggesting a mass more comparable to that of V1174 Ori (catalog ) A. An important additional clue to the relative masses of these two objects is provided by their relative Li abundances. In Fig. 29 we show the Li abundances, (Li), for all of the PMS stars discussed above for which Li measurements exist in the literature. These stars exhibit a clear correlation of (Li) with stellar mass: Stars with show undepleted levels of Li, while less massive stars show a trend of monotonically decreasing Li abundance with decreasing stellar mass. DL Tau is a clear outlier in this trend. Its measured (Li), even with its large uncertainties, is too high for its mass. In contrast, V1174 Ori (catalog ) B follows the empirical trend nicely. The observed Li abundance of DL Tau implies a lower limit to its mass of , consistent with its location in the H-R diagram relative to V1174 Ori (catalog ) A. Whether the masses of V1174 Ori (catalog ) B and DM Tau can be similarly reconciled is unknown; there is no published Li abundance for DM Tau.
The observed pattern of Li depletion with stellar mass provides more general constraints on PMS evolutionary tracks, particularly with respect to the efficiency of convection. As discussed in detail by D’Antona & Montalbán (2003), models with more efficient convection (i.e. larger ) result in dramatically more Li depletion than do models with less efficient convection.
Consider a star like V1174 Ori (catalog ) A, having and situated near the bottom of its Hayashi phase of evolution. Assuming an initial Li abundance of (Li), a model with will have (Li) whereas a model with a more modest will have (Li) (D’Antona & Montalbán, 2003). The primary of V1174 Ori (catalog ) is more consistent with the low Li depletion predicted by the model. At lower masses, the depletion predicted for models with highly efficient convection becomes ever more severe. A star with is predicted to have (Li) by the models, completely inconsistent with the modest depletion levels seen in Fig. 29, which agree with the predicted levels of depletion for models (D’Antona & Montalbán, 2003). Thus the Li depletion measurements strongly favor models with low .
At low masses, the Li depletion levels predicted by the models also become strongly dependent upon the parameter . Larger values of result in a larger fraction of the over-adiabatic region being computed with the low value of adopted in the model atmosphere. This produces a reduced temperature at the base of the convection zone, resulting in lower levels of Li depletion. A more detailed analysis of the observed Li abundances as a function of stellar mass is beyond the scope of this paper. But coupled with the precise mass determinations for PMS stars, such as we have determined here, the clear pattern of Li depletion with stellar mass should in principle provide important additional constraints on various key parameters of PMS evolutionary models. Moreover, as we have seen here, Li abundances can provide valuable, independent mass constraints as well when systematic uncertainties (e.g. distance) may limit the accuracy of the dynamical measurements.
7 Summary and Conclusions
We have identified the star V1174 Ori (catalog ) as a previously unknown, double-lined, spectroscopic, pre–main-sequence (PMS) eclipsing binary system in the Orion star-forming region.
From high-cadence, multi-epoch, multi-band, time-series photometry spanning 2900 days, we find the period of the system to be 2.634727 days. From multi-epoch, high-resolution spectroscopy, we determine a precise, double-lined orbit solution which constrains the absolute masses of the primary and secondary components to be 1.01 M⊙ and 0.73 M⊙, respectively, accurate to %. Synthetic light-curve modeling and analysis provides absolute stellar dimensions. We find the stars to have radii of 1.34 R⊙ and 1.06 R⊙, respectively, again with uncertainties of %. These empirical mass and radius measurements are distance-independent. The secondary is thus the lowest-mass PMS star yet discovered in an eclipsing binary system, and the first sub-solar PMS star with an empirically determined mass accurate to better than a few percent.
We determine the distance to the system to be pc which, together with the system’s center-of-mass radial velocity, makes V1174 Ori (catalog ) a likely member of the Ori OB1c region. It is therefore likely slightly in the foreground of, and slightly older than, the Orion Nebula Cluster (ONC) proper. Given the spread of available estimates for the bolometric magnitude of the Sun, we cannot currently constrain the absolute distance to V1174 Ori (catalog ) more stringently.
Analysis of the system colors suggests the presence of an unseen tertiary companion in a wide orbit. Follow-up photometry in the near-IR is underway, and should reveal substantial third light, which we predict to be % in .
We compare the empirically determined stellar dimensions with a variety of PMS stellar evolution models in both the H-R diagram (, plane) and the mass-radius plane. In all cases, the models yield an age for V1174 Ori (catalog ) of –10 Myr, consistent with membership in the slightly evolved Ori OB1c region, just in the foreground of the ONC.
While all of the models predict the slope of the mass-radius relationship reasonably well, those with less efficient convection (i.e. small convection parameter ) are the most consistent with our measurements, even though larger values of are required to match the present-day Sun. While some models are consistent with the mass of the V1174 Ori (catalog ) primary, and others are consistent with the mass of the V1174 Ori (catalog ) secondary, none of the models correctly predict the masses of both stars simultaneously. This apears to be the result of the theoretical mass tracks between 0.7–1.0 M⊙ being too compressed in relative to the components of V1174 Ori (catalog ). Recent models by Montalbán et al. (2003) employing the ATLAS9 atmospheres of Heiter et al. (2002) seem to show a larger spread of in this mass range, and could possibly fit both components of V1174 Ori (catalog ), but these models do not presently extend to masses low enough to test against the V1174 Ori (catalog ) secondary.
Potential problems with the scale are also implicated by a curious effect in which the theoretical tracks and the empirical measurements translate differently between the mass-radius plane and the H-R diagram. Some of the tracks show the components of V1174 Ori (catalog ) to be coeval in the H-R diagram but non-coeval in the mass-radius plane, and vice-versa for others.
Analysis of the H-R diagram positions of all PMS stars with empirical mass measurements yields mixed results for all of the PMS models we examined, with no one set of models clearly superior to the others. However, the ensemble of observations appear to be least compatible with the tracks of Siess, Dufour, & Forestini (2000), which have the hottest and most compressed scale of any of the tracks we examined. Again, the ATLAS9-based models of Montalbán et al. (2003) show promise of being able to reproduce most of the empirical measurements, and we encourage the extension of these models to lower .
We have carefully scrutinized the ensemble of empirical PMS mass measurements for consistency with one another, independent of the models. Encouragingly, we find instances of superb agreement between independent mass determinations, such as V1174 Ori (catalog ) A and LkCa 15 (a single star in Taurus), which have identical masses and are at identical positions in the H-R diagram. But, disconcertingly, we also find instances of apparent contradiction, such as V1174 Ori (catalog ) B and DM Tau, which are at similar (though not identical) positions in the H-R diagram yet have very different masses.
These apparently discordant empirical measurements may be reconcilable, however. PMS evolutionary models that are double-valued in , such as the ATLAS9-based models of Montalbán et al. (2003), may in fact predict the H-R diagram positions observed for these stars. In some cases, such as the astrometric binary NTT 0452513016 and the eclipsing binary RXJ0529.40041, we reconcile the disagreements by adjusting the masses of the stars within the uncertainties. In another case—the single star DL Tau—we find compelling evidence in the form of an anomalous Li abundance that the reported mass is incorrect, most likely the result of a systematic error in the assumed distance.
Indeed, we find that the ensemble of PMS stars with empirical mass determinations possess a remarkably well-defined pattern of Li depletion as a function of stellar mass. The mild amount of depletion observed in the lowest-mass star, V1174 Ori (catalog ) B, strongly constrains the efficiency of convection that can be acting in the interiors of these stars, and argues strongly in favor of models with small convection parameters, . Thus, as argued by D’Antona & Montalbán (2003), Li abundance determinations in PMS stars promise to provide an important observational window into the interior structure of PMS stars. And, as we have shown in the case of DL Tau, Li can provide a valuable means for triangulating against the dynamical masses of these stars in the presence of systematic errors.
References
- Alencar et al. (2003) Alencar, S. H. P., Melo, C. H. F., Dullemond, C. P., Andersen, J., Batalha, C., Vaz, L. P. R., & Mathieu, R. D. 2003, A&A, 409, 1037
- Alencar & Vaz (1997) Alencar, S.H.P. & Vaz, L.P.R. 1997, A&A 326, 257
- Alencar et al. (1999) Alencar, S.H.P., Vaz, L.P.R., & Nordlund Å. 1999, A&A 346, 556
- Alexander & Ferguson (1994) Alexander, D. R. & Ferguson, J. W. 1994, ApJ, 437, 879
- Andersen (1991) Andersen, J. 1991, A&A Rev., 3, 91
- Ali & Depoy (1995) Ali, B. & Depoy, D. L. 1995, AJ, 109, 709
- Anthony-Twarog (1982) Anthony-Twarog, B. J. 1982, AJ, 87, 1213
- Bally, O’Dell, & McCaughrean (2000) Bally, J., O’Dell, C. R., & McCaughrean, M. J. 2000, AJ, 119, 2919
- Baraffe et al. (1998) Baraffe, I., Chabrier, G., Allard, F., & Hauschildt, P. H. 1998, A&A, 337, 403
- Basri & Batalha (1990) Basri, G. & Batalha, C. 1990, ApJ, 363, 654
- Basri, Martín, & Bertout (1991) Basri, G., Martín, E. L., & Bertout, C. 1991, A&A, 252, 625
- Blaauw (1964) Blaauw, A. 1964, ARA&A, 2, 213
- Brown, de Geus, & de Zeeuw (1994) Brown, A. G. A., de Geus, E. J., & de Zeeuw, P. T. 1994, A&A, 289, 101
- Buser & Kurucz (1992) Buser R. & Kurucz R.L., 1992, A&A 264, 557
- Caloi, D’Antona, & Mazzitelli (1997) Caloi, V., D’Antona, F., & Mazzitelli, I. 1997, A&A, 320, 823
- Canuto et al. (1996) Canuto, V. M., Goldman, I., & Mazzitelli, I. 1996, ApJ, 473, 550
- Carpenter, Hillenbrand, & Skrutskie (2001) Carpenter, J. M., Hillenbrand, L. A., & Skrutskie, M. F. 2001, AJ, 121, 3160
- Casey et al. (1997) Casey B.W., Mathieu R.D., Vaz L.P.R., Andersen J. & Suntzeff N.B., 1997, AJ 115, 1617
- Casey et al. (1998) Casey, B. W., Mathieu, R. D., Vaz, L. P. R., Andersen, J., & Suntzeff, N. B. 1998, AJ, 115, 1617
- Covino et al. (2000) Covino, E., et al. 2000, A&A, 361, L49
- D’Antona & Mazzitelli (1997) D’Antona, F. & Mazzitelli, I. 1997, Memorie della Societa Astronomica Italiana, 68, 807
- D’Antona & Montalbán (2003) D’Antona, F. & Montalban, J. 2003, A&A, in press
- Dolan & Mathieu (1999) Dolan, C. J. & Mathieu, R. D. 1999, AJ, 118, 2409
- Feigelson et al. (2002) Feigelson, E. D., Broos, P., Gaffney, J. A., Garmire, G., Hillenbrand, L. A., Pravdo, S. H., Townsley, L., & Tsuboi, Y. 2002, ApJ, 574, 258
- Geier, Wendker, & Wisotzki (1995) Geier, S., Wendker, H. J., & Wisotzki, L. 1995, A&A, 299, 39
- Genzel et al. (1981) Genzel, R. et al. 1981, ApJ, 247, 1039
- Hauschildt, Allard, & Baron (1999) Hauschildt, P. H., Allard, F., & Baron, E. 1999, ApJ, 512, 377
- Heiter et al. (2002) Heiter, U. et al. 2002, A&A, 392, 619
- Herbst et al. (2002) Herbst, W., Bailer-Jones, C. A. L., Mundt, R., Meisenheimer, K., & Wackermann, R. 2002, A&A, 396, 513
- Hillenbrand (1997) Hillenbrand, L. A. 1997, AJ, 113, 1733
- Honeycutt (1992) Honeycutt, R. K. 1992, PASP, 104, 435
- Iglesias & Rogers (1996) Iglesias, C. A. & Rogers, F. J. 1996, ApJ, 464, 943
- Kallrath & Linnel (1987) Kallrath J. & Linnel A.P., 1987, ApJ 313, 346
- Kenyon & Hartmann (1995) Kenyon, S. J. & Hartmann, L. 1995, ApJS, 101, 117
- Kurucz (1991) Kurucz R.L. 1991, Stellar Atmospheres: Beyond Classical Models. eds. Crivallery L., Hibeny I., Hammer D.G., NATO ASI Series, Kluwer, Dordrecht
- Lee (1992) Lee, C. 1992, Ph.D. Thesis, University of Wisconsin
- Luhman et al. (2003) Luhman, K. L., Stauffer, J. R., Muench, A. A., Rieke, G. H., Lada, E. A., Bouvier, J., & Lada, C. J. 2003, ApJ, 593, 1093
- Martín et al. (1994) Martin, E. L., Rebolo, R., Magazzu, A., & Pavlenko, Y. V. 1994, A&A, 282, 503
- Mochnacki (1984) Mochnacki S.W., 1984, ApJS 55, 551
- Montalbán et al. (2003) Montalban, J., D’Antona, F., Kupka, F., & Heiter, U. 2003, A&A, submitted
- Muench et al. (2002) Muench, A. A., Lada, E. A., Lada, C. J., & Alves, J. 2002, ApJ, 573, 366
- Oláh et al. (2003) Oláh K., Jurcsik J., & Strassmeier K.G., 2003, A&A 410, 685
- Palla & Stahler (1999) Palla, F. & Stahler, S. W. 1999, ApJ, 525, 772
- Palla & Stahler (2001) Palla, F. & Stahler, S. W. 2001, ApJ, 553, 299
- Parenago (1954) Parenago, P. P. 1954, Trudy Gosudarstvennogo Astronomicheskogo Instituta, 25, 1
- Pavlenko & Magazzu (1996) Pavlenko, Y. V. & Magazzu, A. 1996, A&A, 311, 961
- Plez (1992) Plez B. 1992, A&A, 94, 527
- Popper (1987) Popper, D. M. 1987, ApJ, 313, L81
- Popper (1980) Popper, D. M. 1980, ARA&A, 18, 115
- Rebull (2001) Rebull, L. M. 2001, AJ, 121, 1676
- Rebull et al. (2000) Rebull, L. M., et al. 2000, AJ, 119, 3026
- Rossiter (1924) Rossiter, R. A. 1924, ApJ, 60, 15
- Schlesinger (1909) Schlesinger, F. 1909, Publ. Allegheny Obs., 1, 134
- Schmidt-Kaler (1982) Schmidt-Kaler, T. 1982, in Landolt-Bornstein, Group VI, Vol. 2, ed. K.-H. Hellwege (Berlin: Springer) 454
- Siess, Dufour, & Forestini (2000) Siess, L., Dufour, E., & Forestini, M. 2000, A&A, 358, 593
- Simon, Dutrey, & Guilloteau (2000) Simon, M., Dutrey, A., & Guilloteau, S. 2000, ApJ, 545, 1034
- Stahler (1983) Stahler, S. W. 1983, ApJ, 274, 822
- (58) Stassun, K. G., Mathieu, R. D., Mazeh, T., & Vrba, F. J. 1999, AJ, 117, 2941 (SMMV)
- Steffen et al. (2001) Steffen, A. T. et al. 2001, AJ, 122, 997
- Stellingwerf (1978) Stellingwerf, R. F. 1978, ApJ, 224, 953
- Udry et al. (1999) Udry, S. et al. 1999, ASP Conf. Ser. 185: IAU Colloq. 170: Precise Stellar Radial Velocities, 383
- Walter et al. (1988) Walter, F. M., Brown, A., Mathieu, R. D., Myers, P. C., & Vrba, F. J. 1988, AJ, 96, 297
- Warren & Hesser (1978) Warren, W. H. & Hesser, J. E. 1978, ApJS, 36, 497
- White et al. (1999) White, R. J., Ghez, A. M., Reid, I. N., & Schultz, G. 1999, ApJ, 520, 811
- Wilson (1993a) Wilson R.E., 1993a, Documentation of Eclipsing Binary Computer Model (Revision of 1992 May, updated 1993 Jan), personal communication
- Wilson (1993b) Wilson R.E., 1993b, in New Frontiers in Interacting Binary Star Research, eds. K.-C. Leung & I.-S. Nha, ASP Conference Series 38, 91
- Wilson & Devinney (1971) Wilson R.E. & Devinney E.J., 1971, ApJ 166, 605
- van Hamme (1993) van Hamme W., 1993, AJ 106, 2096
- Vaz et al. (1995) Vaz L.P.R., Andersen J.A. & Rabello Soares M.C.A., 1995, A&A 301, 693
- Vieira (2003) Vieira L.A., MSc Dissertation, Departamento de Física, Universidade Federal de Minas Gerais