Rotating disks in high-mass young stellar objects⋆
Abstract
We report on the detection of four rotating massive disks in two regions of high-mass star formation. The disks are perpendicular to known bipolar outflows and turn out to be unstable but long lived. We infer that accretion onto the embedded (proto)stars must proceed through the disks with rates of yr-1.
1 Introduction
The formation of massive stars represents a puzzle from a theoretical point of view. Unlike their low-mass counterparts, they are believed to reach the zero-age main sequence still deeply embedded in their parental cores: in particular, Palla & Stahler (1993) predict that this occurs for stellar masses in excess of 8 . Once the star has ignited hydrogen burning, further accretion should be inhibited by radiation pressure and powerful stellar winds, with the consequence that stars more massive than 8 should not exist. Two formation scenarios have been proposed to solve this paradox: non-spherical accretion (Yorke & Sonnhalter 2002) and merging of lower mass stars (Bonnell, Bate, & Zinnecker 1998). Discriminating between these two models represents a challenging observational goal.
In this context, the detection of disks would strongly favour the accretion scenario, since random encounters between merging stars are not expected to lead to axially symmetric structures. On the contrary, conservation of angular momentum is bound to cause flattening and rotation of the infalling material, thus producing disk-like bodies. Indeed, circumstellar disks have been detected in low-mass stars and found to undergo Keplerian rotation (Simon, Dutrey, & Guilloteau 2000). Similar evidence has been found in a few high-mass young stellar objects (YSOs), but in most cases the angular resolution was insufficient to assess the presence of a disk unambiguously. In conclusion, only few bona fide examples are known (see Cesaroni 2002) and all of these are associated with moderately massive stars (B1-B0). This is not sufficient to understand the role of disks in the formation of even more massive stars and establish the relevance of accretion to this process.
With this in mind, we have decided to perform a search for disks in a limited number of high-mass YSOs. For this purpose, we have selected two luminous objects with typical signposts of massive star formation such as water masers and ultracompact (UC) Hii regions. The first, G31.41+0.31 (hereafter G31), is a well studied hot core located at 7.9 kpc (Olmi et al. 1996b; Cesaroni et al. 1998), where preliminary evidence of a rotating massive disk oriented perpendicularly to a bipolar outflow has been reported in Cesaroni et al. (1994). The other, G24.78+0.08 (hereafter G24), is a cluster of massive (proto)stars with a distance of 7.7 kpc, where recently Furuya et al. (2002) have detected a pair of cores, each of these associated with a compact bipolar outflow. By analogy with G31.41 the expectation is that also in this case the cores could contain rotating disks perpendicular to the flow axes.
On the basis of previous experience with this type of objects (see, e.g., Cesaroni et al. 1999), CH3CN has been used as disk tracer. This is a low-abundance molecule which is excited in very dense regions. Therefore, searching for disks requires not only high angular resolution, but also great sensitivity given the faintness of the lines observed. In order to achieve these goals, we have used the Plateau de Bure interferometer (PdBI) at 1.4 mm in the most extended configuration. In this letter we present the discovery of four rotating disks in the two regions studied and discuss possible implications for the star formation process. A full report on the results obtained and a more detailed analysis of the data will be presented in a forthcoming article.
2 Observations
We carried out observations in the 1.4 mm continuum and CH3CN(12--11) line emission with the PdBI on 2003 March 16. The inner hole in the () plane has a radius of 15 . Line data have been smoothed to a spectral resolution of 0.5 km s-1 and channel maps were created with natural weighting, attaining a resolution of 1205 (full width at half power of the synthesized beam) and a sensitivity of 40--50 mJy/beam/channel (1 RMS). For the continuum map the resolution and sensitivity are 1205 and 4--6 mJy/beam, respectively.
In the following, we further analyze previous CS(3--2) observations obtained with the Nobeyama Millimeter Array (NMA) by Cesaroni et al. (2003), to whom we refer for technical details.
3 Results and discussion
The main goal of our study was the discovery of rotating disks associated with massive YSOs deeply embedded in dense, compact cores. This was achieved searching for well defined velocity gradients in the cores, perpendicular to molecular outflows powered by the YSOs, as illustrated in the next sections.
3.1 Structure of the cores
The region G31 consists of a hot core, detected in various high-energy lines (Olmi, Cesaroni, & Walmsley 1996a) located at the center of a bipolar outflow, at 5″ from an UC Hii region (Cesaroni et al. 1998). On the other hand, G24 is more complex, as it contains four distinct objects (see Fig. 1 of Furuya et al. 2002): two of these, G24 A and G24 C, are massive cores associated with two bipolar outflows and represent the target of the present study.
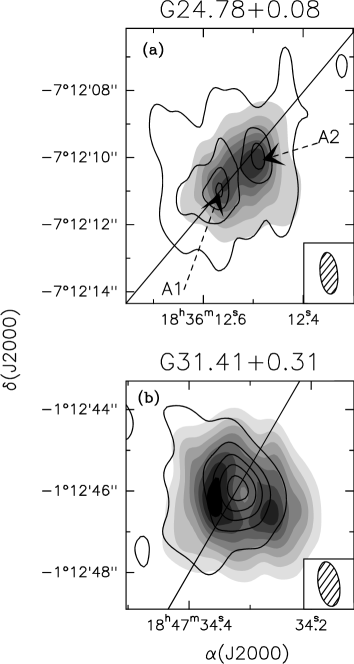
A picture of the G24 A and G31 cores is given in Fig. 1, where overlays of the 1.4 mm continuum and integrated CH3CN(12--11) line emission are shown. Note that no map is shown for G24 C because no CH3CN(12--11) line emission has been detected with the PdBI. However, the 1.4 mm continuum flux is consistent with the extrapolation of the spectral energy distribution presented by Furuya et al. (2002), thus confirming the existence of such core. Very likely the fact that G24 C is detected in the CH3CN(8--7) transitions (Furuya et al. 2002), but not in the (12--11) is due to this core being significantly colder than G24 A (see Codella et al. 1997), which makes it difficult to detect high energy lines.
When observed with sub-arcsec resolution, G24 A is resolved into two separate cores. This is evident both in the 1.4 mm continuum and line maps. In the following we shall refer to these cores as G24 A1 (the one to the SE) and G24 A2 (the one to the NW). The former lies slightly closer to the geometrical center of the bipolar outflow reported by Furuya et al. (2002), but the small separation between the cores and the fact that they are aligned along the outflow axis make it difficult to establish whether the outflow is indeed associated with G24 A1; in the following we arbitrarily assume that this is the case. The conclusions derived in our study are independent of the association of the outflow with either of the cores. Noticeably, G24 A1 coincides with an unresolved UC Hii region detected by Codella, Testi, & Cesaroni (1997), whereas no free-free emission is reported towards G24 A2. To determine whether this is an effect of different evolutionary stages of the two cores requires a detailed comparison of their physical properties which we postpone to a forthcoming paper.
The appearance of G31 is even more intriguing: while the 1.4 mm continuum seems to trace a roughly spherical core, the CH3CN map reveals a toroidal structure with the dip centered at the position of the continuum peak (Fig. 1). This suggests that either the CH3CN abundance drops dramatically in the central region of the core, due to a temperature increase towards the center (in agreement with the findings of Olmi et al. 1996b), or the temperature near to the embedded source is so high that the ground level states of CH3CN are under populated. Interestingly, the two peaks of the CH3CN emission are roughly symmetric with respect to the axis of the outflow observed by Olmi et al. (1996b), suggesting a physical connection between the toroid and the flow. Such a connection will become more evident when considering the velocity field in the cores.
3.2 Kinematics of the cores
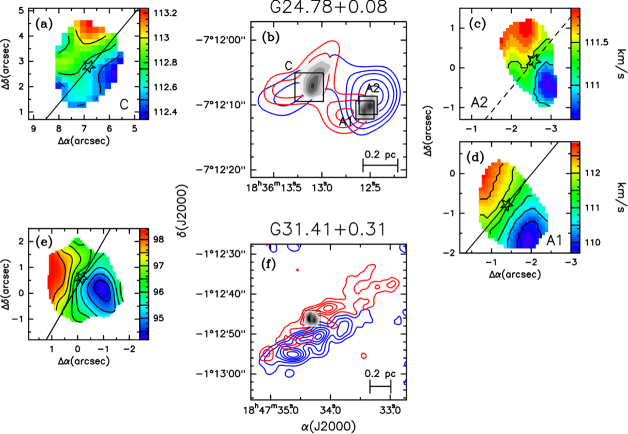
An obvious way to analyze the velocity field in the cores is to produce maps of the line peak velocity obtained with Gaussian fits. Since multiple CH3CN -components are simultaneously observed in the same intermediate-frequency bandwidth, it is possible to improve the accuracy of the fit by fitting all lines together, assuming identical widths and fixing their separations to the laboratory values (see, e.g., Olmi et al. 1993). Such a fit has been made in each point where CH3CN emission is detected. The maps of the LSR velocity for the G24 A1, G24 A2, and G31 cores can be seen in Figs. 2c, 2d, and 2e. The same method could not be applied to G24 C because the CH3CN(12--11) line emission is not detected towards this core in our PdBI observations, while the spectral resolution used for the CH3CN(8--7) transition by Furuya et al. (2002) was too poor (16 km s-1). Hence, we have re-analyzed the CS(3--2) data by Cesaroni et al. (2003), as the CS emission line was much stronger and observed with sufficient spectral resolution (0.5 km s-1). In this case the line profile deviates significantly from a Gaussian, presenting prominent emission in the red wing. Therefore we preferred to estimate the velocity from the first moment111the first moment between and is defined as , where is the brightness temperature. computed over a velocity interval including only the peak of the emission, from 108 to 116 km s-1, rather than from a Gaussian fit. The resulting map is shown in Fig. 2a.
The first conclusion that can be drawn from this figure is that all cores show clear velocity gradients, with increasing steadily along well defined directions. We examine three possible explanations for such gradients: expansion, infall, or rotation. The first can be ruled out as the velocity gradient should be maximum in the same direction as the molecular outflow, which is clearly not the case (see Figs. 2b and 2e). Spherical infall is also impossible, because self-absorption would shift the peak velocity towards lower values at the core center, whereas we observe a steady velocity increase along a well defined direction (see Figs. 2a, 2c, 2d, and 2e). The fact that such a direction is perpendicular to the outflow axis strongly favours the rotation hypothesis: this is exactly what one expects if the core is rotating about the axis of the corresponding outflow. This behaviour might be mimicked also by two distinct cores with different and too close to be resolved by our observations: the velocity gradient would be a consequence of line emission from the two cores observed in the same instrumental beam. However, we believe this to be very unlikely. In fact, at least in the case of G31, the angular separation between the regions emitting at the maximum and minimum velocities is definitely greater than the beam size. As for G24, the two cores A1 and A2 likely correspond to two distinct rotating disks. However, one cannot rule out another explanation, namely that they are part of the same geometrically thick rotating disk: in this case, the two emission peaks would be produced by the interaction of the outflow with the dense material of the disk.
In conclusion, we believe that the most plausible explanation for the kinematics of G24 and G31 is that the cores have toroidal structures undergoing rotation about the corresponding outflow axis. Hereafter, we shall refer to these simply as disks, although one has to keep in mind that these are very different from the geometrically thin circumstellar disks seen in low-mass YSOs.
3.3 Nature of the G24 and G31 disks
The major question raised by our results is whether the disks are stable entities. In Table 1 we give a few disk parameters, among which the mass of the cores, , and the dynamical mass, , needed for equilibrium. The former was estimated from the millimeter continuum emission assuming a mass opacity of cm-2 g-1 at 1.4 mm for a gas-to-dust ratio of 100 (see, e.g., André, Ward-Thompson, & Barsony 2000), and the temperatures listed in Table 1; the latter was computed assuming equilibrium between centrifugal and gravitational forces from the expression , where is the rotation velocity, is the radius of the disk, and is the inclination angle of the disk assumed to be . is much larger than , suggesting that the disks may be unstable. In principle, magnetic fields could stabilize the disks, but this would require a few 20--40 mG, values too large to be plausible even in regions as dense as cm-3 (see Fig. 1 of Crutcher 1999). Therefore, the disks must be transient structures with lifetimes of the order of the free-fall time, , also listed in Table 1. Another estimate of the disks lifetime, , can be derived from the ratio between the disk mass, , and the accretion rate. The latter is computed from the expression where is the surface density and is the infall velocity, which has been assumed to be equal to the rotation velocity following Allen, Li, & Shu (2003). As one can see from Table 1, is very close to , and both agree within a factor 4 with the outflow age, , derived from the data of Olmi et al. (1996b) and Furuya et al. (2002). Note that is to be multiplied by to correct for the (unknown) inclination angle of the flow with respect to the line of sight. We believe that cannot differ significantly from otherwise blue- and red-shifted emission would mix up in the plane of the sky (for ) or along the line of sight through the center (for ): this implies a correction factor of order unity. The correction factors for and would be 1.7 and 0.6 respectively.
In conclusion, the lifetime of the disks seems to be of order of yr. Such a short lifetime should imply 10 times less disks than UC Hii regions, which are supposed to live yr (Wood & Churchwell 1989). Although it is obviously impossible to confirm this estimate on a statistical ground, disks appear to be an ubiquitous phenomenon in massive star forming regions, as we have detected 4 of them in 2 regions only. Therefore, it seems unlikely that disks are 10 times less numerous than UC Hii regions. This implies a significantly longer lifetime than yr, which in turn means that disks must be fed by a larger scale reservoir of material at a rate comparable to yr-1. Accretion rates that large have been estimated by Fontani et al. (2002) for the parsec-scale clumps where high-mass star formation is observed.
If the disk lifetime is comparable to that of UC Hii regions, then the total accreted mass should result in of stars, too large a value for a single star, but acceptable if the infalling gas is accreting onto a cluster of stars. Indeed, this resembles the situation in the Orion cluster (Palla & Stahler 1999), where only 7% of the mass in stars (600 ) is contained in the most massive star of the cluster (40 ).
The main finding of our study is that we have detected rotating disks associated with high-mass YSOs, and hence, this result strongly suggests that non-spherical accretion is a viable mechanism to form high-mass stars. Only a larger number of observations may confirm this conclusion on a statistical ground, thus assessing that disks are a natural product of the star formation process also for early-type stars.
References
- (1) Allen, A., Li, Z. Y., & Shu, F. H. 2003, ApJ, in press
- (2) André, P., Ward-Thompson, D., & Barsony, M. 2000, in Protostars and Planets IV, ed. V. Mannings, A. Boss, & S. Russell (Tucson: Univ. Arizona Press), 59
- (3) Bonnell, I. A., Bate, M. R., & Zinnecker, H. 1998, MNRAS, 298, 93
- (4) Cesaroni, R., Olmi, L., Walmsley, C. M., Churchwell, E., & Hofner, P. 1994, ApJ, 435, L137
- (5) Cesaroni, R., Hofner, P., Walmsley, C. M., & Churchwell, E. 1998, A&A, 331, 709
- (6) Cesaroni, R., Felli, M., Jenness, T. et al. 1999, A&A, 345, 949
- (7) Cesaroni, R. 2002, Highlights of Astronomy, 12, 156
- (8) Cesaroni, R., Codella, C., Furuya, R. S., & Testi, L. 2003, A&A, 401, 227
- (9) Codella, C., Testi, L., & Cesaroni, R. 1997, A&A, 325, 282
- (10) Crutcher, R. M. 1999, ApJ, 520, 706
- (11) Furuya, R. S., Cesaroni, R., Codella, C. et al. 2002, A&A, 390, L1
- (12) Fontani, F., Cesaroni, R., Caselli, P., & Olmi, L. 2002, A&A, 389, 603
- (13) Olmi, L., Cesaroni, R., & Walmsley, C. M. 1993, A&A, 276, 489
- (14) Olmi, L., Cesaroni, R., & Walmsley, C. M. 1996a, A&A, 307, 599
- (15) Olmi, L., Cesaroni, R., Neri, R., & Walmsley, C. M. 1996b, A&A, 315, 565
- (16) Palla, F., & Stahler, S. W. 1993, ApJ, 418, 414
- (17) Palla, F., & Stahler, S. W. 1999, ApJ, 525, 772
- (18) Simon, M., Dutrey, A., & Guilloteau, S. 2000, ApJ, 545, 1034
- (19) Wood, D. O. S., & Churchwell, E. 1989, ApJS, 69, 831
- (20) Yorke, H. W., & Sonnhalter, C. 2002, ApJ, 569, 846
| Core | \phantom{.}a\phantom{.}afootnotemark: | |||||||||
|---|---|---|---|---|---|---|---|---|---|---|
| (K) | (pc) | (km s-1) | () | () | (yr) | (yr) | (yr) | (yr-1) | (yr-1) | |
| G24 A1 | 80bb From Codella et al. (1997). | 0.02 | 1.50 | 23 | 130 | \phantom{.}c\phantom{.}cfootnotemark: | \phantom{.}c\phantom{.}cfootnotemark: | |||
| G24 A2 | 80bb From Codella et al. (1997). | 0.02 | 0.75 | 4 | 80 | --- | --- | |||
| G24 C | 30bb From Codella et al. (1997). | 0.04 | 0.50 | 5 | 250 | \phantom{.}c\phantom{.}cfootnotemark: | \phantom{.}c\phantom{.}cfootnotemark: | |||
| G31 | 230dd From Olmi et al. (1996b). | 0.04 | 2.10 | 87 | 490 | \phantom{.}d\phantom{.}dfootnotemark: | \phantom{.}d\phantom{.}dfootnotemark: |