FUSE observations of G22629:
First detection of the H2 quasi-molecular satellite at 1150 Å
Abstract
We present new FUV observations of the pulsating DA white dwarf G22629 obtained with the Far Ultraviolet Spectroscopic Explorer (FUSE). This ZZ Ceti star is the brightest one of its class and the coolest white dwarf observed by FUSE. We report the first detection of the broad quasi-molecular collision-induced satellite of Ly- at 1150 Å, an absorption feature that is due to transitions which take place during close collisions of hydrogen atoms. The physical interpretation of this feature is based on recent progress of the line broadening theory of the far wing of Ly-. This predicted feature had never been observed before, even in laboratory spectra.
1 Introduction
DA white dwarfs have hydrogen-rich atmospheres whose FUV spectra show the Lyman series lines. Spectra of these high gravity stars are modeled by theoretical spectra based on the Stark broadening of the hydrogen lines (see, e.g., Vidal, Cooper, & Smith 1973; Finley et al. 1997; Barstow et al. 2003). FUV and UV observations of some DA white dwarfs show, however, strong deviations from the Stark broadening. Greenstein (1980) and Holm et al. (1985) reported that International Ultraviolet Explorer (IUE) spectra of cool white dwarfs show strong absorption features in the far wing of Ly- near 1400 Å and 1600 Å. Koester et al. (1996) announced the presence of similar features in the red wing of Ly- by analyzing observations of Wolf 1346 obtained with the Hopkins Ultraviolet Telescope. More recently, absorption features in the wing of Ly- were detected in the Orbiting and Retrievable Far and Extreme Ultraviolet Spectrometers (ORFEUS) and Far Ultraviolet Spectroscopic Explorer (FUSE) spectra of white dwarfs (Koester et al. 1998; Wolff et al. 2001; Hébrard et al. 2003; Dupuis et al. 2003). All these absorption features are interpreted as quasi-molecular satellites of Ly- (Koester et al. 1985; Nelan & Wegner 1985), Ly- (Koester et al. 1996), or Ly- (Hébrard et al. 2003). Quasi-molecular lines arise from radiative collisions of excited atomic hydrogen with unexcited neutral hydrogen atoms or protons.
Theoretical calculations of the complete Ly- line profile which include perturbations by both neutral hydrogen and protons (Allard et al. 2000) have been used recently to improve theoretical modeling of synthetic spectra for cool DA white dwarfs (Hébrard et al. 2002a). These new calculations reveal in particular a broad H2 collision-induced satellite in the red wing of Ly- at 1150 Å. This satellite appears in models covering a narrow range of effective temperatures and is strong enough to be detected in spectra of cool DA white dwarfs with K. In addition to that, the H2 1150 satellite is very sensitive to the degree of ionization and represents a potentially important means to diagnose the convective mixing efficiency in DA white dwarfs, especially in this range of effective temperatures (see, e.g., Bergeron et al. 1992). Even in laboratory work, where a laser-produced plasma generates controlled conditions similar to those encountered in stellar atmospheres of cool white dwarfs, this transition has yet to be detected.
The effective temperature domain in which the H2 1150 satellite is the strongest includes an important class of stars: the ZZ Ceti stars. ZZ Ceti stars are a class of hydrogen-rich atmosphere white dwarfs exhibiting multi-periodic variations with period ranging from 100 to 1000 s that are produced by non-radial g-modes (see, e.g., the recent review by Fontaine, Brassard, & Charpinet 2003). According to Bergeron et al. (1995) all ZZ Ceti stars occupy an empirical instability strip delimited by . These objects have a great astrophysical interest because seismological studies allow to probe their interiors and therefore provide insights for constraining the stellar structure and evolution of white dwarfs. ZZ Ceti stars represent an evolutionary phase through which all DA stars must evolve. Hébrard et al. (2002a) have predicted that both H2 and H satellites of the Ly- and Ly- lines should be detectable in ZZ Ceti stars.
Far-UV spectra have never been explored for any ZZ Ceti star. The observations obtained with IUE and HST were limited to the red wing of Ly-. Here, we present a far-UV spectrum (down to 1000 Å) of the brightest object of this class, G22629. These data allow us to report the first detection of the H2 Ly- collision-induced (CI) satellite at 1150 Å.
2 The collision-induced satellite at 1150 Å
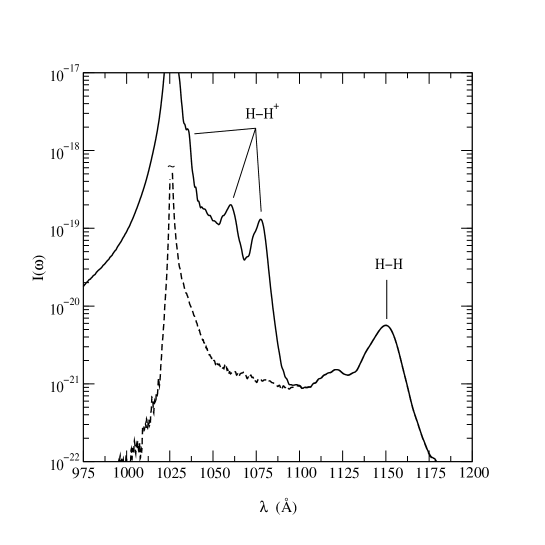
Based on a theoretical study of the Ly- profile of atomic hydrogen perturbed by collisions with neutral hydrogen atoms and protons (Allard et al. 2000), we predict a CI satellite feature of H2 at 1150 Å. In summary, our theoretical approach is based on the quantum theory of spectral line shapes of Baranger (1958a, 1958b) developed in an adiabatic representation to include the degeneracy of atomic levels (Royer 1974; Royer 1980; Allard et al. 1994). Key ingredients in our calculations are the potential energies for each electronic state of the H or H2 molecule ( denotes the internuclear distance between the radiator and the perturber). For H-H+ collisions, we have used the H potentials calculated by Madsen & Peek (1971) and, for H-H, the H2 potentials calculated by Detmer et al. (1998) and Schmelcher (2000). The resulting complete Ly- profile is shown in Fig. 1. The broad line satellite near 1150 Å is due to the perturbation in an atomic hydrogen collision corresponding to the transition of H2.
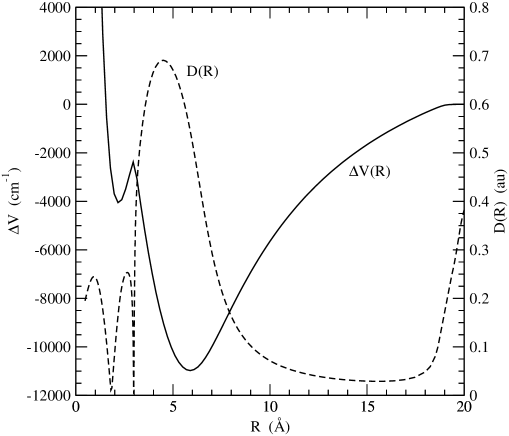
The properties of the H2 CI satellite can be better understood by studying Fig. 2, which illustrates the difference potential energies for this transition:
| (1) |
where and label the energy surfaces on which the interacting atoms approach the initial and final atomic states of the transition as . The most significant characteristic of the potential curve is the existence of the double wells. Each extremum in the difference potential leads, in principle, to a corresponding satellite feature in the wing of Ly-. Another important feature is that at larger internuclear separation, up to Å, the state has an ionic character. The ionic interaction weakens slowly ( versus dependence) thus making the potential energy difference broad compared to the steep well of the B-X transition which gives rise to the 1600 Å satellite in the Ly- wing. This different shape is important because the position of the extremum and the functional dependence of the potential difference on internuclear separation determine the amplitude and shape of the satellites (Allard et al. 1994).
The satellite amplitude depends also on the value of the electric dipole transition moment (dashed line on Fig. 2) taken between the initial and final states of the radiative transition. The dependence of the moment on the separation of the atoms during a collision modifies relative contributions to the profile along the collision trajectory. Line profile calculations have been done in a classical path theory which takes into account the variation of the electric dipole moment during a collision (see, Allard et al. 1999). For the transitions contributing to Ly- and Ly-, we used the dipole moments for H and H2 that Ramaker & Peek (1972) and Spielfiedel (2003) calculated as a function of internuclear distances.
The qualitative effects of the transition can be discerned in Fig. 2, which shows the radiative dipole transition moment and the difference potential energies as a function of . The transition dipole moment is small for most values of but shows a broad maximum at 4.5 Å, close to the broad minimum of the outer well in the potential difference. In contrast the dipole moment is small in the vicinity of the inner well in the potential difference. As a result, the main contribution from this transition is a CI satellite in the far wing centered at a frequency corresponding to the broad minimum (Allard and Kielkopf 1982).
The CI absorption depends strongly on the internuclear separation and produces a broad spectral feature with a characteristic width of the order of the inverse of the duration of the close collision.
The line satellite shown in Fig. 1 presents a shoulder at 1120 Å, a similar shape has been obtained for the 1600 Å satellite. In Fig. 6 of Allard et al. (1999) both theory and experiment show an oscillatory structure between the satellite and the line, with a minimum at about 1525 Å. These oscillations are an interference effect (Royer 1971; Sando & Wormhoudt 1973), and are expected to depend on the relative velocity of the collision and therefore on temperature. To conclude, we emphasize the importance of the accuracy of both the potential energies and the dipole moments for the line shape calculations and of a theory that takes into account the variation of the dipole moment during an atomic collision.
3 FUSE observation of G22629
G22629 (WD1647+591, DN Dra) is the brightest ZZ Ceti star. It was originally discovered to be variable by McGraw & Fontaine (1980) but the first detailed analysis of the light curve had been published by Kepler, Robinson, & Nather (1983). This is one of the best studied ZZ Ceti stars, for which Fontaine et al. (1992) proposed that pulsation properties could be interpreted assuming a “thick” hydrogen layer mass of . Subsequent observations by the Whole Earth Telescope consortium (Kepler et al. 1995) and by HST/FOS (Kepler et al. 2000) allowed unequivocal mode identification and supported Fontaine et al.’s (1992) contention that G22629 has a thick hydrogen layer. G22629 defines the blue (hot) edge of the instability strip according to optical determination of Bergeron et al. (1995).
G22629 was observed by FUSE as part of our Cycle 4 Guest Investigator Program D101. This ZZ Ceti star is the coolest white dwarf observed with this instrument so far. Two observations of four exposures each were obtained on 2003 March 11 and 12 in time-tagged photon address mode (TTAG) with the object in the 30”30” aperture (LWRS). The total duration was 29.1 ksec ( h). Details of the FUSE instrument may be found in Moos et al. (2000) and Sahnow et al. (2000).
The one-dimensional spectra were extracted from the two-dimensional detector images and calibrated using version 2.4.1 of the CalFUSE pipeline. The FUSE detector segments of the two observations were co-added and projected on a Å-pixel base, i.e. pixels about 100 times larger than the original FUSE detectors pixels. This degradation of the FUSE spectral resolution (typically for this kind of target in the large slit; see Hébrard et al. 2002b; Wood et al. 2002) is of no effect on the shapes of the large stellar features that we study and allows us to increase the signal-to-noise ratio. At this resolution, no spectral shifts were detected between the different co-added spectra.
The two shorter wavelength segments (SiC1B and SiC2A, Å Å) were not used as no significant stellar spectrum was detected on them. We also did not use the LiF1B segment in our final spectrum, which is known to present a large-scale distortion (the worm) in the flux calibration that spans the region of interest (see, e.g., Hébrard et al. 2002a). Thus, the range Å Å, in which the H2 satellite is detected (Sect. 4), comes from the LiF2A segment only. We checked that the H2 satellite is also detected on LiF1B, despite the alteration of the worm. This redundancy in the FUSE spectral coverage allow us to conclude that the feature around 1150 Å is real, and not the result of an instrumental artifact.
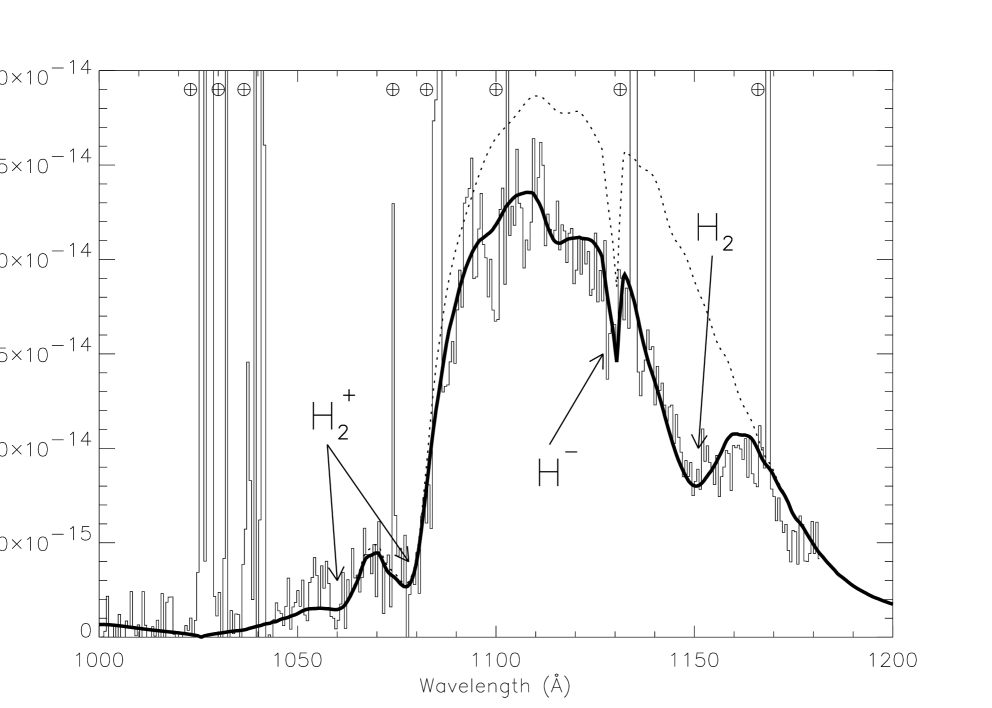
The final reduced spectrum is plotted in Fig. 3.
4 Synthetic spectra and comparison with the observation
We computed a small grid of LTE model atmospheres with pure hydrogen composition that explicitly include the Ly- and Ly- quasi-molecular opacities. These are determined for K, computed from absorption profiles that take into account a variable dipole, modulated by the Boltzmann factor (Allard et al. 1999). The atmosphere models have been calculated using the program TLUSTY (Hubeny 1988; Hubeny & Lanz 1992, 1995). The synthetic spectra were computed by using the spectral synthesis code SYNSPEC. The line satellites have a strong blanketing effect and have been included in both the atmosphere model and synthetic spectra calculations. Convection was treated within the usual framework of the mixing length approximation (MLT), where we used ML2/=0.6 (Bergeron et al. 1995).
Fig. 3 compares our best model to the FUSE spectrum of G22629. The observed feature at 1150 Å is well reproduced by the predicted H2 satellite, both in terms of shape and wavelength position. This is the first detection and identification of that feature. We also computed a model without including the H-H interactions to appreciate how these interactions affect the far wing of Ly-. Fig. 3 shows that this model (dotted line) neither produces the H2 1150 absorption feature nor the significant flux absorption down to 1085 Å. This illustrates that an accurate fit of the observed FUV spectra cannot be obtained without using the improved theoretical profile calculations including perturbations by both protons and neutral hydrogen presented by Allard et al. (2000).
As expected in that temperature range, the H satellite at 1076 Å is also detected in spite of the low flux level. The H satellite at 1058 Å is not clearly detected because of the too low signal-to-noise ratio. The H- absorption at 1130 Å (Wishart 1979) is detected; that H- feature was already detected in the FUSE spectrum of the cool DA white dwarf G 23140 (Hébrard et al. 2002a).
The best fit is obtained for K and . That temperature is slightly lower than the one that Bergeron et al. (1995) determined from optical observations ( K), and it is similar to the one reported by Koester & Holberg (2001), who fitted the HST/FOS data by adding the constraints of the V magnitude and the trigonometric parallax ( K). Our gravity, however, is significantly lower than those obtained in both studies ( ). The causes of this difference are not fully understood yet. We are now investigating these causes and hope to resolve the discrepancy between our value of the gravity and those of Bergeron et al. (1995) and Koester & Holberg (2001). This work is beyond the scope of the present paper and will be presented elsewhere. In any case, that does not jeopardize our detection and identification of the quasi-molecular lines reported in this paper.
The model plotted in Fig. 3 was normalized by a free parameter in order to fit the FUSE spectrum. With that normalization, our model fits as well the shape of the IUE data of G22629, at longer wavelengths ( Å Å). However, we should point out that we need to divide the IUE flux by a factor of to bring it to the model. Small uncertainties in the background subtraction or misalignment of the target on the slit during the FUSE and IUE observations or both, could account for the flux discrepancy. It is worth mentioning that Hébrard et al. (2002a) fitted the FUSE and IUE data of the cool DA white dwarf G23140 without applying any correction factors to the fluxes. Given that the flux of G23140 is more than 20 times higher than the flux of G22629, systematic uncertainties in the background subtraction are significantly reduced. It is also easier to quantify the alignment of the target on the slit as a function of time and maintain a reasonable photometric accuracy for a relatively bright target such as G23140. We considered that a difference by a factor in the flux calibration of observations performed with 2 different instruments of a faint target is acceptable. Our model with K and fits as well the UV spectra ( Å Å) obtained with HST/FOS and presented by Kepler et al. (2000). We note that this HST/FOS spectrum was normalized in order to fit the IUE spectra.
5 Conclusions
We have presented the first far-UV spectrum of a ZZ Ceti star, namely G22629, performed with FUSE. We fitted these data using theoretical calculations of stellar profiles that include perturbations by both neutral hydrogen and protons. The observed spectrum is well fitted, allowing us to reproduce the global shape of the stellar continuum, together with the H- absorption at 1130 Å, the H quasi-molecular satellite 1076 Å (and marginally the one at 1058 Å), and a broad H2 CI satellite at 1150 Å. This is the first detection and identification of that H2 quasi-molecular satellite of Ly-. This feature has been predicted but never observed up to now. The quality of the fit allows that absorption feature to be unambiguously identified.
This discovery confirms our theoretical prediction and gives confidence concerning the accuracy of the fundamental molecular data we used. In combination with existing optical and ultraviolet data, fits using such models will be used in the future to allow stellar parameters (temperature, gravity) to be constrained more accurately, and will provide insights crucial in the modeling of cool white dwarf atmospheres.
References
- (1) Allard, N. F., & Kielkopf, J. F. 1982, Rev. Modern Phys., 54, 1103
- (2) Allard, N. F., Koester, D., Feautrier, N., & Spielfiedel, A. 1994, A&AS, 108, 417
- (3) Allard, N. F., Royer, A., Kielkopf, J. F., & Feautrier, N. 1999, Phys. Rev. A, 60, 1021
- (4) Allard, N. F., Kielkopf, J. F., Drira, I., & Schmelcher, P. 2000, Eur. Phys. J. D, 12, 263
- (5) Baranger, M. 1958a, Phys. Rev., 111, 481
- (6) Baranger, M. 1958b, Phys. Rev., 111, 494
- (7) Barstow, M. A., Good, S. A., Burleigh, M. R., Hubeny, I., Holberg, J. B., & Levan, A. J. 2003, MNRAS, 344, 562
- (8) Bergeron, P., Wesemael, F., & Fontaine, G. 1992, ApJ, 387, 288
- (9) Bergeron, P., Wesemael, F., Lamontagne, R., Fontaine, G., Saffer, R., & Allard, N. F. 1995, ApJ, 449, 258
- (10) Detmer, T., Schmelcher, P., Cederbaum, L. S. 1998, J. Chem. Phys., 109, 9694
- (11) Dupuis, J., Chayer, P., Vennes, S., Allard, N. F., & Hébrard, G. 2003, ApJ, 598, 486
- (12) Feldman, P. D., Sahnow, D. J., Kruk, J. W., Murphy, E. M., & Moos, H. W. 2001, J. Geophys. Res., 106, 8119
- (13) Finley, D. S., Koester, D., Kruk, J., Kimble, R. A., & Allard, N. F. 1997, in White Dwarfs: Proc. 10th European Workshop on White Dwarfs, ed. J. Isern, M. Hernanz, & E. Garcia-Berro (Dordrecht: Kluwer), 245
- (14) Fontaine, G., et al. 1992, ApJ, 399, L91
- (15) Fontaine, G., Brassard, P., & Charpinet, S. 2003, Ap&SS, 284, 257
- (16) Greenstein, J. L. 1980, ApJ, 241, L89
- (17) Hébrard, G., Allard, N., Hubeny, I, Lacour, S., Ferlet, R., & Vidal-Madjar, A. 2002a, A&A, 394, 647
- (18) Hébrard, G., et al. 2002b, ApJS, 140, 103
- (19) Hébrard, G., Allard, N. F., Kielkopf, J. F., Chayer, P., Dupuis, J., Kruk, J. W., & Hubeny, I. 2003, A&A, 405, 1153
- (20) Holm, A. V., et al. 1985, ApJ, 289, 774
- (21) Hubeny, I. 1988, Comp. Phys. Comm., 52, 103
- (22) Hubeny, I., & Lanz, T. 1992, A&A, 262, 501
- (23) Hubeny, I., & Lanz, T. 1995, ApJ, 439, 875
- (24) Kepler, S. O., Robinson, E. L., & Nather, R. E. 1983, ApJ, 271, 544
- (25) Kepler, S. O., et al. 1995, ApJ, 447, 874
- (26) Kepler, S. O., et al. 2000, ApJ, 539, 379
- (27) Koester, D., Weidemann, V., Zeidler-K.T., E.-M., & Vauclair, G. 1985, A&A, 142, L5
- (28) Koester, D., Finley, D. S., Allard, N. F., Kruk, J. W., & Kimble, R. A. 1996, ApJ, 463, L93
- (29) Koester, D., Sperhake, U., Allard, N. F., Finley, D. S., & Jordan, S. 1998, A&A, 336, 276
- (30) Koester, D., & Holberg J. B. 2001, in ASP Conf. Ser. 226, 12th European Workshop on White Dwarfs, ed. J. L. Provencal, H. L. Shipman, J. MacDonald, & S. Goodchild (San Francisco:ASP), 299
- (31) Madsen, M. M., Peek, J. M. 1971, Atomic Data, 2, 171
- (32) McGraw, J. T., & Fontaine, G. 1980, unpublished
- (33) Moos, H. W., et al. 2000, ApJ, 538, L1
- (34) Nelan, E. P., & Wegner, G. 1985, ApJ, 289, L31
- (35) Royer, A. 1971, Phys. Rev. A, 43, 499
- (36) Royer, A. 1974, Can. J. Phys., 52, 1816
- (37) Royer, A. 1980, Phys. Rev. A, 22, 1625
- (38) Ramaker, D. E., & Peek, J. M. 1972, J. Phys. B, 5, 2175
- (39) Sahnow, D. J., et al. 2000, ApJ, 538, L7
- (40) Sando, K. M., & Wormhoudt, J. G. 1973, Phys. Rev. A, 7, 1889
- (41) Schmelcher, P. 2000, Private communication
- (42) Spielfiedel, A. 2003, J. Mol. Spectrosc., 217, 162
- (43) Vidal, C. R., Cooper, J.,& Smith, E. W. 1973, ApJS, 25, 37
- (44) Wishart, A. W. 1979, MNRAS 187, 59
- (45) Wolff, B., et al. 2001, A&A, 373, 674
- (46) Wood, B. E., et al. 2002, ApJS, 140, 91