2Institut d’Astrophysique de Paris, 98 bis Bld Arago, 75 014 Paris, France
3LERMA, Observatoire de Paris, 61 avenue de l’Observatoire, 75 014 Paris, France
4Institute of Astronomy, Madingley Road, Cambridge CB3 0HA, UK
C IV Absorbers in Quasars:
Tracing Early Galactic Halos Evolution
We use 29 quasar spectra to build a homogeneous sample of high-redshift C IV absorbers. We use these data to calculate the number density, , of Å C IV doublets. We find that increases with time from . In addition, Å C IV systems are more numerous than the former at all redshifts. On the contrary, of Å Mg II doublets decreases with time, in agreement with results from studies of LLS number densities. Below , none of all the classes of absorbers show signs of evolution. We interpret this as the formation of galactic envelopes from smaller halos. Furthermore, the doublet ratio DR=/ is found to decrease with time, a signature of the increase of the mean C IV column density. Finally, the (Si IV1393)/(C IV1548) ratios in strong absorbers ( Å) is found to be approximately constant from to and then to decrease with time. This result suggests that the highest column density absorbers are not sensitive to changes in the ionization continuum.
Key Words.:
Cosmology: observations – Galaxies: evolution – Quasars: absorption lines – Galaxies: halos – Galaxies: high-redshift1 Introduction
Various lines of evidence point towards a direct connection between metal-line absorption systems observed in the spectra of high redshift background quasars and normal galaxies. Mg II systems are known to be associated with the gaseous envelopes of bright galaxies which have been detected in emission at (Bergeron & Boissé 1991). The typical impact parameter from the galaxy varies with the equivalent width threshold of the surveys for absorbers: 40 h-1 kpc at Å and 60 h-1 kpc at Å (Churchill et al. 1999). In addition the absorbers optically thick to hydrogen ionizing radiation, i.e. neutral hydrogen absorbers with N(HI) cm-2, the Lyman limit systems (hereafter LLS) have sizes comparable to the Å Mg II selected systems. Therefore both Mg II and LLS are believed to arise from the same type of object.
At , C IV absorbers arise from the extended (100 h-1 kpc) halos of galaxies of a wide range of luminosity and morphological type (Chen, Lanzetta & Webb 2001). More specifically, Adelberger et al. (2003) have shown that at , all C IV absorbers are situated within 200 h-1 kpc of a Lyman-break galaxy and argue that this distance is characteristic of a galactic-scale outflow driven by star formation activity in this type of galaxy. Moreover, simulations have shown that the observed C IV kinematic structure and column densities can be well reproduced by merging of proto-galactic clumps (Haehnelt, Steinmetz & Rauch 1996). Compact halos of hot gas with temperature close to K satisfactorily explain the observed multi-component nature of the C IV absorbers. These absorption systems thus provide a powerful observational tool to understand the processes of galaxy formation and evolution that deposit chemically enriched material far from the central galaxy.
The methods used to study the properties of C IV systems can be split into two different approaches. First, observing C IV in high signal-to-noise ratio, high-resolution spectra, allows us to determine their column density down to log N(C IV) cm-2. This enables detailed kinematic and temperature studies (Rauch et al. 1996) which show that C IV components may be the building blocks of future normal galaxies. Such data are also used to determine the low end of the C IV column density distribution (Ellison et al. 2000) and mass density (Songaila 2001; Pettini et al. 2003; Boksenberg, Sargent & Rauch 2003) and to study the velocity structure within the halos (e.g. Petitjean & Bergeron 1994 and Crotts, Burles & Tytler 1997). Nevertheless, such analysis are currently limited to a few lines of sight.
The second approach consists in studying a statistically significant number of absorbers by constructing a large homogeneous sample. Steidel (1990) uses quasar spectra at in addition to data at from Sargent, Boksenberg & Steidel (1988) to build such a homogeneous sample. They find that the number density of C IV systems, , increases with increasing redshift in the range and deduce from this that the properties of the absorbers are evolving with time. Using a two-point correlation function to study the clustering of the C IV doublets, they find marginal evidence that the width of the correlation peak on small velocity scales is smaller at high redshift than in the local Universe. Quashnock, Vanden Berk & York (1996) show that clustering is also present at higher redshift, although its scale does not appear to have changed significantly since then. More recently, Misawa et al. (2002) have used higher-resolution spectra (2 Å FWHM) from the Keck telescope to conduct a systematic search for C IV doublets. They measure up and find that their results agree with Steidel (1990) at a rest equivalent width limit of Å, but not at Å. We propose here that this discrepancy is actually due to incompleteness in the Steidel sample at Å linked with the lower resolution of the survey and pay particular attention to this point in our analysis.
Although both these approaches are complementary, the paucity of strong C IV systems means that the second technique is more appropriate to study the characteristics and evolution of the galactic halos. In the present study, we use 29 quasar spectra to build a new and homogeneous sample of high-redshift C IV absorbers. In section 2, we summarise the set-up for the observations and detail the data reduction process in section 3. The method for the identification of the absorbers is presented in section 4 together with a list of C IV systems. The statistical properties of this sample are derived in section 5 and discussed in section 6. This paper assumes and throughout.
| Quasar | APM | Telescope | Date | Exp. Time | Spectral | |
|---|---|---|---|---|---|---|
| Name | R Mag | (sec) | Coverage | |||
| BR J00066208 | 4.455 | 18.3 | NTT | 2002 Aug | 9000 | 70088512 |
| BR J00305129 | 4.174 | 18.6 | NTT | 2002 Aug | 7500 | 65088016 |
| PSS J00341639 | 4.293 | 18.0 | NTT | 2002 Aug | 6000 | 66118117 |
| PSS J01330400 | 4.154 | 18.3 | NTT | 2002 Aug | 9000 | 63657860 |
| PSS J02481802 | 4.422 | 17.7 | WHT | 2001 Nov | 3300 | 66317442 |
| BR J03111722 | 4.039 | 17.7 | NTT | 2001 Dec | 3600 | 65007820 |
| BR J03242918 | 4.622 | 18.7 | NTT | 2001 Dec | 10800 | 71508470 |
| BR J03341612 | 4.363 | 17.9 | WHT | 2001 Nov | 1800 | 66317442 |
| BR J03553811 | 4.545 | 17.9 | NTT | 2001 Dec | 3600 | 71508470 |
| BR J04195716 | 4.461 | 17.8 | NTT | 2001 Dec | 5400 | 71508470 |
| BR J04262202 | 4.320 | 17.9 | NTT | 2001 Dec | 6000 | 69308250 |
| PMN J05253343 | 4.383 | 18.4 | NTT | 2001 Dec | 9000 | 69308250 |
| BR J05293552 | 4.172 | 18.3 | NTT | 2001 Dec | 9000 | 65007820 |
| BR J07146455 | 4.462 | 18.3 | NTT | 2001 Dec | 9000 | 71508470 |
| PSS J07474434 | 4.430 | 18.4 | WHT | 2001 Nov | 1200 | 66317442 |
| PSS J11591337 | 4.073 | 17.1 | WHT | 2002 Jun | 4500 | 60007400 |
| PSS J12530228 | 4.007 | 18.8 | WHT | 2002 Jun | 6300 | 60007400 |
| PSS J13302522 | 3.949 | 18.5 | WHT | 2002 Jun | 5400 | 60007400 |
| BR J14562007 | 4.249 | 18.2 | WHT | 2002 Jun | 7200 | 68508350 |
| BR J16184125 | 4.213 | 18.5 | WHT | 2002 Jun | 7200 | 68508350 |
| PSS J16331411 | 4.351 | 18.7 | NTT | 2002 Aug | 10800 | 70088512 |
| PSS J16465514 | 4.037 | 17.1 | WHT | 2002 Jun | 4500 | 68508350 |
| PSS J17232243∗ | 4.520 | 18.2 | NTT | 2002 Aug | 3600 | 70088512 |
| PSS J18025616 | 4.158 | 18.3 | WHT | 2002 Jun | 6300 | 68508350 |
| PSS J21540335 | 4.363 | 19.0 | NTT | 2002 Aug | 10800 | 66158117 |
| PSS J21551358 | 4.256 | 18.0 | WHT | 2002 Jun | 6300 | 68508350 |
| BR J22166714 | 4.469 | 18.6 | NTT | 2002 Aug | 10200 | 70088512 |
| PSS J23440342 | 4.239 | 18.2 | NTT | 2002 Aug | 9600 | 65108010 |
| BR J23493712 | 4.208 | 18.7 | NTT | 2002 Aug | 10200 | 65108010 |
∗Object possibly affected by BAL features.
2 Observations
All the quasars observed in the present study were selected from the lower-resolution survey of Péroux et al. (2001). The new observations were carried out during two observing runs at the 4.2 m William Herschel telescope (WHT) of the Isaac Newton Group of telescopes in the Canary Islands and two observing runs at the 3.58 m New Technology Telescope (NTT) of the European Southern Observatory in La Silla, Chile. High signal-to-noise optical spectrophotometry was obtained covering approximately 7000 Å to 8000 Å, the exact range depending on which instrument was used for the observations. A journal of the observations is presented in Table 1.
Eleven quasars were observed at the WHT during 2001 November 7 – 8 and 2002 June 1 – 2. The first run suffered bad weather conditions, thus limiting the number of objects observed and the quality of the resulting spectra. The integration times ranged from 1200 – 7200 seconds. We used only the red arm of the ISIS spectrograph. A new CCD was installed before the second run took place and therefore the characteristics of the set-ups slightly changed between the two observational sessions. For the November run a thinned coated Tektronix CCD was used, while a thinned coated EEV CCD was used for the June run. Grating R600R was used leading to a dispersion of 0.79 Å pixel-1 for the November run and 0.44 Å pixel-1 for the June run. In all cases, a GG495 blocking filter was used to minimize the second order contamination. All the observations were taken with a slit width of 1.0 – 1.5 arcsec. Blind-offsetting from bright – magnitude stellar fiducials was used to position the quasars in the slit, partly to save acquisition time and partly because the majority of the quasars were not visible using the blue sensitive TV acquisition system. Readout time was reduced by windowing the CCDs in the spatial direction.
Eighteen quasars (including the possibly BAL quasar PSS J17232243) were observed at the NTT during 2001 December 16 – 18 and 2002 August 11 – 13 using the ESO Multi-Mode Instrument (EMMI). The exposure times ranged from 3600 to 10800 seconds. Again, a new CCD was installed before the second run took place and therefore the characteristics of the set-ups slightly changed between the two observational sessions. For the December run a thin, back-illuminated Tektronix CCD was used, while a MIT/LL CCD was used for the August run. Grating #7 used on both occassions and gave dispersions of 0.66 Å pixel-1 for the December run and 0.82 Å pixel-1 for the August run. In both cases a OG530#645 blocking filter was used to minimize the second order contamination. All the observations were taken with a slit width of 1.0 arcsec. Readout time was again reduced by windowing the CCDs in the spatial direction.
3 Data Reduction
The data reduction was undertaken using the IRAF 111IRAF is distributed by the National Optical Astronomy Observatories, which are operated by the Association of Universities for Research in Astronomy, Inc., under cooperative agreement with the National Science Foundation. software package. Because the bias frames for each nights were so similar, a master ‘zero’ frame for each run was created using the IMCOMBINE routine. The data were overscan-corrected, zero-corrected, and trimmed using CCDPROC. Similarly, a single flat-field frame was produced by taking the median of the (suitably scaled) flats. The overall background variation across this frame was removed to produce an image to correct for the pixel-to-pixel sensitivity variation of the data. The task APALL was used to extract 1-D multi-spectra from the 2-D frames. The routine estimates the sky level by model fitting over specified regions on either side of the spectrum. In the cases where the objects were faint on the 2-D frames, different exposures were IMCOMBINEd before extraction with APALL.
The WHT data were wavelength calibrated using CuAr and CuNe arcs and the NTT data using HeAr and Ar lamps. Night sky lines were used to monitor the wavelength calibration for all spectra. In all but one run, observations of B-stars free of strong features in the red were taken in order to remove the effects of atmospheric absorption (e.g. O2 A band at 7600 Å) in the quasar spectra. No such observations were made in the December run at NTT, and therefore in this case appropriately scaled B-star spectra were used for atmospheric correction. The atmospheric absorption features seen in the B-star spectrum were isolated by interpolating between values on either side of the feature. The original B-star spectrum was then divided by this atmospheric-free spectrum to create an atmospheric correction spectrum. Finally the object spectra were divided by the scaled correction spectrum.
The resolution of the resulting spectra ranges from 1.60 to 2.30Å. An estimate of the continuum signal-to-noise ratio is given in Table 3 for each object. The spectra are shown in Figure 1 with arbitrary flux scales. The quasar redshifts and magnitudes listed in Table 1 are from the original survey of Péroux et al. (2001). All the spectra were then continuum normalised within the MIDAS data reduction software package (Fontana & Ballester 1995) in order to detect the signature of intervening absorption lines. For this purpose a spline function was fitted to the quasar continuum to smoothly connect the regions free from absorption features, as is standard practice.


4 Metal Identification

4.1 Methodology
To select metal lines we use a detection algorithm based on the method presented in Péroux et al. (2001), supplemented by a visual search. Following past work, the spectra are analysed from 5000 km s-1 blueward of the C IV emission line (to avoid lines possibly associated with the quasar) towards shorter wavelengths. The analysis is stopped when the signal-to-noise ratio becomes too low to detect a C IV line at the 5 level (corresponding to in Table 3). We then calculate the equivalent widths of all the candidate lines. Figure 2 shows an example (for PSS J11591337) of the output of the algorithm we use to detect metal lines - a box-like running average of the equivalent width as a function of wavelength. In this figure, our detection threshold is represented by the straight dashed line: any feature peaking above this limit is a candidate absorber. This output is then visually inspected to detect any lines which might have been missed by the automatic procedure. The lines are then identified by analysing each spectrum in velocity space and the redshift of the system is measured that best fits each line of a doublet and other associated lines. All detected absorptions with confirmed identifications are listed in Table 4 of the appendix for each quasar spectrum.
4.2 Notes on Individual Spectra
-
1.
BR J00066208 ()
– Weak absorption but the wavelength alignment and EW ratio are in excellent agreement with expectations from Mg II absorbers.
– Symmetric profiles associated with a saturated Mg II doublet. Mg I 2852 and many associate Fe II lines (2374, 2382, 2586, 2600) are observed. Possible Fe I 2719 and Si I 2515 are also found at the same redshift.
– Unambiguous two-component C IV doublet with possible associate C I 1560.
-
2.
BR J00305129 ()
– Narrow, well-defined C IV doublet.
-
3.
PSS J00341639 ()
– The two members of this Mg II doublet are not exactly aligned, but EW ratio means that this is a definite identification.
– The 2796 line of this Mg II doublet is saturated. Associated strong Fe II 2382, 2586 and 2600 lines are observed.
– The 2803 line of this Mg II doublet is slightly contaminated on its red side by C IV 1548 at .
– Although the EW ratio is not precisely the one expected from C IV doublets, the wavelength alignment and similarity in profiles mean that this is most probably a C IV absorption. C I 1560 coincides exactly with the C IV 1548 at .
– Clean and unambiguous C IV doublet with associated Si II 1526.
– At red end of the spectrum, another C IV doublet is clearly detected. C I 1328 coincides exactly with the C IV 1550 at and Si II 1304 is detected.
-
4.
PSS J01330400 ()
This spectrum is particularly rich in Si IV doublets.
– Saturated Mg II doublet with associated Mg I 2852 absorption line. Fe II 2586 and 2600 are also observed at this redshift.
– Although contamination between the two lines of this C IV doublet means that the EW ratio is slightly off the expected value, this is most probably a C IV system.
– Small, well-defined C IV doublet.
– This Si IV doublet might have associated C IV absorption, but given the sky contamination at the relevant wavelengths (around 7150 Å), this cannot be confirmed.
– This C IV doublet is characterised by an asymmetric profile which is also seen in Si IV. A strong C II 1334 is observed at the blue end of the spectrum and additional Si II 1526 and Fe II 1608 are detected at the same redshift. Péroux et al. (2001) also report a DLA at this redshift.
– C IV system with associated a Si IV doublet.
– Situated only 300 km s-1 away from the previous system, this C IV doublet has associated with O I 1302 and Si II 1304 absorptions.
– Narrow Si IV doublet with a possible C I 1280 line associated and a definite Si II 1304 feature (C I 1280 is blended with C IV 1548 at ).
– Situated only 300 km s-1 away from the previous system, this is another narrow Si IV doublet with associated Si II 1526.
-
5.
PSS J02481802 ()
– Although Mg II 2796 is contaminated on its red wing, this is most probably a Mg II doublet.
– Si IV doublet with Si IV 1393 blended with Mg II 2803 at .
– Another medium-strength Si IV doublet.
-
6.
BR J03111722 ()
– This definite C IV doublet has an asymmetric profile. O I 1302 is possibly detected at the same redshift.
-
7.
BR J03242918 ()
– Weak Mg II doublet.
– Many Fe II lines (2344, 2382, 2586 and 2600) are detected at this redshift, but our spectrum does not cover the appropriate wavelength range for the detection of the Mg II doublet.
– Weak C IV doublet.
-
8.
BR J03341612 ()
– Narrow C IV doublet.
– Another narrow C IV doublet.
– A Si IV doublet is detected at this wavelength.
– Another Si IV doublet is detected, with the Si IV 1393 line blended with C IV 1548 at .
-
9.
BR J03553811 ()
– This saturated Mg II doublet shows clear evidences of a two-component profile. Associated Fe II 2586 and 2600 lines are observed.
– Unusually broad and weak C IV doublet.
– Weak C IV doublet.
– Situated 300 km s-1 away from the previous system, another weak C IV system.
-
10.
BR J04195716 ()
– Many Fe II lines (2382, 2586 and 2600) are detected at this redshift, but our spectrum does not cover the appropriate wavelength range for the detection of the Mg II doublet.
– The C IV 1550 line of this doublet is probably contaminated by another absorption, which explains the differences in the profile shape of this C IV doublet.
– Unambiguous C IV doublet.
– Weak C IV doublet where the C IV 1548 line is blended with a stronger unidentified absorption.
-
11.
BR J04262202 ()
– This C IV doublet shows a characteristic two-component profile.
– Weak C IV doublet.
– Nicely defined C IV doublet with associated Si IV absorption.
-
12.
PMN J05253343 ()
– Well defined Mg II doublet.
– Weak C IV doublet with associated Fe II 1608 absorption.
– Weak C IV doublet with associated Si IV doublet (the Si IV 1402 is blended with C IV 1548 at ), Si II 1526 and Fe II 1608.
– Slightly broad C IV doublet.
– Si IV doublet.
-
13.
BR J05293552 ()
– Fairly weak Mg II doublet.
– The profile of this Mg II doublet is characterised by a square shape.
– Another Mg II doublet is observed at this redshift.
– Well defined C IV doublet with associate Fe II 1608 and Al II 1670 absorption lines.
– This Si IV doublet is accompanied with Si II 1304 & 1526 and C II 1304.
-
14.
BR J07146455 ()
– This C IV doublet is associated with a Si II 1526 line.
– Another well defined C IV doublet is detected at this redshift.
– Both C IV and Si IV doublets are observed, but Si IV 1402 is blended with Si II 1526 at .
-
15.
PSS J07474434 ()
This spectrum is of very low quality and no lines could be identified.
-
16.
PSS J11591337 ()
– Many Fe II lines (2344, 2374, 2382, 2586 and 2600) are detected at this redshift, but our spectrum does not cover the appropriate wavelength range for the detection of the Mg II doublet.
– C IV and Si IV doublets are detected at this redshift (the Si IV line is blended with Si IV 1393 at 3.756). Péroux et al. (2001) also report a DLA at this redshift.
– Another Si IV doublet is observed.
-
17.
PSS J12530228 ()
– A strong Mg II doublet is detected at this redshift.
– This C IV doublet also shows strong Si IV doublet and C II 1334 line with the same characteristic two component profile. Péroux et al. (2001) also report a sub-DLA (see Péroux et al. 2003 for a definition of this class of systems) at this redshift.
-
18.
PSS J13302522 ()
– Associated with this C IV doublet is Al II 1670. Péroux et al. (2001) also report a sub-DLA (see Péroux et al. 2003) at this redshift.
– Another C IV doublet is observed at this redshift.
– A weak Si IV doubled is detected.
– At the red end of the spectrum, another C IV doublet is detected.
-
19.
BR J14562007 ()
– Narrow Mg II doublet.
– The C IV 1550 line of this C IV doublet is slightly contaminated.
-
20.
BR J16184125 ()
– This Si IV system is the only doublet which can be convincely identified.
-
21.
PSS J16331411 ()
– Nice C IV doublet
– A Si IV doublet is identified at this redshift.
– This C IV doublet has a characteristic profile which includes a smaller component to the blue of the main feature.
-
22.
PSS J16465514 ()
This spectrum is particularly rich in C IV systems which are visible as clustered pairs of doublets.
– Well defined Mg II doublet where the EW ratio is in excellent agreement with expectations from physical properties.
– A weak C IV doublet is detected at this redshift.
– This medium strength C IV system has its C IV 1548 line blended with the C IV 1550 line at .
– In the close vicinity of the previous system is another stronger C IV doublet.
– This C IV doublet has its lines separated by the C IV 1548 line at .
– This weaker C IV doublet is crossing the previous doublet but can nevertheless be fairly well isolated for EW measurements.
– Similarly to the two doublets described above, this C IV system is crossed over by the C IV absorber, although the closer proximity between the two means that the EW are not as reliable. The Si IV doublet, Si II 1526 and Fe II 1608 are also detected at this redshift.
– Weaker C IV absorber as described above.
-
23.
PSS J17232243 ()
– Characteristic two-component Si II 1526, Fe II 1608 and Al II 1670 are detected at this redshift. The shape of features means that the identification is unambiguous. Nevertheless the corresponding C IV doublet is not convincing due to an odd EW ratio.
– Well defined and strong C IV doublet.
– This C IV doublet is blended in its C IV 1550 line with the C IV 1548 at .
– The C IV system identified at this redshift is clustered with the doublet described previously. The consequences of this arrangement is that the EW measurements are less reliable. Si IV is nevertheless observed at this redshift.
-
24.
PSS J18025616 ()
– A Si IV doublet is identified at this redshift.
– A weak C IV doublet is detected at this redshift. The C IV 1548 line is probably contaminated to some extend.
-
25.
PSS J21540335 ()
– This saturated Mg II absorber is associated with a Mg I 2852 absorption. Fe II 2586 and 2600 are also detected at this redshift.
– The good alignment and EW ratio means that this a definite C IV doublet. Nevertheless, the C IV 1550 line is clearly contaminated in its blue wing by some unidentified absorption which means that the EW measurement of this line is not reliable. Péroux et al. (2001) also report a sub-DLA (see Péroux et al. 2003) at this redshift.
– Very well defined C IV doublet is observed at this redshift. The associated Si IV doublet is also detected.
-
26.
PSS J21551358 ()
– The characteristic two-component saturated profile is unambiguously associated with a Mg II doublet. Fe II (2382, 2586 and 2600) lines are also detected at this redshift.
– Although the EW ratio of this doublet is not in excellent agreement with expectations from C IV physical properties, we identify this system as a C IV absorber.
– This C IV doublet is saturated which means that the EW ratio is not reliable. The identification is nevertheless reliable. A strong Si IV doublet is also detected at this redshift.
-
27.
BR J22166714 ()
– Many Fe II lines (2344, 2374, 2382, 2586 and 2600) are detected at this redshift, but our spectrum does not cover the appropriate wavelength range for the detection of the Mg II doublet.
– Although the profiles are quite different for the two lines of this C IV doublet, the identification is secure due to a good alignment in velocity space and an EW ratio that conforms to expectations from the physical properties of these systems.
– Another C IV doublet is observed at this wavelength.
– A weak C IV system is present at this redshift.
-
28.
PSS J23440342 ()
– This C IV doublet is probably saturated which would explain the unexpected EW ratio. Fe II 1608 and Al II 1670 are also detected at this redshift. Péroux et al. (2001) also report a DLA at this redshift.
– There is a weak C IV doublet at this redshift and associated Si II 13094 and 1526 absorption lines.
– Both C IV and Si IV are clearly observed at this redshift.
-
29.
BR J23493712 ()
– Although the Mg II 2803 line of this doublet is slightly contaminated, this system is most probably a weak Mg II absorber.
– A C IV doublet is clearly identified at this redshift.
– A weak C IV system is detected at this redshift. Fe II 1608, Al II 1670 and Si II 1526 are also observed at the same redshift.
– Yet another C IV doublet is detected at this redshift. The Si IV doublet and Al II 1670 are also detected at this redshift. The Si IV 1393 line is blended with Si II 1526 at . Péroux et al. (2001) also report a sub-DLA (see Péroux et al. 2003) at this redshift.
– A weak C IV absorber is found at this redshift, although the profiles of both lines are not totally identical.
– A nice C IV system is detected. It is characterised by a two-component profile.
| Absorber | all | |||
|---|---|---|---|---|
| C IV | 64 | 41 | 19 | … |
| Mg II | 19 | 14 | 11 | 7 |
| Si IV | 28 | 14 | 3 | … |
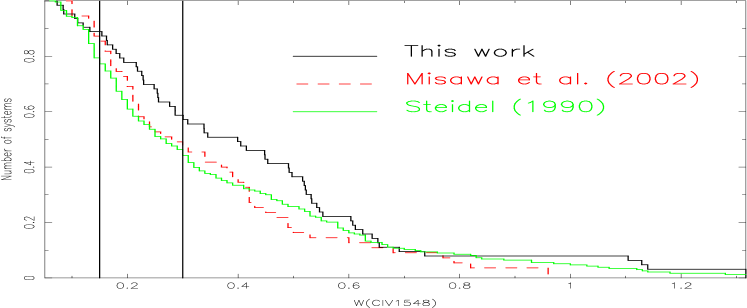
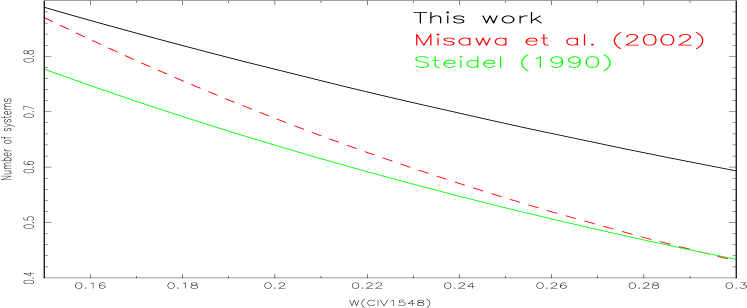
The whole sample is composed of 64 C IV 19 Mg II and 28 Si IV doublets. For comparison Steidel (1990) use 11 spectra at in addition to the 55 spectra at from Sargent, Boksenberg & Steidel (1988) and finds a total of 275 C IV. Steidel & Sargent (1992) find 111 Mg II absorbers in 103 quasar spectra. Songaila (2001) has looked for C IVand Si IV doublets in the spectra of 32 quasars with down to . She finds a total of 139 C IV lines and 49 Si IV lines at , with 122 and 39, respectively for , roughly the redshift limits of this survey. More recently, Misawa et al. (2002) find 55 C IV doublets, 19 Si IV and only 3 Mg II in the spectra of 18 quasars. The C IV samples of each of these surveys are plotted in Figure 3 as a function of the C IV 1548 rest frame equivalent widths, . The change of slope of the Misawa et al. distribution at Å conforms to theoretical expectations of the evolution of quasar absorbers (Churchill & Vogt 2001). On the other hand, the fact that the other samples do not show such strong evolution indicates that they are not complete below Å. Indeed, the study of Misawa et al. (2002) is based on higher-resolution data, and therefore their sample is more complete than the previous work of Steidel (1990) explaining while results from the two surveys differ. Since our sample suffers the same problem of incompleteness as Steidel (1990), we choose to limit our analysis to doublets with Å. For a Doppler parameter , this corresponds to N(C IV) (Steidel et al., 1990). For reference, Table 2 summarises the number of absorbers in various sub-samples. Interestingly, we find proportionally more Mg II doublets than Misawa et al. (2002) but less Si IV systems, and therefore do not consider the latter absorber in our statistical analysis. We find four Å C IV absorber in our sample which demonstrates that such systems exist at .
5 Statistical Properties
5.1 Number Density
| Quasar | S/N | ||
|---|---|---|---|
| BR J00066208 | 2030 | 3.531 | 4.446 |
| BR J00305129 | 1020 | 3.208 | 4.165 |
| PSS J00341639 | 1525 | 3.274 | 4.243 |
| PSS J01330400 | 3040 | 3.115 | 4.077 |
| PSS J02481802 | 1020 | 3.287 | 3.807∗ |
| BR J03111722 | 1020 | 3.206 | 4.031 |
| BR J03242918 | 2030 | 3.621 | 4.471 |
| BR J03341612 | 1020 | 3.287 | 3.416∗ |
| 3.423 | 3.802∗ | ||
| BR J03553811 | 2030 | 3.621 | 4.471 |
| BR J04195716 | 1020 | 3.621 | 4.452 |
| BR J04262202 | 1020 | 3.479 | 4.311 |
| PMN J05253343 | 1020 | 3.479 | 4.329 |
| BR J05293552 | 2030 | 3.201 | 4.051 |
| BR J07146455 | 2030 | 3.621 | 4.453 |
| PSS J07474434 | 510 | 3.287 | 3.807∗ |
| PSS J11591337 | 4050 | 2.788 | 3.889 |
| PSS J12530228 | 1525 | 2.811 | 3.857 |
| PSS J13302522 | 1020 | 2.807 | 3.887 |
| BR J14562007 | 510 | 3.366 | 4.240∗ |
| BR J16184125 | 1020 | 3.352 | 4.204 |
| PSS J16331411 | 2030 | 3.531 | 4.342 |
| PSS J16465514 | 2030 | 3.343 | 4.029 |
| PSS J17232243 | 1525 | 3.530 | 4.158 |
| 4.166 | 4.498 | ||
| PSS J18025616 | 515 | 3.351 | 4.149∗ |
| PSS J21540335 | 2030 | 3.276 | 4.243 |
| PSS J21551358 | 2030 | 3.368 | 4.247 |
| BR J22166714 | 2030 | 3.531 | 4.460 |
| PSS J23440342 | 2030 | 3.209 | 4.174 |
| BR J23493712 | 2030 | 3.209 | 4.174 |
| dz(total) | 24.98 | ||
| dz(Å) | 21.76 |
∗ This object was not included into the final Å redshift path.
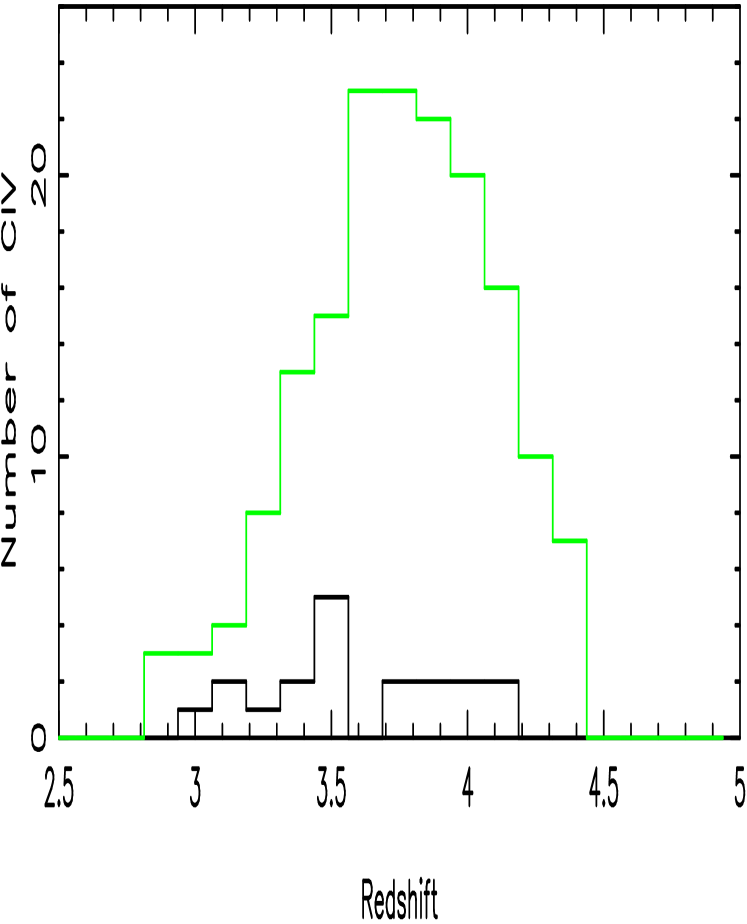
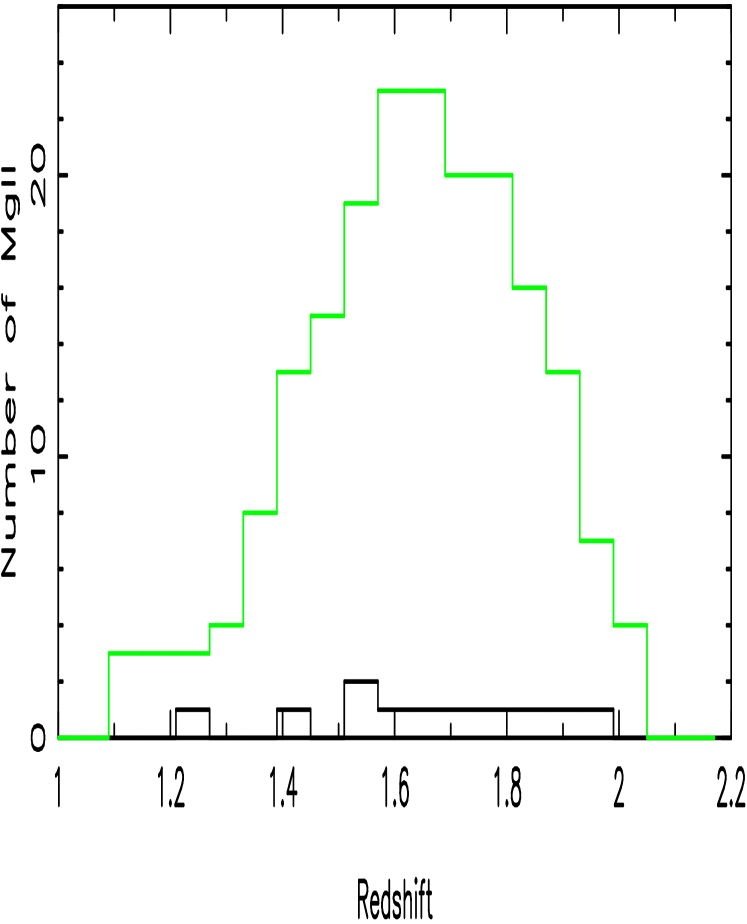
In order to calculate the number density, , of absorbers, one needs to measure the redshift path surveyed by the quasar sample. For each quasar spectrum, we compute the theoretical signal-to-noise (S/N) necessary to recover an absorber with Å at 5. After measuring the S/N in each observed spectrum, we reject 5 lines of sight: PSS J02481722, BR J03341612 and PSS J07474434, all observed at WHT in November 2001 when the weather conditions were extremely poor and BR J14562007 PSS J18025616 (WHT run of June 2002). The two last columns of Table 3 give the minimum and maximum redshift for each quasar spectrum. This is illustrated by Figure 4 which shows the cumulative number of lines of sight along which a Å C IV (top panel) or a Mg II (bottom panel) could be detected at the 5 confidence level. This is the survey sensitivity, , defined as follows,
| (1) |
where H is the Heaviside step function. On the same figure the redshift distribution of the sub-samples of Å C IV and Mg II, respectively, are plotted.
The number density of quasar absorbers is the number of absorbers, , per unit redshift , i.e., . This is a directly observable quantity, although, its interpretation is dependent on the geometry of the Universe. Indeed, the evolution of the number density of absorbers with redshift is the intrinsic evolution of the true number of absorbers combined with effects due to the expansion of the Universe. For a non-zero -Universe, the expected incidence of absorbers, under the null hypothesis that there has been no evolution in number density, gas cross-section, kinematics or chemical content, can be described as (Tytler 1981)
| (2) |
For a flat , Universe, a non-evolving number density can be modelled with the following:
| (3) |
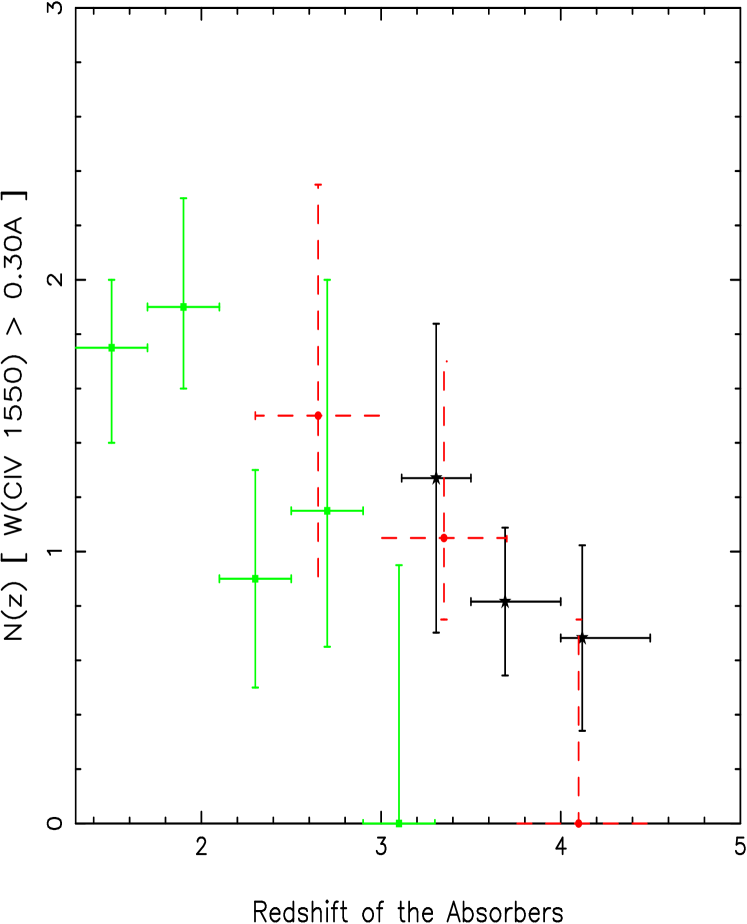
We compute the number density of Å C IV (top panel of Figure 5) and compare our results with the previous determinations of Steidel (1990) and Misawa et al. (2002) at lower redshifts. It appears that in these two studies the last bin is an underestimate of n(z) since no C IV doublets are detected in a range where they might be expected to be seen. Most probably these are due to the limitation of the surveys. Nevertheless, the combination of these various studies show that the number density of Å C IV absorbers decreases with redshift.
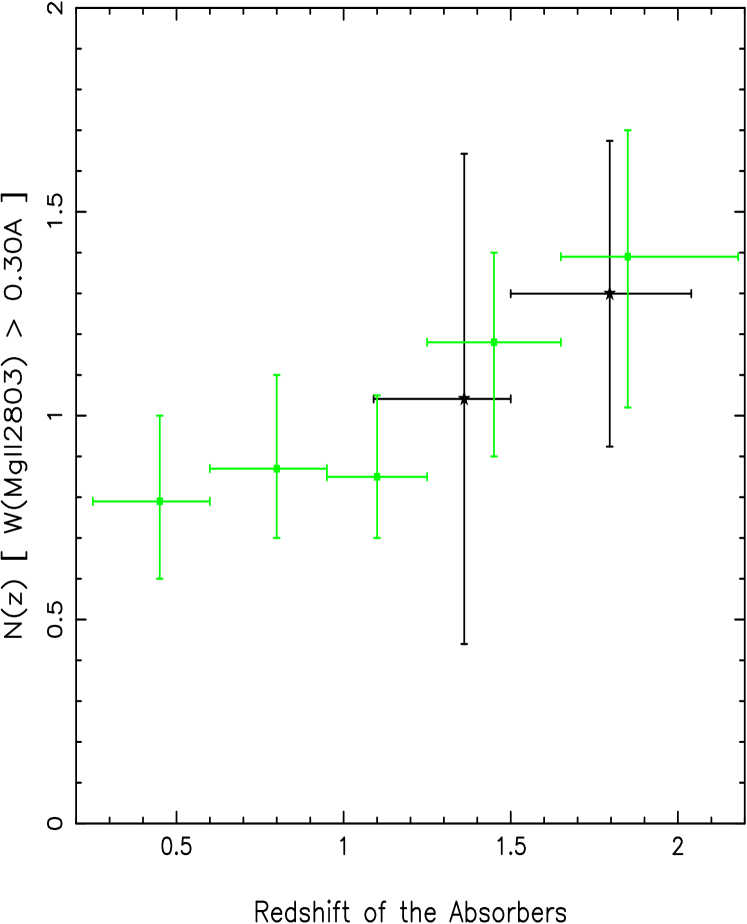
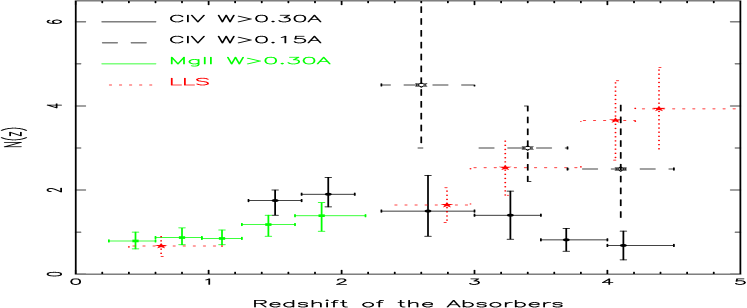
In the bottom panel of Figure 5, we present the result of a similar computation for the Å Mg II absorbers and compare it with the survey of Steidel & Sargent (1992). Both studies agree well within the error bars. In Figure 6 (top panel), we compare the number density of various classes of quasar absorbers: Å C IV doublets (Steidel 1990, Misawa et al. 2002 and this work according to the redshift considered), Å C IV absorbers (Misawa et al. 2002), Mg II doublets (Steidel & Sargent 1992) and LLS (Péroux et al. 2003). The first striking point from this figure is the good agreement between Å Mg II absorbers and LLS number densities in the redshift range where they overlap. Indeed, both these systems are known to arise from similar regions of galaxies (Bergeron & Boissé 1991). Their number density is found to decrease with decreasing redshift. On the other hand, C IV n(z) increases with time whatever the equivalent width threshold considered. Although, the number statistics are still small at Å, it is clear from Figure 6 that there are at least three times more of these systems in the Universe than Å absorbers.
The evolution is illustrated in the bottom panel of Figure 6 where we plot the comoving path density. This is the number of systems per comoving path length versus redshift for our assumed cosmology:
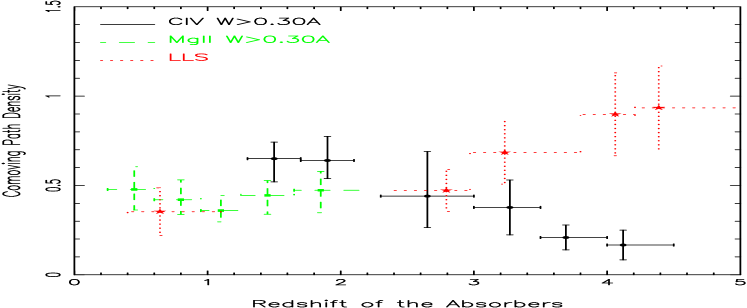
Therefore a non-evolving population of absorbers should have a constant comoving path density over time. We find that although this roughly holds for all absorbers at , above both C IV doublets and LLS are found to depart from the horizontal line. In the region , the error bars are still large for firm conclusions to be drawn. These results arise from both the new high redshift data now available and the use of an updated non-zero -cosmology. Such an evolution is most probably the signature of the formation of halos of galaxies of size 100 h-1 kpc from 50 h-1 kpc systems, a process which seems to end below .
5.2 Metal Ratios
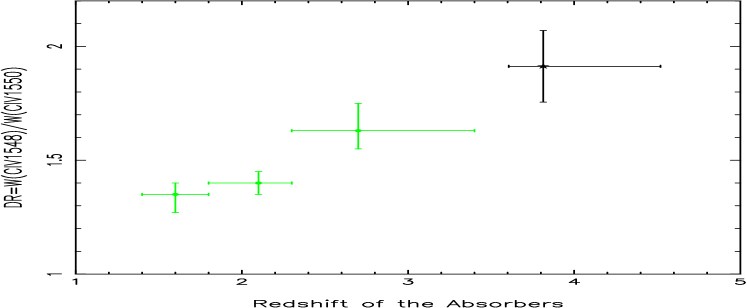
The C IV doublet ratio DR=/ probes the physical nature of the C IV absorbers. Theoretically, DR varies from 2 for the lines situated on the linear part of the curve of growth to 1 for saturated lines. Figure 7 shows the redshift evolution of DR by comparing results from Steidel (1990) at low redshift with results from our sample for C IV doublets at , both with Å. In order to enable comparison with previous work, doublets which are separated by less than 1000 km s-1 are merged together and their equivalent width is combined. This is based on the possibility that clustered components are not physically independent and that the number of components seen is sensitive to the spectrum quality. Our resulting sample is composed of 37 C IV doublets with Å (note that this is more than in Table 2 since in that case it is Å which is used as a criterion). We note that the trend revealed by Steidel (1990) (i.e. a decrease of DR with decreasing redshift) already started at earlier times (). Assuming that DR and W are uncorrelated, this could be due to either a decrease in the mean Doppler parameter, or to an increase in the mean column density, N(C IV), as time goes on. As pointed out for previous samples (Steidel 1990), we find that DR in our survey is not correlated with , and therefore is not expected to be correlated with the line kinematics, parameterised by in the range of column densities studied here. This means that the evolution we probe in Figure 7 is probably not due to a change in b, but rather to a systematic increase in the mean column density with time.
The evolution in the mean column density of C IV absorbers could be interpreted as due to a change in the chemical abundance of carbon (Songaila 2001 and Pettini et al. 2003). Another viable explanation for the observed DR evolution is a possible change in ionization state of the carbon absorbers over time, possibly due to the evolution in the ionization continuum.
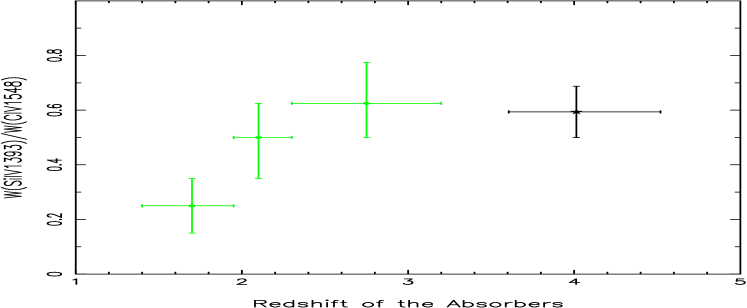
In Figure 8 we plot the ratio (Si IV1393)/(C IV1548) for the few systems in our sample which contain both these doublets. This result is shown together with the same measurement undertaken at lower redshift by Bergeron & Ikeuchi (1990). To facilitate comparison, we limit our sample to pairs with Å which corresponds to only 9 systems. We find that the ratio (Si IV1393)/(C IV1548) is approximately constant from to . At , the trend might be interpreted as evidence for a systematic increase in the ionization state of the gas. In other words, this is the opposite trend to what one would expect given the observed evolution of the C IV mean column density. Nevertheless, it should be emphasized that in order to compare with previous work from Bergeron & Ikeuchi (1990), we had to limit the sample studied to Å. These systems might not be affected by the ionization continuum in the same way as Å lines. Indeed, other independent lines of evidence based on: absorption temperature (Schaye et al. 2000); mean continuum depression in quasars (Bernardi et al. 2003, Theuns et al. 2002); and ionization level of sensitive elements in quasar absorbers (Vladilo et al. 2003), seem to favour the scenario where the He II reionization takes place around . Therefore, a change of (Si IV1393)/(C IV1548) ratio is expected around this redshift, either side of which, the ratio should remain fairly flat, not what we observe in Figure 8. Songaila (1998) found such trends in high-resolution quasar spectra, but her results were not confirmed by Kim, Cristiani & D’Odorico (2002) from comparably high quality data.
To summarise, we observe a decrease of C IV doublet DR as time goes on. This evolution is interpreted as the signature of an increase in the mean C IV column density possibly linked with chemical evolution or/and with changes in the ionization state of the absorbers.
6 Conclusion
We have presented a new sample of high-redshift quasar absorbers gathered from observations undertaken at the WHT for the northern objects and at ESO/NTT for the southern ones. These data are analysed in conjunction with previous studies in order to clarify the statistical properties of a number of metal lines and link these with the evolution of galactic structures. Our main findings can be summarised as follow:
-
•
The apparent disagreement between the redshift evolution of C IV at Å reported by Misawa et al. (2002) from a comparison with Steidel (1990), is the result of different completeness levels in the absorber samples.
-
•
The number density of Å C IV doublets increases with decreasing redshift from . Å C IV systems are more numerous than the former at all redshifts. On the other hand, of Å Mg II doublets and LLS follow each other and decreases as time goes on.
-
•
At , the LLS population is predominant while the number of Å C IV is increasing with time. Below , none of all the classes of absorbers show signs of evolution. We interpret this as the formation of galactic envelopes from smaller halos.
-
•
The doublet ratio DR=/ is found to decrease with decreasing redshift, a signature of the increase of the mean C IV column density.
-
•
A study of the (Si IV1393)/(C IV1548) ratio for strong absorbers ( Å) shows a flattening at , followed by a decrease, counter to the scenario in which the DR trend can be explained by a change in ionization continuum.
Acknowledgments
We would like to thank Jacqueline Bergeron for comments on an earlier version of the manuscript. CP is supported by a Marie Curie fellowship. This work was supported in part by the European Communities RTN network ”The Physics of the Intergalactic Medium”. This paper is based on observations obtained at the William Herschel Telescope which is operated on the island of La Palma by the Isaac Newton Group in the Spanish Observatorio del Roque de los Muchachos of the Instituto de Astrofisica de Canarias, and on observations collected during programme ESO 68.A-0279 and ESO 69.A-0541 at the European Southern Observatory with EMMI on NTT operated at La Silla Observatory, Chile.
References
- (1) Adelberger, K.L., Steidel, C.C., Shapley, A.E. & Pettini, M., 2003, ApJ, 584, 45.
- (2) Bergeron, J. & Ikeuchi, S., 1990, A&A, 235, 8.
- (3) Bergeron, J. & Boissé, P., 1991, A&A, 243, 344.
- (4) Bernardi, M. & the SDSS collaboration, 2003, AJ, 125, 32.
- (5) Boksenberg, A., Sargent, W.L.W. & Rauch, M., 2003, ApJS, submitted (astro-ph/0308557).
- (6) Chen, H-W, Lanzetta, K. & Webb, J., 2001, ApJ, 556, 158.
- (7) Churchill, C.W., Rigby, J.R., Charlton, J.C., Vogt, S.S., 1999, ApJS, 120, 51.
- (8) Churchill, C.W. & Vogt, S.S., 2001, AJ, 122, 679.
- (9) Crotts, A., Burles, S. & Tytler, D., 1997, ApJ, 489, 7.
- (10) Ellison, S., Songaila, A., Schaye, J. & Pettini, M., 2000, AJ, 120, 1175.
- (11) Haehnelt, M., Steinmetz, M. & Rauch, M., 1996, ApJL, 465, 95.
- (12) Kim, T.S., Cristiani, S. & D’Odorico, S., 2002, A&A, 383, 747.
- (13) Quashnock, J., Vanden Berk, D. & York, D., 1996. ApJ, 472, 69.
- (14) Misawa, T., Tytler, D., Iye, M., Storrie-Lombardi, L., Suzuki, N. & Wolfe, A.M., 2002, AJ, 123, 1847.
- (15) Péroux, C., Storrie-Lombardi, L.J., McMahon, R.G., Irwin, M., & Hook, I.M., 2001, AJ, 121, 1799.
- (16) Péroux, C., McMahon, R.G., Storrie-Lombardi, & L.J., Irwin, 2003, MNRAS, 346, 1103.
- (17) Petitjean, P. & Bergeron, J. 1994, A&A, 283, 759.
- (18) Pettini, M., Madau, P., Bolte, M,. Prochaska, J., Ellison, S. & Fan, X., 2003, AJ, 594, 695.
- (19) Rauch, M., Sargent, W., Womble, D. & Barlow, T., 1996, ApJ, 467, L5.
- (20) Sargent, W., Boksenberg, A. & Steidel, C., 1988, ApJS, 68, 539.
- (21) Schaye, J., Theuns, T., Rauch, M., Efstathiou, G., & Sargent, W.L.W., 2000, MNRAS, 318, 817.
- (22) Songaila, A., 1998, AJ, 115, 218.
- (23) Songaila, A., 2001, ApJ, 561, L153.
- (24) Steidel, C., 1990, ApJS, 71, 1.
- (25) Steidel, C. & Sargent, W., 1992, ApJSS, 80, 1.
- (26) Theuns, T., Schaye, J., Zaroubi, S., Kim, T.S., Tzanavaris, P. & Carswell, R., 2002, ApJ, 567, L103.
- (27) Tytler, D, 1981, Nature, 291, 289.
- (28) Vladilo, G., Centurión, M., D’Odorico, V. & Péroux, C. , 2003, A&A, 402, 487.
Appendix A Metal Line Identification
All detected absorptions with confirmed identifications are listed in Table 4 below for each quasar spectrum.
| Quasars | Identification | |||||
|---|---|---|---|---|---|---|
| BR J0006-6208 | 4.455 | 7021.28 | 1.956 | 2.08 | 0.70 | FeII 2374 |
| 7046.45 | 1.956 | 3.55 | 1.20 | FeII 2382 | ||
| 7103.95 | 3.588 | 2.44 | 0.53 | CIV 1548 | ||
| 7120.51 | 3.588 | 1.20 | 0.26 | CIV 1550 | ||
| 7158.94 | 3.588 | 1.07 | 0.23 | CI 1560 | ||
| 7438.79 | 1.956 | 0.67 | 0.23 | SiI 2515 | ||
| 7513.67 | 1.687 | 0.67 | 0.25 | MgII 2796 | ||
| 7533.75 | 1.687 | 0.16 | 0.06 | MgII 2803 | ||
| 7648.54 | 1.956 | 3.05 | 1.03 | FeII 2586 | ||
| 7686.24 | 1.956 | 3.96 | 1.34 | FeII 2600 | ||
| 8040.22 | 1.956 | 4.19 | 1.42 | if real FeI 2719 | ||
| 8268.55 | 1.956 | 5.79 | 1.96 | MgII 2796 sat | ||
| 8289.04 | 1.956 | 5.12 | 1.73 | MgII 2803 sat | ||
| 8435.04 | 1.956 | 1.22 | 0.41 | MgI 2852 | ||
| BR J00305129 | 4.174 | 6913.48 | 3.465 | 1.38 | 0.31 | CIV 1548 |
| 6925.59 | 3.465 | 0.96 | 0.22 | CIV 1550 | ||
| PSS J00341639 | 4.293 | 6663.26 | 1.798 | 4.71 | 1.68 | FeII 2382 |
| 6816.75 | 4.225 | 0.88 | 0.17 | SiII 1304 | ||
| 6836.35 | 3.478 | 0.99 | 0.22 | SiII 1526 | ||
| 6877.33 | 3.442 | 3.07 | 0.69 | CIV 1548 | ||
| 6888.96 | 3.442 | 2.82 | 0.63 | CIV 1550 | ||
| 6935.49 | 3.478 | 2.74 | 0.61 | CIV 1548 (3.442 CI 1560) | ||
| 6944.17 | 3.478 | 1.61 | 0.36 | CIV 1550 (4.225 CI 1328) | ||
| 7237.51 | 1.588 | 2.17 | 0.84 | MgII 2796 (1.798 FeII 2586) | ||
| 7254.15 | 1.588 | 0.93 | 0.36 | MgII 2803 | ||
| 7279.15 | 1.798 | 4.61 | 1.65 | FeII 2600 | ||
| 7824.35 | 1.798 | 4.69 | 1.68 | MgII 2796 sat | ||
| 7844.70 | 1.798 | 3.94 | 1.41 | MgII 2803 | ||
| 8062.75 | 1.883 | 2.57 | 0.89 | MgII 2796 | ||
| 8082.71 | 1.883 | 1.04 | 0.36 | MgII 2803 | ||
| 8087.25 | 4.225 | 2.37 | 0.45 | CIV 1548 | ||
| 8103.07 | 4.225 | 1.30 | 0.25 | CIV 1550 | ||
| PSS J01330400 | 4.154 | 6372.36 | 3.771 | 5.23 | 1.10 | CII 1334 |
| 6406.40 | 3.138 | 4.57 | 1.10 | CIV 1548 | ||
| 6416.68 | 3.138 | 2.79 | 0.67 | CIV 1550 | ||
| 6438.17 | 3.620 | 1.13 | 0.24 | SiIV 1393 | ||
| 6479.49 | 3.620 | 1.11 | 0.24 | SiIV 1402 | ||
| 6507.30 | 3.996 | 1.63 | 0.33 | OI 1302 | ||
| 6514.00 | 3.996 | 0.53 | 0.11 | SiII 1304 | ||
| 6545.49 | 3.229 | 0.76 | 0.18 | CIV 1548 (4.110 CI 1280) | ||
| 6555.91 | 3.229 | 0.44 | 0.10 | CIV 1550 | ||
| 6648.55 | 3.771 | 2.11 | 0.44 | SiIV 1393 | ||
| 6663.09 | 4.110 | 1.69 | 0.33 | SiII 1304 | ||
| 6691.32 | 3.771 | 1.11 | 0.23 | SiIV 1402 | ||
| 6894.13 | 1.664 | 2.36 | 0.89 | FeII 2586 | ||
| 6929.30 | 1.664 | 3.26 | 1.22 | FeII 2600 | ||
| 6962.01 | 3.992 | 2.88 | 0.58 | SiIV 1393 | ||
| 7005.36 | 3.992 | 1.19 | 0.24 | SiIV 1402 | ||
| 7121.44 | 4.110 | 0.61 | 0.12 | SiIV 1393 | ||
| 7128.77 | 4.115 | 1.94 | 0.38 | SiIV 1393 | ||
| 7167.68 | 4.110 | 0.62 | 0.12 | SiIV 1402 | ||
| 7174.99 | 4.115 | 1.24 | 0.24 | SiIV 1402 | ||
| 7281.79 | 3.771 | 4.46 | 0.93 | SiII 1526 | ||
| 7385.12 | 3.771 | 2.88 | 0.60 | CIV 1548 | ||
| 7397.15 | 3.771 | 1.58 | 0.33 | CIV 1550 |
| Quasars | Identification | |||||
|---|---|---|---|---|---|---|
| 7449.89 | 1.664 | 4.32 | 1.62 | MgII 2796 sat | ||
| 7469.08 | 1.664 | 4.11 | 1.54 | MgII 2803 sat | ||
| 7604.01 | 1.664 | 2.05 | 0.77 | MgI 2852 | ||
| 7671.08 | 3.771 | 3.10 | 0.65 | FeII 1608 | ||
| 7728.49 | 3.992 | 1.69 | 0.34 | CIV 1548 | ||
| 7735.34 | 3.996 | 1.43 | 0.29 | CIV 1548 | ||
| 7742.27 | 3.992 | 0.89 | 0.18 | CIV 1550 | ||
| 7747.94 | 3.996 | 0.65 | 0.13 | CIV 1550 | ||
| 7810.29 | 4.115 | 0.43 | 0.08 | SiII 1526 | ||
| PSS J02481802 | 4.422 | 6909.82 | 1.470 | 3.46 | 1.40 | MgII 2796 |
| 6926.86 | 3.969 | 0.95 | 0.19 | SiIV 1393 (1.470 MgII 2803) | ||
| 6970.76 | 3.969 | 0.30 | 0.06 | SiIV 1402 | ||
| 7227.49 | 4.185 | 1.29 | 0.25 | SiIV 1393 | ||
| 7275.61 | 4.185 | 0.86 | 0.17 | SiIV 1402 | ||
| BR J03111722 | 4.039 | 6553.53 | 4.034 | 0.46 | 0.09 | OI 1302 |
| 7794.11 | 4.034 | 6.63 | 1.32 | CIV 1548 assym profiles | ||
| 7808.10 | 4.034 | 2.37 | 0.47 | CIV 1550 | ||
| BR J03242918 | 4.622 | 7347.10 | 3.746 | 0.57 | 0.12 | CIV 1548 |
| 7359.84 | 3.746 | 0.72 | 0.15 | CIV 1550 | ||
| 7564.20 | 2.227 | 0.91 | 0.28 | FeII 2344 | ||
| 7691.00 | 2.227 | 1.42 | 0.44 | FeII 2382 | ||
| 8176.73 | 1.923 | 1.33 | 0.46 | MgII 2796 | ||
| 8196.15 | 1.923 | 0.64 | 0.22 | MgII 2803 | ||
| 8345.80 | 2.227 | 0.77 | 0.24 | FeII 2586 | ||
| 8392.62 | 2.227 | 1.36 | 0.42 | FeII 2600 | ||
| BR J03341612 | 4.363 | 6673.26 | 3.788 | 1.05 | 0.22 | SiIV 1393 |
| 6713.80 | 3.788 | 0.57 | 0.12 | SiIV 1402 | ||
| 7228.38 | 3.668 | 1.07 | 0.23 | CIV 1548 (4.186 SiIV 1393) | ||
| 7239.12 | 3.668 | 0.37 | 0.08 | CIV 1550 | ||
| 7275.85 | 4.186 | 1.93 | 0.37 | SiIV 1402 | ||
| 7368.97 | 3.759 | 1.61 | 0.34 | CIV 1548 | ||
| 7381.79 | 3.759 | 0.81 | 0.17 | CIV 1550 | ||
| BR J03553811 | 4.545 | 7516.08 | 3.855 | 0.51 | 0.11 | CIV 1548 |
| 7528.44 | 3.855 | 0.59 | 0.12 | CIV 1550 | ||
| 7723.51 | 1.986 | 2.09 | 0.70 | FeII 2586 | ||
| 7764.48 | 1.986 | 3.49 | 1.17 | FeII 2600 | ||
| 8226.45 | 4.313 | 2.88 | 0.54 | CIV 1548 | ||
| 8233.01 | 4.318 | 3.92 | 0.74 | CIV 1548 | ||
| 8239.86 | 4.313 | 1.02 | 0.19 | CIV 1550 | ||
| 8248.49 | 4.318 | 1.06 | 0.20 | CIV 1550 | ||
| 8349.70 | 1.986 | 10.28 | 3.42 | MgII 2796 | ||
| 8371.16 | 1.986 | 9.38 | 3.14 | MgII 2803 | ||
| BR J04195716 | 4.461 | 7217.62 | 2.028 | 2.45 | 0.81 | FeII 2382 |
| 7834.70 | 2.028 | 1.51 | 0.50 | FeII 2586 | ||
| 7875.67 | 2.028 | 2.30 | 0.76 | FeII 2600 | ||
| 8080.50 | 4.218 | 2.73 | 0.52 | CIV 1548 | ||
| 8095.89 | 4.218 | 1.49 | 0.29 | CIV 1550 | ||
| 8225.50 | 4.311 | 3.32 | 0.63 | CIV 1548 | ||
| 8239.86 | 4.311 | 0.97 | 0.18 | CIV 1550 | ||
| 8411.29 | 4.434 | 0.60 | 0.11 | CIV 1548 | ||
| 8426.32 | 4.434 | 0.44 | 0.08 | CIV 1550 | ||
| 7132.42 | 3.606 | 5.20 | 1.13 | CIV 1548 | ||
| 7143.72 | 3.606 | 3.25 | 0.71 | CIV 1550 | ||
| 7209.92 | 4.172 | 2.08 | 0.40 | SiIV 1393 | ||
| 7249.67 | 3.682 | 1.07 | 0.23 | CIV 1548 | ||
| 7255.61 | 4.172 | 2.10 | 0.41 | SiIV 1402 | ||
| 7261.58 | 3.682 | 0.82 | 0.18 | CIV 1550 | ||
| 8007.87 | 4.172 | 3.14 | 0.61 | CIV 1548 | ||
| 8020.81 | 4.172 | 1.88 | 0.36 | CIV 1550 | ||
| BR J04262202 | 4.320 | 7132.42 | 3.606 | 5.20 | 1.13 | CIV 1548 |
| 7143.72 | 3.606 | 3.25 | 0.71 | CIV 1550 |
| Quasars | Identification | |||||
|---|---|---|---|---|---|---|
| 7209.92 | 4.172 | 2.08 | 0.40 | SiIV 1393 | ||
| 7249.67 | 3.682 | 1.07 | 0.23 | CIV 1548 | ||
| 7255.61 | 4.172 | 2.10 | 0.41 | SiIV 1402 | ||
| 7249.67 | 3.682 | 1.07 | 0.17 | CIV 1548 | ||
| 8007.87 | 4.172 | 3.14 | 0.61 | CIV 1548 | ||
| 8020.81 | 4.172 | 1.88 | 0.36 | CIV 1550 | ||
| PMN J05253343 | 4.383 | 7057.43 | 4.063 | 0.65 | 0.13 | SiIV 1393 |
| 7093.42 | 3.581 | 1.00 | 0.22 | CIV 1548 (4.063 SiIV 1402) | ||
| 7104.99 | 3.581 | 0.78 | 0.17 | CIV 1550 | ||
| 7182.54 | 1.568 | 3.05 | 1.19 | MgII 2796 | ||
| 7201.04 | 1.568 | 3.19 | 1.24 | MgII 2803 | ||
| 7367.39 | 3.581 | 0.92 | 0.20 | FeII 1608 | ||
| 7569.07 | 4.430 | 3.40 | 0.63 | SiIV 1393 | ||
| 7618.63 | 4.430 | 4.57 | 0.84 | SiIV 1402 | ||
| 7729.29 | 4.063 | 1.36 | 0.27 | SiII 1526 | ||
| 7841.89 | 4.063 | 1.45 | 0.29 | CIV 1548 | ||
| 7854.16 | 4.063 | 0.68 | 0.13 | CIV 1550 | ||
| 8145.68 | 4.063 | 0.80 | 0.16 | FeII 1608 | ||
| 225.917 | 4.313 | 3.48 | 0.65 | CIV 1548 | ||
| 8239.63 | 4.313 | 0.46 | 0.09 | CIV 1550 | ||
| BR J05293552 | 4.172 | 6605.73 | 4.062 | 1.42 | 0.28 | SiII 1304 |
| 6708.94 | 1.398 | 1.20 | 0.50 | MgII 2796 | ||
| 6726.52 | 1.398 | 0.57 | 0.24 | MgII 2803 | ||
| 6759.82 | 4.062 | 0.49 | 0.10 | CII 1334 | ||
| 6779.25 | 1.423 | 0.87 | 0.36 | MgII 2796 | ||
| 6795.07 | 1.423 | 0.77 | 0.32 | MgII 2803 | ||
| 6973.94 | 3.503 | 2.40 | 0.53 | CIV 1548 | ||
| 6985.50 | 3.503 | 1.39 | 0.31 | CIV 1550 | ||
| 7058.81 | 4.062 | 1.84 | 0.36 | SiIV 1393 | ||
| 7103.20 | 4.062 | 1.45 | 0.29 | SiIV 1402 | ||
| 7244.21 | 3.503 | 1.48 | 0.33 | FeII 1608 | ||
| 7427.65 | 1.656 | 0.91 | 0.34 | MgII 2796 | ||
| 7449.85 | 1.656 | 1.20 | 0.45 | MgII 2803 | ||
| 7528.19 | 3.503 | 1.00 | 0.22 | AlII 1670 | ||
| 7729.91 | 4.062 | 0.94 | 0.19 | SiII 1526 | ||
| BR J07146455 | 4.462 | 7238.83 | 4.193 | 0.85 | 0.16 | SiIV 1393 |
| 7248.78 | 3.747 | 1.03 | 0.22 | SiII 1526 (4.193 SiIV 1402) | ||
| 7350.31 | 3.747 | 1.97 | 0.41 | CIV 1548 | ||
| 7362.34 | 3.747 | 0.74 | 0.16 | CIV 1550 | ||
| 7689.35 | 3.966 | 2.58 | 0.52 | CIV 1548 | ||
| 7701.69 | 3.966 | 2.04 | 0.41 | CIV 1550 | ||
| 8040.53 | 4.193 | 2.55 | 0.49 | CIV 1548 | ||
| 8053.67 | 4.193 | 1.17 | 0.23 | CIV 1550 | ||
| PSS J07474434 | 4.430 | … | … | … | … | … |
| PSS J11591337 | 4.073 | 6418.61 | 1.739 | 1.09 | 0.40 | FeII 2344 |
| 6502.11 | 1.739 | 0.43 | 0.16 | FeII 2374 | ||
| 6522.56 | 1.739 | 1.83 | 0.67 | FeII 2382 | ||
| 6582.48 | 3.724 | 1.24 | 0.26 | SiIV 1393 | ||
| 6625.76 | 3.756 | 1.11 | 0.23 | SiIV 1393 (3.724 SiIV 1402) | ||
| 6670.04 | 3.756 | 0.34 | 0.07 | SiIV 1402 | ||
| 7081.73 | 1.739 | 0.75 | 0.27 | FeII 2586 | ||
| 7119.62 | 1.739 | 1.64 | 0.60 | FeII 2600 | ||
| 7311.64 | 3.724 | 1.02 | 0.22 | CIV 1548 | ||
| 7323.59 | 3.724 | 0.42 | 0.09 | CIV 1550 | ||
| PSS J12530228 | 4.007 | 6142.86 | 3.606 | 1.23 | 0.27 | CII 1334 |
| 6320.60 | 1.261 | 2.22 | 0.98 | MgII 2796 | ||
| 6335.10 | 1.261 | 0.89 | 0.39 | MgII 2803 | ||
| 6415.92 | 3.606 | 4.98 | 1.08 | SiIV 1393 | ||
| 6458.09 | 3.606 | 3.89 | 0.84 | SiIV 1402 | ||
| 7127.23 | 3.606 | 5.25 | 1.14 | CIV 1548 | ||
| 7139.24 | 3.606 | 4.16 | 0.90 | CIV 1550 |
| Quasars | Identification | |||||
|---|---|---|---|---|---|---|
| BR J13302522 | 3.949 | 6319.29 | 3.084 | 2.01 | 0.49 | CIV 1548 |
| 6329.36 | 3.084 | 1.51 | 0.37 | CIV 1550 | ||
| 6645.79 | 3.772 | 0.78 | 0.16 | SiIV 1393 | ||
| 6689.87 | 3.772 | 0.32 | 0.07 | SiIV 1402 | ||
| 6794.58 | 3.390 | 0.85 | 0.19 | CIV 1548 | ||
| 6805.62 | 3.390 | 0.81 | 0.18 | CIV 1550 | ||
| 6819.10 | 3.084 | 1.38 | 0.34 | AlII 1670 | ||
| 6874.38 | 3.440 | 1.55 | 0.35 | triplet | ||
| 7383.72 | 3.769 | 1.93 | 0.40 | CIV 1548 | ||
| 7395.73 | 3.769 | 1.64 | 0.34 | CIV 1550 | ||
| PSS 14562007 | 4.249 | 7720.09 | 1.761 | 0.95 | 0.34 | MgII 2796 |
| 7740.89 | 1.761 | 0.70 | 0.25 | MgII 2803 | ||
| 7796.79 | 4.036 | 1.25 | 0.25 | CIV 1548 | ||
| 7807.97 | 4.036 | 0.58 | 0.12 | CIV 1550 | ||
| 0.11 PSS J16184125 | 4.213 | 7276.55 | 4.223 | 0.60 | SiIV 1393 | |
| 7382.46 | 4.223 | 0.57 | 0.11 | SiIV 1402 | ||
| 0.16 PSS J16331411 | 4.351 | 7091.98 | 3.580 | 0.75 | CIV 1548 | |
| 7104.05 | 3.580 | 0.40 | 0.09 | CIV 1550 | ||
| 7179.44 | 4.150 | 0.96 | 0.19 | SiIV 1393 | ||
| 7225.18 | 4.150 | 0.70 | 0.14 | SiIV 1402 | ||
| 8177.34 | 4.282 | 2.37 | 0.45 | CIV 1548 | ||
| 8192.78 | 4.282 | 1.573 | 0.30 | CIV 1550 | ||
| PSS J16465514 | 4.037 | 6988.64 | 3.516 | 0.23 | 0.05 | CIV 1548 |
| 7000.70 | 3.516 | 0.33 | 0.07 | CIV 1550 (3.521 CIV 1548) | ||
| 7010.49 | 4.030 | 0.89 | 0.18 | SiIV 1393 (3.521 CIV 1550) | ||
| 7033.53 | 3.544 | 2.26 | 0.50 | CIV 1548 | ||
| 7045.50 | 3.544 | 1.40 | 0.31 | CIV 1550 | ||
| 7055.81 | 4.030 | 0.48 | 0.10 | SiIV 1402 | ||
| 7357.65 | 3.754 | 1.43 | 0.30 | CIV 1548 | ||
| 7366.80 | 3.759 | 0.40 | 0.08 | CIV 1548 | ||
| 7369.19 | 3.754 | 1.11 | 0.23 | CIV 1550 | ||
| 7378.21 | 3.759 | 0.14 | 0.03 | CIV 1550 | ||
| 7678.92 | 4.030 | 0.65 | 0.13 | SiII 1526 | ||
| 7786.91 | 4.030 | 1.39 | 0.28 | CIV 1548 | ||
| 7797.52 | 4.037 | 1.28 | 0.25 | CIV 1548 | ||
| 7798.54 | 4.030 | 2.38 | 0.47 | CIV 1550 | ||
| 7809.73 | 4.037 | 0.44 | 0.09 | CIV 1550 | ||
| 7994.39 | 1.859 | 0.92 | 0.32 | MgII 2796 | ||
| 8015.44 | 1.859 | 0.51 | 0.18 | MgII 2803 | ||
| 8089.58 | 4.030 | 0.14 | 0.03 | FeII 1608 | ||
| PSS J17232243 | 4.520 | 7065.98 | 3.696 | 0.69 | 0.15 | SiII 1526 (dbl cpt) |
| 7283.89 | 3.704 | 3.02 | 0.64 | CIV 1548 | ||
| 7296.29 | 3.704 | 1.29 | 0.27 | CIV 1550 | ||
| 7311.00 | 4.244 | 1.20 | 0.23 | SiIV 1393 | ||
| 7355.29 | 4.244 | 0.49 | 0.09 | SiIV 1402 | ||
| 7550.54 | 3.696 | 1.51 | 0.32 | FeII 1608 (dbl cpt) | ||
| 7843.36 | 3.696 | 2.67 | 0.57 | AlII 1670 (dbl cpt) | ||
| 8004.04 | 4.244 | 0.83 | 0.16 | SiII 1526 | ||
| 8104.95 | 4.234 | 0.85 | 0.16 | CIV 1548 | ||
| 8117.52 | 4.244 | 1.81 | 0.35 | CIV 1548 | ||
| 8120.59 | 4.234 | 1.52 | 0.29 | CIV 1550 | ||
| 8137.92 | 4.244 | 0.77 | 0.15 | CIV 1550 | ||
| PSS J18025616 | 2.891 | 7035.30 | 4.048 | 0.69 | 0.14 | SiIV 1393 |
| 7080.97 | 4.048 | 0.50 | 0.10 | SiIV 1402 (3.651 SiII 1526) | ||
| 8035.92 | 4.190 | 1.33 | 0.26 | CIV 1548 | ||
| 8047.76 | 4.190 | 0.44 | 0.08 | CIV 1550 |
| Quasars | Identification | |||||
|---|---|---|---|---|---|---|
| PSS J21540335 | 4.363 | 6912.21 | 3.961 | 1.07 | 0.22 | SiIV 1393 |
| 6958.06 | 3.961 | 0.79 | 0.16 | SiIV 1402 | ||
| 7127.54 | 1.756 | 1.72 | 0.62 | FeII 2586 | ||
| 7168.48 | 1.756 | 3.33 | 1.21 | FeII 2600 | ||
| 7531.09 | 3.776 | 0.89 | 0.19 | CIV 1548 | ||
| 7545.17 | 3.776 | 1.00 | 0.21 | CIV 1550 cont | ||
| 7681.74 | 3.961 | 1.98 | 0.40 | CIV 1548 | ||
| 7694.48 | 3.961 | 1.47 | 0.30 | CIV 1550 | ||
| 7706.41 | 1.756 | 4.68 | 1.70 | MgII 2796 sat | ||
| 7727.70 | 1.756 | 4.49 | 1.63 | MgII 2803 sat | ||
| 7865.25 | 1.756 | 1.07 | 0.39 | MgI 2852 | ||
| PSS J21551358 | 4.256 | 6943.22 | 1.914 | 2.23 | 0.77 | FeII 2382 |
| 7067.67 | 3.567 | 2.98 | 0.65 | CIV 1548 | ||
| 7079.20 | 3.567 | 2.02 | 0.44 | CIV 1550 | ||
| 7308.18 | 4.244 | 2.15 | 0.41 | SiIV 1393 | ||
| 7354.97 | 4.244 | 2.28 | 0.43 | SiIV 1402 | ||
| 7538.26 | 1.914 | 0.42 | 0.14 | FeII 2586 | ||
| 7579.07 | 1.914 | 1.33 | 0.46 | FeII 2600 | ||
| 8117.54 | 4.244 | 2.90 | 0.55 | CIV 1548 sat | ||
| 8131.14 | 4.244 | 2.22 | 0.42 | CIV 1550 sat | ||
| 8148.42 | 1.914 | 5.16 | 1.77 | MgII 2796 sat | ||
| 8170.12 | 1.914 | 5.08 | 1.74 | MgII 2803 sat | ||
| BR J22166714 | 4.469 | 7173.70 | 2.060 | 3.29 | 1.08 | FeII 2344 |
| 7268.79 | 2.060 | 2.43 | 0.79 | FeII 2374 | ||
| 7295.82 | 2.060 | 3.61 | 1.18 | FeII 2382 | ||
| 7320.39 | 3.728 | 0.82 | 0.17 | CIV 1548 | ||
| 7333.77 | 3.728 | 0.70 | 0.15 | CIV 1550 | ||
| 7367.07 | 4.285 | 0.84 | 0.16 | SiIV 1393 | ||
| 7413.73 | 4.285 | 0.68 | 0.13 | SiIV 1402 | ||
| 7491.72 | 3.837 | 0.64 | 0.13 | CIV 1548 | ||
| 7503.76 | 3.837 | 0.47 | 0.10 | CIV 1550 | ||
| 7607.87 | 3.728 | 0.40 | 0.08 | FeII 1608 | ||
| 7889.88 | 4.095 | 1.30 | 0.26 | CIV 1548 | ||
| 7902.97 | 4.095 | 0.33 | 0.06 | CIV 1550 | ||
| 7914.40 | 2.060 | 3.09 | 1.01 | FeII 2586 | ||
| 7956.90 | 2.060 | 4.44 | 1.45 | FeII 2600 | ||
| PSS J23440342 | 4.239 | 6531.04 | 3.219 | 2.20 | 0.52 | CIV 1548 |
| 6542.17 | 3.219 | 2.04 | 0.48 | CIV 1550 | ||
| 6589.50 | 4.053 | 0.88 | 0.17 | SiII 1304 | ||
| 6789.50 | 3.219 | 1.81 | 0.43 | FeII 1608 | ||
| 6805.74 | 3.882 | 1.52 | 0.31 | SiIV 1393 | ||
| 6849.34 | 3.882 | 1.31 | 0.27 | SiIV 1402 | ||
| 7050.98 | 3.219 | 2.93 | 0.69 | AlII 1670 | ||
| 7453.44 | 3.882 | 0.75 | 0.15 | SiII 1526 | ||
| 7559.01 | 3.882 | 2.67 | 0.55 | CIV 1548 | ||
| 7571.64 | 3.882 | 1.56 | 0.32 | CIV 1550 | ||
| 7714.09 | 4.053 | 0.54 | 0.11 | SiII 1526 | ||
| 7824.45 | 4.053 | 0.43 | 0.09 | CIV 1548 | ||
| 7836.06 | 4.053 | 0.22 | 0.04 | CIV 1550 | ||
| BR J23493712 | 4.208 | 6538.49 | 3.690 | 1.23 | 0.26 | SiIV 1393 (3.284 SiII 1526) |
| 6581.17 | 3.690 | 0.93 | 0.20 | SiIV 1402 | ||
| 6592.52 | 3.258 | 2.20 | 0.52 | CIV 1548 | ||
| 6603.81 | 3.258 | 1.34 | 0.31 | CIV 1550 | ||
| 6632.13 | 3.284 | 0.66 | 0.15 | CIV 1548 | ||
| 6643.93 | 3.284 | 0.54 | 0.13 | CIV 1550 | ||
| 6891.96 | 3.284 | 0.99 | 0.23 | FeII 1608 | ||
| 7161.63 | 3.284 | 0.77 | 0.18 | AlII 1670 |
| Quasars | Identification | |||||
|---|---|---|---|---|---|---|
| 7267.37 | 3.690 | 1.06 | 0.23 | CIV 1548 | ||
| 7274.45 | 3.690 | 0.78 | 0.17 | CIV 1550 | ||
| 7364.09 | 3.757 | 2.13 | 0.45 | CIV 1548 | ||
| 7377.16 | 3.757 | 1.60 | 0.34 | CIV 1550 | ||
| 7679.67 | 3.960 | 1.54 | 0.31 | CIV 1548 | ||
| 7694.11 | 3.960 | 0.61 | 0.12 | CIV 1550 | ||
| 7714.71 | 1.758 | 1.01 | 0.37 | MgII 2796 | ||
| 7734.25 | 1.758 | 0.35 | 0.13 | MgII 2803 | ||
| 7832.95 | 3.690 | 1.30 | 0.28 | AlII 1670 |
∗Object possibly affect d by BAL features.