A phase-dependent absorption line in the spectrum of the X-ray pulsar RX J0720.4$-$3125††thanks: Based on observations with XMM-Newton, an ESA Science Mission with instruments and contributions directly funded by ESA Member states and the USA (NASA)
The XMM-Newton spectra of the isolated neutron star RX J0720.4$-$3125 show deviations from a Planckian energy distribution below 400 eV, similar to the spectra of RBS1223, another long-period X-ray pulsar, as reported recently by Haberl et al. (2003). For a Gaussian-shaped absorption line we derive an energy of 271 eV and an equivalent width of 40 eV from the phase-averaged spectra of RX J0720.4$-$3125. We investigate the spectral variations seen in hardness ratios as function of pulse phase and find that they are best described by changes in the depth of the absorption line. The line equivalent width changes between 31 eV around intensity maximum of the pulse and 58 eV at the declining part of the pulse. Small variations (20 eV) of the line energy with pulse phase may still be caused by statistical fluctuations. On the other hand, the black-body temperature varies significantly by 2.5 eV (statistical 90% errors typically 0.7 eV) reaching the highest value at pulse maximum. One possible interpretation for the absorption line is cyclotron resonance scattering of protons in a magnetic field with B 5 G. This field strength is compatible with estimates inferred from recent spin down measurements of the pulsar.
Key Words.:
stars: individual: RX J0720.4$-$3125 – stars: neutron – stars: magnetic fields – X-rays: stars1 Introduction
The soft X-ray source RX J0720.4$-$3125 was discovered in the ROSAT all-sky survey data by Haberl et al. (1997). The detection of 8.39 s sinusoidal pulsations in the X-ray flux, its black-body-like spectrum with little interstellar absorption and the identification with a faint blue optical star (Motch & Haberl 1998; Kulkarni & van Kerkwijk 1998; Kaplan et al. 2003; Motch et al. 2003) classified this object as a nearby isolated neutron star. It is the second brightest of a group of seven, maybe eight, radio quiet (recently stringent limits were obtained for RX J0720.4$-$3125 and RX J0806.4$-$4123, Johnston 2003) and X-ray dim isolated neutron stars (XDINs; for a recent review see Haberl 2003).
The available low-resolution X-ray spectra obtained by ROSAT from XDINs were all consistent with Planckian energy distributions of temperatures kT in the range 40 – 100 eV and little attenuation by interstellar absorption. More recent observations of RX J0720.4$-$3125 and the brightest object RX J1856.4$-$3754 were performed using the low energy transmission grating spectrometer (LETGS) aboard Chandra and the reflection grating spectrometers (RGSs) of XMM-Newton. Also at high spectral resolution both sources show no significant narrow features in their spectra which can best be modeled by a Planckian spectrum (Paerels et al. 2001; Burwitz et al. 2001) or a modified Planckian spectrum (Burwitz et al. 2003). In particular the high signal to noise LETGS spectrum from a 500 ks Chandra observation of RX J1856.4$-$3754 did not reveal any significant deviation from a smooth continuum spectrum (Burwitz et al. 2003). The statistical quality and energy band coverage of the LETGS and RGS spectra of RX J0720.4$-$3125 are, however, insufficient to detect broad and shallow features in the spectrum.
Cyclotron resonance absorption features in the 0.1–1.0 keV band can be expected in spectra from magnetized neutron stars with field strengths in the range of – G or 2–2 G if caused by electrons or protons, respectively. The X-ray pulsar RBS1223 was the first XDIN for which a significant narrow-band deviation (at 300 eV, equivalent width –150 eV, width 100 eV) from a Planckian spectrum was discovered (Haberl et al. 2003, hereafter H03). This absorption feature was discussed in terms of proton cyclotron resonance scattering in a magnetic field of (2–6) G.
H03 also suggested that changes in the soft part of the X-ray spectrum of the pulsar RX J0720.4$-$3125 with pulse phase reported by Cropper et al. (2001, hereafter C01), are caused by variable cyclotron absorption. In this paper we present the results from a spectral analysis of XMM-Newton data on the isolated neutron star RX J0720.4$-$3125. The observed spectra show a broad absorption feature which varies with pulse phase. We discuss this in the framework of proton cyclotron resonance or atomic line transitions in a strong magnetic field.
| Time (UT) | XMM | Read-out | Count rate | Exp. | |
| Start | End | Detector | Mode(1) | [s-1](2) | [ks] |
| 2000 May 13, Satellite Revolution 078, Obs. ID 0124100101 | |||||
| 02:43 | 19:59 | MOS1/2 | FF/SW | 1.63/1.87 | 62.0 |
| 02:30 | 20:00 | pn | FF | 7.59 | 62.5 |
| 01:42 | 15:36 | RGS1/2 | SQ | 0.26/0.23 | 50.0 |
| 2000 Nov. 21-22, Satellite Revolution 175, 0132520301 | |||||
| 21:18 | 02:21 | MOS1/2 | LW | 1.31/1.40 | 18.2 |
| 19:21 | 02:36 | pn | FF | 6.51 | 26.1 |
| 18:30 | 03:06 | RGS1/2 | SQ | 0.24/0.23 | 30.9 |
| 2002 Nov. 6-7, Satellite Revolution 533, 0156960201 | |||||
| 17:52 | 02:14 | MOS1/2 | FF | – | 30.0 |
| 18:14 | 02:15 | pn | FF | 7.66 | 28.4 |
| 17:51 | 02:16 | RGS1/2 | SQ | 0.23/0.22 | 30.2 |
| 2002 Nov. 8-9, Satellite Revolution 534, 0156960401 | |||||
| 19:25 | 04:18 | MOS1/2 | FF | – | 31.8 |
| 19:47 | 04:18 | pn | FF | 7.64 | 30.2 |
| 19:24 | 04:19 | RGS1/2 | SQ | 0.23/0.22 | 32.0 |
(1) FF: Full Frame (time resolution of 0.073 s and 2.6 s for EPIC-pn and -MOS, respectively;
SW: Small Window (MOS time resolution 0.3 s); LW: Large Window (MOS time resolution 0.9 s); SQ: Spectro+Q
(2) Mean count rates are for the energy bands 0.13–1.5 keV (EPIC) and
0.32–0.90 keV (RGS); when not given the data are not used in the spectral analysis.
The thin filter was used in all EPIC cameras in revolutions 78, 533 and 534
and the medium filter in revolution 175.
2 XMM-Newton observations
The X-ray pulsar RX J0720.4$-$3125 was observed with XMM-Newton (Jansen et al. 2001) on five occasions. Here we utilize the data collected with the European Photon Imaging Cameras (EPICs) which provide medium energy-resolution X-ray spectra. The cameras are based on MOS (EPIC-MOS1 and -MOS2, Turner et al. 2001) and pn (EPIC-pn, Strüder et al. 2001) CCD technology and are mounted in the focal plane of the three X-ray multi-mirror systems (Aschenbach et al. 2000). Simultaneous high spectral resolution data were obtained with the Reflection Grating Spectrometers (den Herder et al. 2001). The details of the XMM-Newton observations are summarized in Table 1. We do not use the last observation because EPIC-pn was operated in SW read-out mode (less well calibrated at low energies) and with the thick filter. During the first observation the EPIC instruments suffered from strong background flares which were screened out leaving only 36 ks (pn) and 39 ks (MOS) which were used for the spectral analysis. From the other three observations all the data was used.
In processing and preparation of the observational data and model fitting of the spectra we followed H03 (using an extraction radius of 40″ for the EPIC data). We used the same version of the XMM-Newton analysis software SAS and calibration files.
3 Pulse-phase averaged spectra
3.1 Combined XMM-Newton spectra
H03 reported the analysis of the XMM-Newton spectra of RBS1223. They could not find satisfactory fits using a simple black-body model, non-magnetic neutron star atmosphere models with different element abundances or two black-body components with different temperatures. An acceptable fit was found with a broad absorption line included in the black-body model. In the following analysis of the spectra of RX J0720.4$-$3125 we find very similar residuals when comparing the measured spectra to the simple absorbed black-body model. We therefore also include a Gaussian-shaped absorption line in the modeling of the spectra of RX J0720.4$-$3125. To account for cross-calibration problems between the different instruments we allow the black-body temperature to be fit individually to each spectrum but fit the absorption column density as single free parameter to all sixteen XMM-Newton spectra simultaneously. Similarly, all three parameters of the absorption line (energy, width and normalization) were fit to all spectra simultaneously. The results for both models are reported in Table 2. The line at 271 eV is relatively broad with a width of = 64 eV. The line equivalent width (EW) is about 40 eV111All values for EW are obtained with the spectral fitting package XSPEC version 11.2.0., less prominent as measured in the spectra of RBS1223 with EW = 150 eV (H03). The XMM-Newton spectra of RX J0720.4$-$3125 together with the best fit models are shown in Fig. 1.

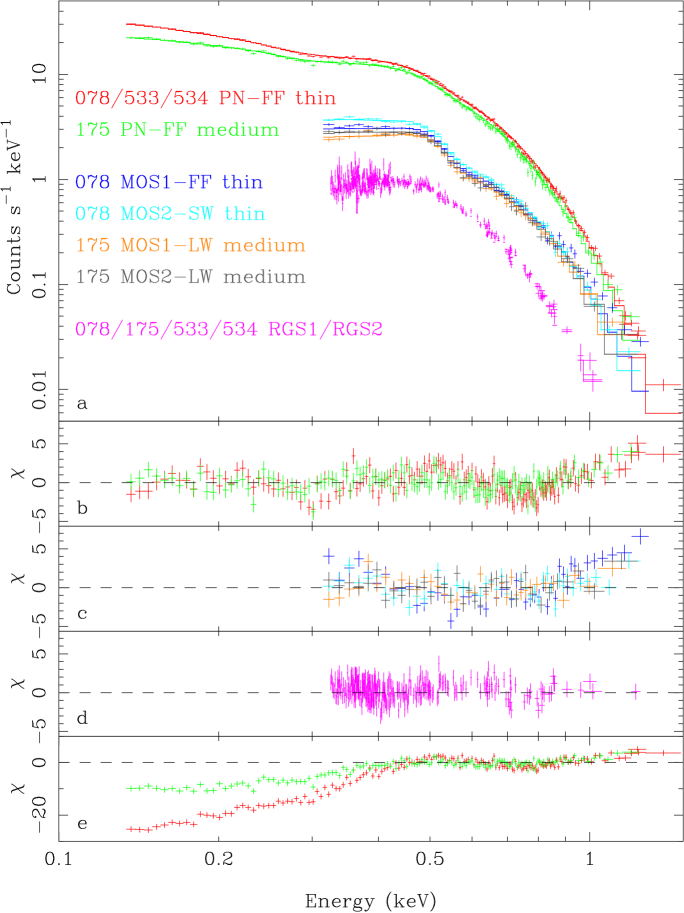
The deviation from a Planckian shape is highly significant as can be seen from the improvement in the values (Table 2) when an absorption line is included (=683 for 3 additional parameters in the fits to the spectra of the EPIC-pn instrument which is most sensitive at energies below 300 eV). In Fig. 2 the incident photon spectrum is shown (for clarity only the summed EPIC-pn spectrum from the three thin filter observations is plotted). This presentation better visualizes the absorption feature as compared to Fig. 1 where the detector response at energies below 500 eV (with relatively bad energy resolution and strong energy redistribution into lower detector channels due to electron losses in the surface layers of the detector) smears out the intrinsically broad feature.

| Model A: phabs*bbody(1) | Model B: phabs*(bbody+gaussian)(1) | |||||||||
| Obs-Inst. | kT | NH | /dof | kT | NH | Eline | EW(2) | /dof | Flux(3) | |
| [eV] | [cm-2] | per inst. | [eV] | [cm-2] | [eV] | [eV] | [eV] | per inst. | [erg cm-2 s-1] | |
| 078-pn | 85.2 | 1.38 | 84.30.3 | 0.790.13 | 27114 | 647 | 39.6 | 1.19 | ||
| 175-pn | 84.6 | =(4) | 83.40.4 | = | = | = | 39.4 | 1.22 | ||
| 533-pn | 88.6 | = | 87.50.4 | = | = | = | 40.6 | 1.19 | ||
| 534-pn | 88.3 | = | 1679/639 | 87.20.4 | = | = | = | 40.5 | 996/636 | 1.19 |
| 078-MOS1 | 84.4 | = | 84.10.6 | = | = | = | 39.6 | 1.21 | ||
| 175-MOS1 | 83.8 | = | 83.50.8 | = | = | = | 39.4 | 1.16 | ||
| 078-MOS2 | 81.6 | = | 81.30.6 | = | = | = | 38.8 | 1.49 | ||
| 175-MOS2 | 82.7 | = | 408/167 | 82.40.8 | = | = | = | 39.1 | 468/167 | 1.28 |
| 078-RGS1 | 86.7 | = | 85.01.1 | = | = | = | 39.8 | 0.99 | ||
| 175-RGS1 | 89.6 | = | 87.71.5 | = | = | = | 40.7 | 0.94 | ||
| 533-RGS1 | 95.0 | = | 93.11.6 | = | = | = | 42.7 | 0.86 | ||
| 534-RGS1 | 94.1 | = | 92.21.6 | = | = | = | 42.4 | 0.88 | ||
| 078-RGS2 | 86.7 | = | 85.31.1 | = | = | = | 39.9 | 0.96 | ||
| 175-RGS2 | 88.4 | = | 87.01.4 | = | = | = | 40.5 | 0.92 | ||
| 533-RGS2 | 92.8 | = | 91.51.4 | = | = | = | 42.1 | 0.85 | ||
| 534-RGS2 | 94.4 | = | 1453/1266 | 92.91.4 | = | = | = | 42.6 | 1455/1266 | 0.85 |
| total | 3540/2072 | 2919/2069 | ||||||||
| LETGS | 82.5 | 1.50 | 157/181 | 78.82.0 | 1.560.20 | 271f | 64f | – | 157/181 | 0.99 |
All errors are given for a 90% confidence level. Parameters fixed in the fit are marked by “f”
behind the value.
(1) Standard XSPEC names for the model components.
(2) For MOS and RGS spectra the line EW is calculated from the
extrapolated model because of the restricted line coverage.
(3) Observed flux 0.1–2.4 keV.
(4) “=” denotes fit parameter is forced to be the same for all spectra.
3.2 A problem in the spectral calibration?
Paerels et al. (2001) presented a black-body fit to the EPIC-pn spectrum of RX J0720.4$-$3125 obtained from the observation in May 2000. Residuals around 300 eV were attributed to uncertainties in the filter transmission data. However, the modeling was based on early spectral response calibration data and RX J0720.4$-$3125 was the only XDIN observed with XMM-Newton at that time. In addition to RX J0720.4$-$3125 and RX J1856.4$-$3754 four XDINS are now observed with XMM-Newton, partly several times and different instrumental setup and we have access to all the data. The spectral modeling of the spectra is in progress and revealed significant deviations from a Planckian shape for RBS1223 (H03), RX J0720.4$-$3125 (as presented here) and RX J1605.3+3249 (van Kerkwijk 2004).
The best quality X-ray spectrum of any XDIN was obtained from RX J1856.4$-$3754 with the Chandra LETGS. It is
well described by a Planckian model222As discussed in Burwitz et al. (2003) the broad-band
spectrum of RX J1856.4$-$3754 is even better modeled by a modified black-body spectrum of the form
( is the Planck function). We note that the spectral deviations of RX J0720.4$-$3125 discussed in this paper are found in a relatively narrow energy band in contrast to the smooth wide-band
modification caused by the power-law component which mainly changes the black-body parameters.
and can be used as a calibration reference for the soft
X-ray band. Black-body fits to the EPIC-pn spectrum of RX J1856.4$-$3754, using the same instrument calibration
as for RX J0720.4$-$3125 are fully acceptable, with deviations less than 5% at all energies below
1 keV333See the presentation by M. Kirsch at
http://xmm.vilspa.esa.es/external/xmm_user_support/usersgroup/ 20030331/presentations.shtml.
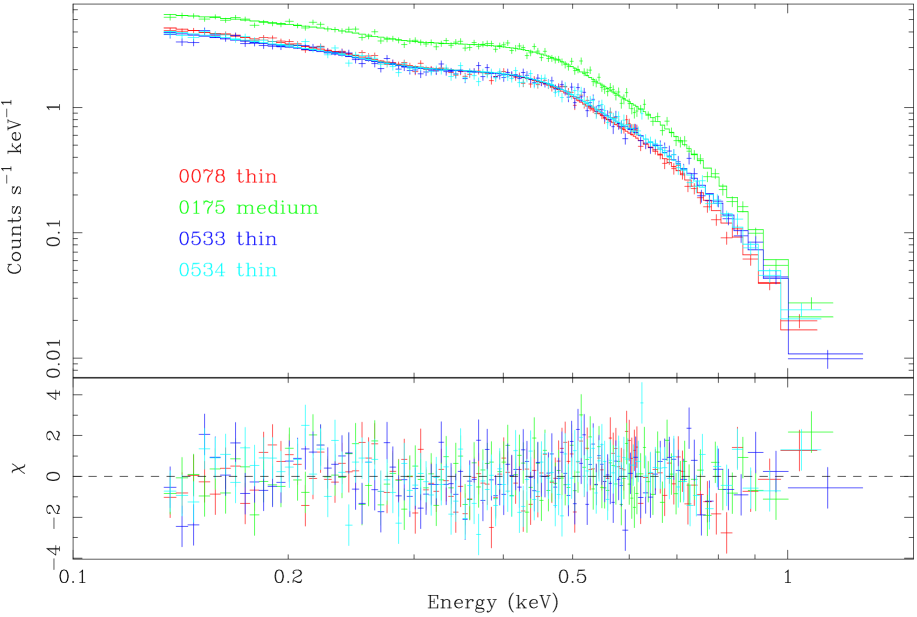
For clarity and better comparison with RX J0720.4$-$3125 we show the EPIC-pn spectrum of RX J1856.4$-$3754 with best black-body fit in Fig. 3.
The residuals in the black-body fit to the spectra of RX J0720.4$-$3125 (Fig. 1)
clearly show a strong systematic behavior,
which is not seen in the case of RX J1856.4$-$3754. Hence, we conclude that the deviations from a Planckian shape
revealed in the EPIC-pn spectra of RX J0720.4$-$3125 are not caused by calibration uncertainties.
In addition, the strength of the observed feature varies with pulse phase (see Sect. 4).

However, as can be seen from Table 2, there are still cross-calibration problems
between the different instruments which cause systematic uncertainties larger than
the statistical errors.
The EPIC-MOS spectra are barely consistent to each other at low energies and there seems to be
a systematic difference between the residuals of the model fit for thin and medium filter
spectra (medium filter spectra better agree with those of EPIC-pn down to 200 eV). We excluded
therefore the MOS data below 300 eV in the spectral analysis. The EPIC-pn spectra are
in large agreement with each other, although those obtained from the last two observations
yield significantly higher black-body temperatures.
These temperature differences are caused by apparent gain variations by up to 3% at
energies below 1 keV which were
measured in emission line spectra of supernova remnants (routine calibration targets to monitor
the energy scale) and the instrumental Oxygen K-edge energy determined from strong sources
with flat continuum spectra444See the presentation by F. Haberl at
ftp://epic3.xra.le.ac.uk/pub/cal-pv/meetings/tuebingen-2003-02.
The origin of this effect is not well understood and can presently not be corrected for. Gain
variations shift the spectral part above 500 eV
which results in the temperature change, while the spectrum below 500 eV, which
determines the NH (and where the deviations from a black-body model are seen),
is practically unaffected (allowing NH to vary in the EPIC-spectra yields
values consistent within the errors). To account for the gain variations we therefore allowed
kT to vary between the spectra.
The somewhat higher flux555Errors on the pn fluxes are 7 erg cm-2 s-1 derived from the
revolution 175 spectrum may be caused by reduced pile-up losses (see Sect. 3.3).
3.3 Pile-up in the EPIC spectra
Bright sources observed with X-ray CCD detectors can be subject to pile-up effects. If the read-out is not sufficiently fast, two or more photons may deposit charge in one or few neighboring CCD pixels during the exposure of a single read-out frame. The energy of the detected event will then be the sum of the energies of the original photons. Therefore pile-up hardens a continuum spectrum. RX J0720.4$-$3125 was observed by the EPIC-pn in full frame mode which provides pile-up free spectra for count rates below 6 cts s-1. As can be seen from the count rates listed in Table 1 the EPIC-pn spectra are somewhat affected by pile-up. This probably explains the residuals in the model fits at energies above 800 eV (Fig. 1). Also the EPIC-pn spectrum obtained with medium filter (which reduces the total count rate) shows the lowest pn-derived black-body temperature and the highest flux (lowest flux losses).
Pile-up occurs predominantly in the center of the point spread function (PSF) where the probability is highest that two photons are recorded in the same pixel within a single read-out frame. The SAS task ‘epatplot’ can be used to visualize the pile-up effects on the spectrum. The main effect on very soft spectra like those of XDINs is a spectral hardening which leads to a somewhat higher black-body temperature and to some flux-loss when using single-pixel events only. In the case of RX J0720.4$-$3125 we excluded the inner area of the PSF with 20″ in radius (15″ for the medium filter observation with lower count rate) to obtain practically pile-up free spectra. The disadvantage of this procedure is in reduction of the number of extracted counts by a factor of 7.3 (4.0 in the medium filter case). The statistics becomes almost insufficient to investigate the deviations from a black-body spectrum and therefore, we fixed the line energy and width at the values derived in Table 2. Table 3 summarizes the black-body model parameters inferred from the pile-up free EPIC-pn spectra. The derived temperatures are typically 3 eV lower than those obtained from the spectra not corrected for pile-up effects. The column density derived for both cases is consistent within the errors. There is again a significant difference in temperature between the first and last two spectra. However, at the current status of the calibration it is not clear if this is a long-term systematic effect.
| Model B: phabs*(bbody+gaussian) | |||||
|---|---|---|---|---|---|
| Obs-Inst. | kT | NH | Eline | /dof | |
| [eV] | [cm-2] | [eV] | [eV] | per inst. | |
| 078-pn | 81.60.9 | 0.900.13 | 271f | 64f | |
| 175-pn | 81.60.9 | = | = | = | |
| 533-pn | 85.21.0 | = | = | = | |
| 534-pn | 84.71.0 | = | = | = | 477/439 |
3.4 Comparison with other instruments
Chandra observed RX J0720.4$-$3125 in February 2000 with the LETGS for a total of 38 ks (observation IDs 368, 369 and 745). The LETGS spectrum was found to be consistent with a black-body model with kT 80 eV and absorption column density 1.7 cm-2 (Pavlov et al. 2002). We re-analyzed these data and obtained kT = 82.54.0 eV and NH = (1.50.5) cm-2 for a single black-body model. To verify that the LETGS spectrum is also consistent with the presence of an absorption feature we added a Gaussian-shaped line, with parameters as derived from the XMM-Newton spectra, to the black-body model. The fit results for both models, with and without line, are listed in Table 2. The statistical quality of the LETGS spectrum is clearly insufficient to discriminate between the models (Fig. 5). The column density inferred from the combined fit to the XMM-Newton spectra is significantly lower than the LETGS value. Allowing individual values of NH for the three XMM-Newton instruments (all other parameters in model B are treated as described in Table 2) results in NH/ cm-2 = 1.230.07, 0.660.30 and 0.730.30 for EPIC-pn, -MOS and RGS, respectively, revealing still cross-calibration uncertainties. The EPIC-pn value is in best agreement with the LETGS value which is probably because the LETGS spectrum of RX J1856.4$-$3754 was used for calibration of the low-energy spectral response of EPIC-pn.


4 Pulse-phase variations
Because of the highest sensitivity, better time resolution (Table 1) and full line coverage we investigate only EPIC-pn spectra in our pulse-phase spectroscopic study. In the 0.12-1.2 keV energy band the pulse profile of RX J0720.4$-$3125 is nearly sinusoidal. We fitted a sine wave to the folded light curves obtained from the EPIC-pn data in this band to determine the pulsed fraction. An example is shown in Fig. 6. The pulsed fraction (after background correction) is around 11%. Pulse periods and pulsed fractions inferred from the four EPIC-pn data sets are listed in Table 4. The presented pulse periods are used here to extract the phase-resolved spectra and we refer for a more detailed temporal analysis to Cropper et al. (2004). The smaller pulsed fraction found in the revolution 175 data collected with medium filter (which more strongly absorbs low-energy photons), suggests an energy dependence of the pulse profile. To investigate this further we determined the pulsed fraction as a function of energy as plotted in Fig. 7. We combined the data from the three thin filter observations assuming a period change of 5 s s-1 (Zane et al. 2002) when folding the data. There is an indication that the pulsed fraction is larger below 400 eV compared to that at higher energies. We note here that due to the strong re-distribution at low energies the data points below 400 eV are not statistically independent (as discussed in Sect. 3.1 and demonstrated in panel “e” of Fig. 1). Also, this approach is not sensitive to changes in the folded light curves related to the shape of the pulse profiles. In the next step we therefore regard only two energy bands below and above 400 eV. In Fig. 8 the two light curves are plotted together with their ratio (hardness ratio). A dependence of the hardness ratio on pulse phase was first reported by C01. At energies above 400 eV the pulse peak becomes broader and more flat-topped. This results in a hardness ratio minimum near the intensity maximum and two (asymmetric) hardness ratio maxima at the flanks of the intensity peak. A test for constancy of the hardness ratio yields a reduced value = 4.6 (for 29 degrees of freedom). The corresponding probability that the hardness ratio is constant is extremely low: 2.5.
| Rev. | Pulse | Pulsed(1) |
|---|---|---|
| Period | Fraction | |
| [s] | [%] | |
| 078 | 8.3911165 | 10.50.3 |
| 175 | 8.3912190 | 10.10.4 |
| 533 | 8.3911276 | 11.10.4 |
| 534 | 8.3912461 | 11.10.4 |
(1) 0.12–1.2 keV


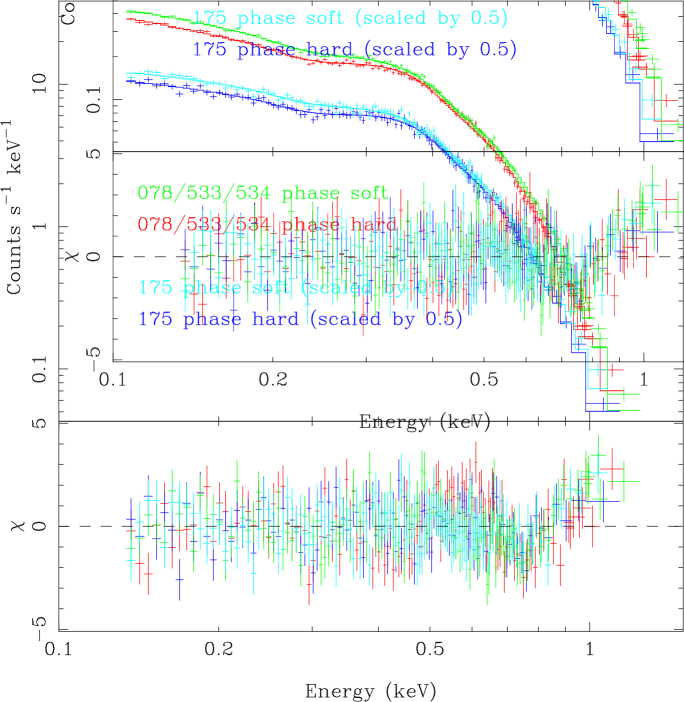
We divided the pulse into four phase intervals of equal length in order to investigate the X-ray spectrum as function of pulse phase. The intervals cover the intensity minimum, the rise, the intensity maximum and the decline of the pulse. The latter phase interval is centered at the hardness ratio maximum derived from the EPIC-pn data. Compared to the approach above, spectral modeling has the advantage that the spectral response (energy resolution, re-distribution) is taken into account. However, for statistical reasons only a small number of phase bins can be investigated. The sixteen phase-selected spectra (from four observational data sets) were fit again simultaneously with the model including an absorption line. Because of the reduced statistics the line width was fixed at 64 eV as obtained from the phase-averaged spectra.
To verify if the hardness ratio variations can be caused by changes in the absorption line parameters we fit the column density simultaneously as a single free parameter to all sixteen spectra. The energy of the line (kept equal for the spectra from the same phase interval) and the black-body temperature (for all spectra) were allowed to be fit individually. The resulting fit parameters are summarized in Table 5. The spectra from “soft” and “hard” phases (as defined in Table 5) are presented in Fig. 5. No significant shift of the line energy between the two phase intervals is seen. The depth of the line varies strongly, which results in an EW during the “soft” phase (around intensity maximum) about a factor of two smaller than that during the “hard” phase (at the end of the declining part of the pulse). At the same time, there is a 2-3 eV increase in the black-body temperature found during the intensity maximum. At this phase the softening due to reduced line absorption dominates the spectral hardening caused by increased temperature and yields the hardness ratio minimum.
To see if the variations in the line depth are really required to account for the spectral changes, we forced the line depth to be a single fit parameter, kept the same for all four phase intervals. This results in a fit with /dof = 2394/1970 in comparison to 2267/1967 with free variation in line depth (Table 5). Comparison of the two models using an F-test yields a probability of 4.3 that the line depth is not variable. Allowing variations in column density NH instead of variable absorption line (depth and energy are constant with phase) yields /dof = 2336/1970 with reduced NH during “soft” phase as was already reported by C01. Also for this case the F-test probability of 9.7 strongly favors the model with variable line depth. Our new results show that the model with phase-dependent absorption line yields the best description of the phase-resolved spectra of RX J0720.4$-$3125.
| Model B: phabs*(bbody+gaussian); /dof = 2267/1967 | |||||
|---|---|---|---|---|---|
| Rev. | kT | NH | Eline | EW | |
| [eV] | [cm-2] | [eV] | [eV] | [eV] | |
| pulse minimum | |||||
| 078 | 83.00.6 | 0.880.10 | 2856 | 64f | -46.13.9 |
| 175 | 82.40.7 | =1(1) | =1 | =1 | -46.03.9 |
| 533 | 86.50.7 | =1 | =1 | =1 | -47.13.9 |
| 534 | 86.20.7 | =1 | =1 | =1 | -47.03.9 |
| pulse rise | |||||
| 078 | 84.20.6 | =1 | 2888 | =1 | -31.64.2 |
| 175 | 83.30.7 | =1 | =5 | =1 | -31.54.2 |
| 533 | 88.00.7 | =1 | =5 | =1 | -32.44.2 |
| 534 | 87.00.7 | =1 | =5 | =1 | -32.24.2 |
| pulse maximum, “soft” phase | |||||
| 078 | 84.20.6 | =1 | 2719 | =1 | -31.14.4 |
| 175 | 83.20.7 | =1 | =9 | =1 | -30.94.4 |
| 533 | 87.20.7 | =1 | =9 | =1 | -31.94.4 |
| 534 | 87.20.7 | =1 | =9 | =1 | -31.94.4 |
| pulse decline, “hard” phase | |||||
| 078 | 82.40.5 | =1 | 2795 | =1 | -57.33.5 |
| 175 | 81.40.6 | =1 | =13 | =1 | -57.03.5 |
| 533 | 84.90.6 | =1 | =13 | =1 | -58.33.5 |
| 534 | 84.90.6 | =1 | =13 | =1 | -58.33.5 |
(1) ”=n” denotes fit parameter is linked with parameter in line n
5 Discussion
From a thorough spectral analysis of four XMM-Newton observations of the isolated neutron star RX J0720.4$-$3125 we find deviations in the spectra from a Planckian shape, similar to those reported by H03 for RBS1223. A model consisting of a black-body continuum attenuated by photo-electric absorption and an absorption line yields acceptable fits to the XMM-Newton spectra and is also consistent with the Chandra LETGS spectrum currently available from RX J0720.4$-$3125. From the pulse-phase averaged spectra we derive a line energy of 271 eV, = 64 eV and EW = 40 eV, for a Gaussian-shaped line. These absolute values may still be subject to systematic uncertainties larger than the statistical errors due to cross-calibration problems of the different instruments used for our analysis, but relative changes of model parameters, e.g. with pulse phase, could be determined to high accuracy.
Hardness ratio variations with the pulse phase from RX J0720.4$-$3125 were already reported by C01, indicating spectral variations. When formally fit with an absorbed black-body model the spectrum near intensity maximum with lower hardness ratio yields a reduced NH compared to phases around hardness ratio maximum. C01 suggested that this could be explained by energy-dependent beaming effects. Alternatively, they discuss variable absorption by matter captured by and rotating with the magnetosphere of the neutron star. Taking into account the absorption line revealed in the phase-averaged spectra we find that the modulation of the hardness ratio with pulse phase can be better explained by variations in the absorption line depth which lead to changes in the line EW by about a factor of two. During pulse rise and at intensity maximum, where we see a hardness ratio minimum, the absorption line is weakest. The black-body temperature varies by 2-3 eV between “hard” and “soft” phase spectra, with the highest temperature during intensity maximum. The resulting hardness ratio minimum shows that the decrease of the absorption line depth is the dominating effect near pulse maximum.
H03 suggested cyclotron resonance absorption as a likely origin for the absorption feature seen in the X-ray spectra of RBS1223. Since charged particles as electrons, protons or ions can be the origin of this absorption one cannot uniquely derive the magnetic field strength from the cyclotron line energy without additional independent information. First estimates for the magnetic field strength of RX J0720.4$-$3125 were inferred from measurements of the spin down rate under the assumption of magnetic dipole braking. Zane et al. (2002) give a magnetic field B G, which would exclude electrons as the origin of the cyclotron line, which is expected at energies around 100 keV for such a strong field. In the case of protons a cyclotron line energy of 271 eV would result in a magnetic field strength of 5.3 G for a neutron star with canonical mass and radius (1.4 M☉, 10 km). Highly ionized atoms of heavy elements have a mass to charge ratio of 2 with respect to protons and would lead to B a factor of 2 higher than that derived for protons. Different ionization states would result in a series of lines with energies differing by only a few percent. Smearing out of these lines due to the B field variations in a rotating dipole field may cause a single broad absorption feature, broader than that expected from the B field smearing (Zavlin et al. 1995; Zane et al. 2001) of a single line and hardly resolvable. In a most recent re-analysis of the available archival and new XMM-Newton data of RX J0720.4$-$3125 Cropper et al. (2004) constrain B to (2.8 - 4.2) G from the pulse period history by interpreting the spin-down rate in terms of magnetic dipole radiation losses. This result is most compatible with the cyclotron line scenario involving protons.
An alternative possibility for the origin of the absorption line is atomic bound-bound transitions. In strong magnetic fields atomic orbitals are distorted into a cylindrical shape and the electron energy levels are similar to Landau states, with binding energies of atoms significantly increased. E.g. for hydrogen in a magnetic field of the order of G the strongest atomic transition is expected at energy E/eV 75(1+0.13ln(B13))+63B13, with B13 = B/ G (Zavlin & Pavlov 2002). For the line energy found in the spectra of RX J0720.4$-$3125 this would require B 3 G. Atomic line transitions are expected to be less prominent at higher temperatures because of a higher ionization degree (Zavlin & Pavlov 2002). Qualitatively, this is in line with the observed anti-correlation between temperature and equivalent width (see Fig. 10). However, the observed effect is much too strong: a temperature change of 2 eV at a temperature of 83 eV would not cause a change of the number of ionization states by a factor of two. In RBS 1223 the effect is even stronger as it shows an EW of –150 eV at similar temperature. At the same time in this source the pulsed fraction is much larger than in RX J0720.4$-$3125 suggesting that the change of angles between the magnetic axis and the line of sight is much larger. We conclude that the anti-correlation between temperature and equivalent width does not reflect a direct physical connection, but is due to the fact that both correlating quantities are depending on the pulse phase.

Therefore, we prefer the interpretation of the observed line feature in terms of the proton cyclotron resonance. The observed dependence of temperature and equivalent width on pulse phase may be due to the change in the viewing geometry of the inclined magnetic rotator. However, a thorough quantitative modeling of cyclotron and atomic bound-bound absorption effects in strong magnetic fields (a few G) of isolated neutron stars and their observable rotational phase dependences is required to understand the behavior in detail.
Acknowledgements.
The XMM-Newton project is supported by the Bundesministerium für Bildung und Forschung / Deutsches Zentrum für Luft- und Raumfahrt (BMBF / DLR), the Max-Planck-Gesellschaft and the Heidenhain-Stiftung. We thank the anonymous referee for valuable comments which helped to improve the paper.References
- Aschenbach et al. (2000) Aschenbach, B., Briel, U. G., Haberl, F., et al. 2000, in Proc. SPIE, X-Ray Optics, Instruments, and Missions III, Joachim E. Trümper; Bernd Aschenbach; Eds., Vol. 4012, 731
- Burwitz et al. (2003) Burwitz, V., Haberl, F., Neuhäuser, R., et al. 2003, A&A, 399, 1109
- Burwitz et al. (2001) Burwitz, V., Zavlin, V. E., Neuhäuser, R., Predehl, P., Trümper, J., & Brinkman, A. C. 2001, A&A, 379, L35
- Cropper et al. (2001) Cropper, M., Zane, S., Ramsay, G., Haberl, F., & Motch, C. 2001, A&A, 365, L302
- Cropper et al. (2004) Cropper, M., Haberl, F., Zane, S., & Zavlin, V. E. 2004, MNRAS, in press, astro-ph/0403380
- den Herder et al. (2001) den Herder, J. W., Brinkman, A. C., Kahn, S. M., et al. 2001, A&A, 365, L7
- Haberl (2003) Haberl, F. 2003, in High Energy Studies of Supernova Remnants and Neutron Stars, Eds. W. Becker and W. Hermsen, COSPAR Symposium, Houston 2002, in press
- Haberl et al. (1997) Haberl, F., Motch, C., Buckley, D. A. H., Zickgraf, F. J., & Pietsch, W. 1997, A&A, 326, 662
- Haberl et al. (2003) Haberl, F., Schwope, A. D., Hambaryan, V., Hasinger, G., & Motch, C. 2003, A&A, 403, L19
- Jansen et al. (2001) Jansen, F., Lumb, D., Altieri, B., et al. 2001, A&A, 365, L1
- Johnston (2003) Johnston, S. 2003, MNRAS, 340, L43
- Kaplan et al. (2003) Kaplan, D. L., van Kerkwijk, M. H., Marshall, H. L., et al. 2003, ApJ, 590, 1008
- Kulkarni & van Kerkwijk (1998) Kulkarni, S. R. & van Kerkwijk, M. H. 1998, ApJ, 507, L49
- Motch & Haberl (1998) Motch, C. & Haberl, F. 1998, A&A, 333, L59
- Motch et al. (2003) Motch, C., Zavlin, V. E., & Haberl, F. 2003, A&A, 408, 323
- Paerels et al. (2001) Paerels, F., Mori, K., Motch, C., et al. 2001, A&A, 365, L298
- Pavlov et al. (2002) Pavlov, G. G., Zavlin, V. E., & Sanwal, D. 2002, in Neutron Stars, Pulsars, and Supernova Remnants, Eds. W. Becker, H. Lesch and J. Trümper, MPE-Report 278, 273
- Pons et al. (2002) Pons, J. A., Walter, F. M., Lattimer, J. M., et al. 2002, ApJ, 564, 981
- Strüder et al. (2001) Strüder, L., Briel, U., Dennerl, K., et al. 2001, A&A, 365, L18
- Turner et al. (2001) Turner, M. J. L., Abbey, A., Arnaud, M., et al. 2001, A&A, 365, L27
- van Kerkwijk (2004) van Kerkwijk, M. H. 2004, in Young Neutron Stars and Their Environments, Eds. F. Camilo and B. M. Gaensler, IAU Symposium, Vol. 218, in press, astro-ph/0310389
- Zane et al. (2002) Zane, S., Haberl, F., Cropper, M., et al. 2002, MNRAS, 334, 345
- Zane et al. (2001) Zane, S., Turolla, R., Stella, L., & Treves, A. 2001, ApJ, 560, 384
- Zavlin & Pavlov (2002) Zavlin, V. E. & Pavlov, G. G. 2002, in Neutron Stars, Pulsars, and Supernova Remnants, Eds. W. Becker, H. Lesch and J. Trümper, MPE-Report 278, 263
- Zavlin et al. (1995) Zavlin, V. E., Pavlov, G. G., Shibanov, Y. A., & Ventura, J. 1995, A&A, 297, 441