Rotation of Jets from Young Stars:
New Clues from the Hubble Space Telescope
Imaging
Spectrograph 111Based on observations made with the NASA/ESA
,
obtained at the Space Telescope Science Institute, which is operated by the Association of
Universities for Research in
Astronomy, Inc., under NASA contract NAS5-26555.
Abstract
We report findings from the first set of data in a current survey to establish conclusively whether jets from young stars rotate. We observed the bi-polar jets from the T Tauri stars TH28 and RW Aur, and the blue-shifted jet from T Tauri star LkH321, using the Hubble Space Telescope Imaging Spectrograph (HST/STIS). Forbidden emission lines (FELs) show distinct and systematic velocity asymmetries of 10 – 25 ( 5) km s-1 at a distance of 0.3 from the source, representing a (projected) distance of 40 AU along the jet in the case of RW Aur, 50 AU for TH28, and 165 AU in the case of LkH321. These velocity asymmetries are interpreted as rotation in the initial portion of the jet where it is accelerated and collimated. For the bi-polar jets, both lobes appear to rotate in the same direction. Values obtained were in agreement with the predictions of MHD disk-wind models Bacciotti et al. (2002); Anderson et al. (2003); Dougados et al. (2003); Pesenti et al. (2003). Finally, we determine, from derived toroidal and poloidal velocities, values for the distance from the central axis of the footpoint for the jet’s low velocity component of 0.5 - 2 AU, consistent with the models of magneto-centrifugal launching Anderson et al. (2003).
1 Introduction
A key question in star formation research concerns the mechanisms behind the launch of jets from young stars. These jets are believed to play an important role in the removal of excess angular momentum from the system, thus allowing accretion of matter onto the star up to its final mass. It is generally acknowledged that magneto-centrifugal forces are responsible for jet launching. In particular in the so-called ‘disk-wind’ model (e.g. Ferreira, 1997; Königl & Pudritz, 2000) the jet is launched from the disk surface within a few AU from the star; while in the ’X-wind’ model Shu et al. (2000) the base of the flow is located at a few stellar radii from the source. To date, resolution constraints on observations have impeded progress in validating the magneto-centrifugal mechanism, since jet launching occurs on small scales (i.e. less than 20 AU from the star); moreover, infall and outflow kinematics are complex and confused close to the source, that is often heavily embedded. Recently, however, interesting results have been obtained from observations of jets from more evolved, less embedded T Tauri stars (TTSs) for which the jet can be optically traced back to its origin.
Observational backing for canonical models would require, for example, proof of rotation around the symmetry axis, close to the base where the jet is launched. The first hint of jet rotation was reported for the HH 212 system Davis et al. (2000). However the knots were located at 2103 - 104 AU from the jet source. Independently, asymmetries in velocities within the first 110 AU of the outflow from the T Tauri star DG Tau were found (Bacciotti et al., 2002), indicative of rotation. These results were obtained through an analysis of high angular resolution spectra taken with the Hubble Space Telescope Imaging Spectrograph (HST/STIS), aimed at probing the acceleration and collimation region of a stellar jet. Further confirmation of the rotation hypothesis came from Owens Valley Radio Observatory (OVRO) observations, which report the sense of rotation of the disk of DG Tau to be the same as that of the jet Testi et al. (2002). Moreover, the derived toroidal velocities in the observed portion of the jet were seen to be in agreement with the predictions of the magneto-centrifugal models, and indeed they can be used to find the location on the disk plane of the launching point of the wind (Bacciotti et al., 2002; Anderson et al., 2003; Dougados et al., 2003; Pesenti et al., 2003).
These results motivated us to conduct an optical STIS survey to establish conclusively whether jets from young stars rotate. We report findings for another three sources (of eight in the survey sample) for which the data have already been acquired, i.e. the bi-polar jets from the TTSs TH28 and RW Aur, and the blue-shifted jet from LkH321.
| Star | Location | Distance | Associated | Mstar | ijet | Ṁdisk | Ṁjet | Ṗjet | References |
|---|---|---|---|---|---|---|---|---|---|
| (pc) | Outflow | (M⊙) | (deg) | (M⊙yr-1) | (M⊙yr-1) | (M⊙ yr-1 kms-1) | |||
| TH28 | Lupus 3 | 170 | HH228 | … | 10 | … | 3.410-8 | 7.510-6 | 1, 2 |
| RW Aur | Auriga | 140 | HH229 | 1 | 44 | 10-6 | 1.110-7 | 3.810-5 | 3, 4 |
| LkH321 | Cygnus | 550 | HH421 | … | … | … | … | … | 5 |
2 Observations
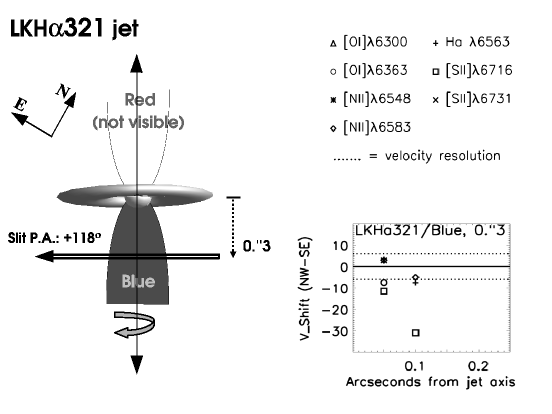
Observations were made of the jets associated with TH28, LkH321 and RW Aur using HST/STIS on June 22, August 20, and October 3, 2002 respectively (proposal ID 9435). An aperture of 52 0.1 arcsec2 was used with the G750M grating which gave a spectral sampling of 0.554 Å pixel-1, corresponding to a radial velocity of 25 km s-1 for the wavelength range covered. The angular sampling was 0.05 pixel-1. An acquisition of the stellar peak intensity prior to science observations allowed the slit to be centered accurately on the star before being offset to a position perpendicular to the jet axis at 0.3 from the source. We assume inclination angles (w.r.t. the plane of the sky) of 10 for TH28 Krautter (1986), 44 for RW Aur López-Martín et al. (2003), and 45 for LkH321 (arbitrary, since unknown, although it may have a large inclination angle from spectro-astrometric measurements Whelan et al. (2003)). The offset of 0.3 then represents a deprojected distance of 51, 195 and 233 AU along the jet for TH28, RW Aur, and LkH321, respectively. The only exception was in the case of the RW Aur blue-shifted jet lobe where the slit was placed at 0.2 due to lack of line emission at 0.3 Woitas et al. (2002). Spectra were obtained of the blue- and red-shifted lobes, using exposure times of 2200 and 2700 seconds respectively, for the bi-polar jets associated with TH28 and RW Aur. In the case of LkH321, only the blue-shifted lobe was detectable and so two spectra of this lobe, with exposure times of 2200 and 2700 seconds, were obtained and summed to increase the signal-to-noise of the faint emission lines. In total, this yielded five spectra, in the transverse direction at the base of the jets, which included H and the forbidden emission lines (FELs) [OI]6300,6363, [NII]6548,6583, [SII]6716,6731. Data were calibrated through the standard HST pipeline, subtraction of the reflected stellar continuum was performed, and hot/dark pixels were removed.
3 Results
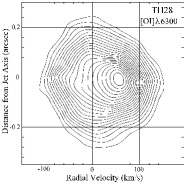
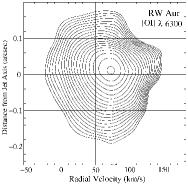
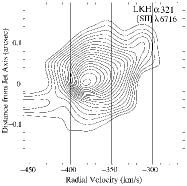
In order to determine whether rotation is present in the jet channel, the difference in velocities on either side of the jet axis was analysed. Position-velocity contour plots for a sample of emission lines are shown in Figure 1, top panels. All radial velocities are systemic, i.e. they are quoted with respect to the mean heliocentric velocity of the star, which has been measured from photospheric lines to be +5 km s-1 for TH28 Graham et al. (1988), +23 km s-1 for RW Aur Woitas et al. (2003) and -7 km s-1 for LkH321 (E. Whelan, priv. comm.). The lower order contours trace the outer jet channel where the jet is not so well collimated and where the lower velocities lie. If rotation is present, there will be a difference in radial velocities between the two sides of the jet. This difference will be evident graphically as a skew in the contours of the transverse position-velocity diagram. Such a skew is indeed observed in all three cases in the outer contour lines. This suggests the presence of rotation in at least the low velocity component (LVC) of the flow near the outer borders of the jet channel. The high velocity component (HVC), which is located much closer to the jet axis and gives rise to the emission peak Bacciotti et al. (2000), appears not to be spatially resolved in our spectra. For this reason we cannot resolve any velocity difference in the HVC between the the two sides of the flow, i.e. we cannot detect rotation for this velocity component.


To give a quantitative estimate of the observed velocity shifts, it was firstly necessary to ensure that we measure velocity offsets at equal distances on either side of the jet axis. To this purpose we assumed that the peak of the (HVC) emission traces the position of the axis, and measured its distance from the nominal center of the slit, with a Gaussian fit along the cross-dispersion direction. We then shifted the line emission re-centering the HVC peak on the nominal zero arcsecond position. In all cases a small offset ( 0.4 pixels) was required, Table 2. The offsets have different sign and magnitude for the three targets, indicating that this is not an instrumental systematic effect. Instead, pixel shift values for emission lines in opposite jet lobes are consistent with a maximum misalignment 2 degrees with respect to the perpendicular of the actual jet axis at sub-arcsecond scales. This resulted in a displacement of the peak intensity of up to 0.02, a quantity which would produce a marginal asymmetry in radial velocity estimated to be at most 20 if uncorrected Bacciotti et al. (2002). This error was, however, avoided as the emission was brought on-axis prior to analysis.
| Jet lobe | Pixel shift applied |
|---|---|
| TH28 red lobe | +0.3672 |
| TH28 blue lobe | -0.3672 |
| RW Aur red lobe | -0.216 |
| RW Aur blue lobe | +0.1728 |
| LkH321 blue lobe | -0.36 |
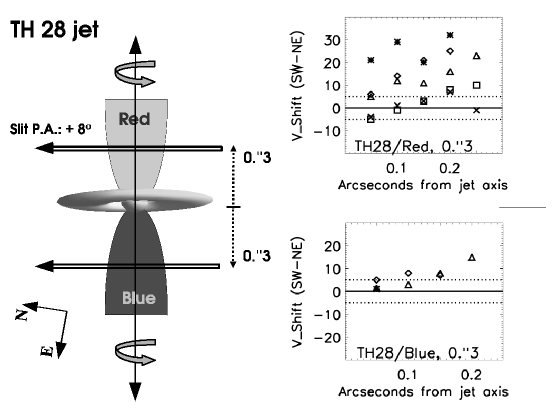
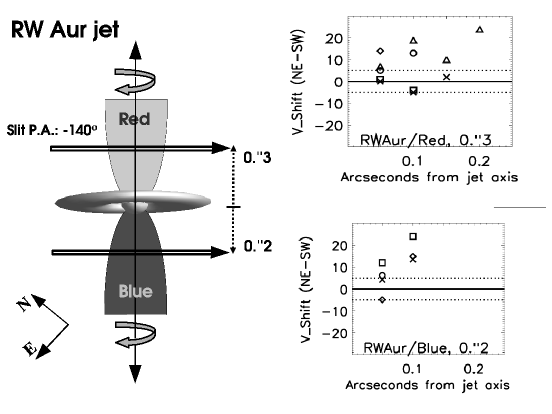
The peak intensities of pixel rows on either side of the central row were then compared for velocity differences, Figure 1, bottom panels. The intensity profiles of each pair of pixel rows symmetric about the jet axis was plotted (e.g. 0.1, or as indicated in each box). The single curve at the bottom in each case is the intensity of the central on-axis pixel row. Two methods were used in velocity measurements: a cross-correlation technique, which analyses the overall displacement of lines and is independent of the shape of the line profile; and a Gaussian fitting technique, which acts as a suitable check given the simple shape of the line profile in most cases. Specifically, each pair of pixel rows, mirrored in distance from the jet axis, was cross-correlated, and Gaussian fits for each pair of rows were also compared. The outcomes of the two methods are consistent, showing clear radial velocity differences of 10 to 25 ( 5) km s-1 for opposing jet edges. Results are listed in Table 3, in which we report the measured radial velocity differences in the direction of the oriented slit, corresponding to a direction specified in the first column of the Table. In a small number of cases, flagged in the table with a symbol, the emission had to be filtered out of a background which was causing velocity measurements to be artifically changed due to either: relatively strong HVC presence; oversubtraction of the background; or low signal-to-noise at crucial positions. The overall results are illustrated graphically in Figures 2 to 4.
| Jet Lobe | Distance | Vrad for | Vrad for | Vrad for | Vrad for | Vrad for | Vradfor | Vrad for |
|---|---|---|---|---|---|---|---|---|
| from jet axis | [OI]6300 | [OI]6363 | [NII]6548 | H6563 | [NII]6583 | [SII]6716 | [SII]6731 | |
| (arcsec) | (km s-1) | (km s-1) | (km s-1) | (km s-1) | (km s-1) | (km s-1) | (km s-1) | |
| TH28, red-shifted | 0.05 | 5 | … | 21∗ | … | 6 | -5 | -4 |
| (SW - NE) | 0.1 | 12 | … | 30∗ | … | 14 | -1 | 1 |
| 0.15 | 11 | … | 30∗ | … | 21 | 3 | 3 | |
| 0.2 | 16 | … | 32∗ | … | 25 | 8 | 7 | |
| 0.25 | 23 | … | … | … | … | 10 | -1 | |
| TH28, blue-shifted | 0.05 | 2∗ | … | 1 | … | 5 | … | … |
| (SW - NE) | 0.1 | 3∗ | … | … | … | 8 | … | … |
| 0.15 | 8 | … | … | … | 7 | … | … | |
| 0.2 | 15 | … | … | … | … | … | … | |
| RW Aur, red-shifted | 0.05 | 7 | 5 | … | … | 14 | 1 | -1 |
| (NE - SW) | 0.1 | 20 | 14 | … | … | … | -4 | -5 |
| 0.15 | 10 | … | … | … | … | … | 2 | |
| 0.2 | 24 | … | … | … | … | … | … | |
| RW Aur, blue-shifted | 0.05 | … | 6∗ | … | … | -5∗ | 12 | 4∗ |
| (NE - SW) | 0.1 | … | … | … | 15∗ | 25 | 14∗ | |
| LkH321, blue-shifted | 0.05 | … | -8∗ | … | 4∗ | 3∗ | -12∗ | 3∗ |
| (NW - SE) | 0.1 | … | … | … | -7∗ | -5∗ | -31∗ | … |
Finally, the radial velocity profile across each jet is shown in Figure 5. In the red-shifted lobes of TH28 and RW Aur, the on-axis radial velocity is clearly the highest and the value reduces as the edges of the jet are approached. The blue-shifted lobes are not so clear as the emission is fainter and often more scattered. Data reduction in these cases often required isolation of the lower velocity component from the HVC (as marked in Table 3) to identify elements of rotation. However radial velocities in this figure include the HVC, and so rotation is not apparent in all cases.
From the results of this spectral analysis, combined with the inclination angles, we find poloidal velocities for the RW Aur jet of 144 - 227 km s-1 in the red lobe and 245 - 288 km s-1 in the blue lobe - this velocity asymmetry is well known from previous observations, Woitas et al. (2002); for TH28 jet of 115 - 288 km s-1 in the red lobe and 230 - 374 km s-1 in the blue lobe - an asymmetry which was also previously recorded, Graham et al. (1988); and for LkH321 of 540 - 550 km s-1. Toroidal velocities derived from the outer positional radial velocity shifts, being less affected by projection effects (see Section 4), are in the ranges of: 7 to 17 km s-1 for both lobes of RW Aur; 5 to 13 km s-1 for the red lobe of TH28; 4 to 8 km s-1 for the blue lobe of TH28; and 4 to 9 km s-1 for the blue lobe of LkH321. (Note that, in the ranges given above, the higher poloidal velocities lie at distances closest to the rotation axis, and these correspond to the lower toroidal and radial velocities.)

4 Discussion
Assuming that emission from the jet is axially symmetric, we interpret our findings of velocity differences between the two sides of the jet flow, Table 3 and Figures 2 to 4, as evidence for rotation at the base of the jet. Most importantly, for TH28 and RW Aur, the red and blue jet lobes were found to rotate in the same direction. This implies that the helicity in the red and blue lobes (i.e. the handedness of toroidal with respect to the poloidal velocity) is opposite in opposite directions, a result predicted by MHD models where the ambient field is wrapped around due to disk rotation.
Before looking at each target individually, there are a few general comments to be made about the results in Table 3. Firstly, the velocity difference measurements close to the jet axis, i.e. at the 0.05 position, are noticeably smaller than points further away, and where the emission is detectable at 0.2 and beyond, velocity differences are higher than at intermediate distances. This effect may at first appear in contradiction with the notion that the central portions of the jet should rotate faster. A detailed comparison with disk-wind model predictions (Pesenti et al., 2003, and Dougados et al., 2003) shows, however, that the apparent decrease of the observed velocity difference toward the jet axis is likely to be due to projection and beam smearing effects. Since the emission is optically thin we see, along the line of sight, the sum of the contributions emitted from regions in the jet that rotate with different toroidal velocities. This causes a reduction of the observed velocity shift. Such an effect is more important for regions closer to the axis, while the values measured at the outer jet borders are less contaminated and so are in better agreement with theoretically predicted toroidal velocities. In other words this effect does not reflect a true kinematic feature, but is expected on the basis of MHD acceleration models when combined with our observational mode. Secondly, it should be noted that the size of velocity differences in different emission lines does not represent scattering around an average value but rather is due to the fact that emission has its origin at different positions along the line of sight. And lastly, the [NII] lines show higher velocity differences than other emission lines, a result that illustrates how they trace the central more collimated higher velocity region of the flow (see Bacciotti et al., 2000, López-Martín et al., 2003, Pesenti et al., 2003).
The results for the TH28 red-shifted jet lobe are clearest. Velocity differences alomg the SW - NE direction are positive, with a few exceptions mainly in the [SII] lines. Also, the data close to the jet axis are not well resolved as explained above. The stronger [OI] and [NII] lines have values of 5 and 6 km s-1 at 0.05 from the axis compared to 10 to 20 km s-1 further from the axis, while the outer jet channel seems to have higher radial velocity differences of about 24 km s-1. Values in the blue-shifted jet lobe are less clear, but [NII] and [OI] emission give positive differences consistent with the red-shifted lobe. All other usable data points fall within the error bars about zero. Globally, we find evidence that both lobes of the jet rotate in a clockwise direction, looking down the blue-shifted jet lobe towards the source, with a measured radial velocity difference of 10 to 25 km s-1.
The RW Aur jet also shows clear indications of rotational velocities. Exceptions include the [SII]6731 values in the red-shifted lobe. Also points close to the jet axis show smaller radial velocity differences due to strong unresolved HVC emission. However, the [OI] lines give clear results with higher radial velocity difference evident at 0.2 from the jet axis. The blue-shifted lobe is less definite, but nevertheless velocity differences outside the error bars are positive in line with the red-shifted lobe. Overall, results show an anti-clockwise rotation looking down the blue-shifted jet lobe towards the source, again with radial velocity differences of 10 to 25 km s-1. These findings are consistent in magnitude and direction with results of similar research on the RW Aur jet Woitas et al. (2003) in which rotational velocities in the same direction of 10 to 20 km s-1 have been observed, in the form of velocity differences between the borders of the flow. For this study HST/STIS was also used, but the spectra were taken in a set of positions across the jet with the slit direction parallel to the jet axis.
In the case of LkH321, which is located at 550 pc (more than three times the distance of the other targets) the emission lines were very faint despite having combined two spectra to increase the signal-to-noise ratio. Nevertheless, velocity differences in the range of -5 to -30 km s-1 have been measured, although evidence of rotation is weaker in this case. The sense of rotation for LkH321 is measured as anti-clockwise looking down the blue-shifted lobe towards the star. In this jet we are able to measure rotation at higher velocities because of a number of factors: LkH321 is farther away meaning we are looking further along the jet (233 AU from the source, projected distance) to a point where it has widened and so we can resolve higher velocities; a large inclination angle (which appears to be the case from spectro-astrometric measurements Whelan et al. (2003)) would mean that the poloidal and radial velocities approach each other; and finally this is a larger mass T Tauri star, since it has spectral type G1 Chavarría-K. et al. (1981), implying higher velocities in the outer resolvable regions of the jet.
It is reassuring that we obtain negative shifts in the case of LkH321, as opposed to the positive shifts observed for the other two sources because, as we are comparing the same rows on the CCD detector in all cases, it means we are not measuring an instrumental effect. Conceiveably, a slight misalignment of the slit with respect to the transverse direction of the jet (i.e inaccurate position angle used in the pointing of the instrument) may produce an effect similar to rotation. In this case, the position of the real jet axis will then be shifted with respect to the nominal zero arcsec position. We have shifted the spectral image back to the zero arcsec position as previously discussed (Section 3), but the angle subtended remains a problem. It could produce a rotation signature even in a non-rotating jet, since the HVC and LVC are at different spatial locations on the CCD with respect to the zero arcsec row of pixels, implying that we are not probing symmetric regions of the jet with respect to its real axis. Given such a misalignment has occurred, the extent of the contamination does not have, however, a dramatic affect on our results, as can be seen from the fact that the pixel shift requirements for TH28 and LKH321 (Table 2) are in the same direction but the sense of rotation of their jets is opposite. For RW Aur, the same PA was used here for slit positioning as in a previous study Woitas et al. (2003), where it was found that the magnitude of the false rotation signature contamination due to incorrect PA was, at most, 1 - 5 km s-1. However, the sense of the false signature is in fact opposite in direction to that of the jet’s rotation, and so the values we have measured are actually lower limits. Apart from this, the only other obvious effect which could produce a contour skew mimicking rotation is asymmetrical interaction with the local environment on either side of the propagating jet, e.g. asymmetrical mass entrainment leading to asymmetrical poloidal velocities. However such mimicking is unlikely because (apart from the fact that asymmetrical entrainment should also produce enhanced emission at one border of the flow, which is not seen in our spectra) we see the same asymmetry in both the red and blue shifted jet lobes where present, and the magnitudes of the deduced toroidal velocity differences are in the range predicted by theory (as discussed below).
Overall, our observations are in line with the observations of the jet from the T Tauri star DG Tau Bacciotti et al. (2002). In that case, by using simple and general relationships governing the physics of magnetically launched disk winds together with an observationally based estimate of the ratio, , between the mass flux in the jet and the mass flux accreted through the disk ( 0.1), it was demonstrated that the observed velocity differences were in the expected range, Bacciotti et al. (2002); Anderson et al. (2003); Dougados et al. (2003). These values compare well with our results, which therefore support the magneto-centrifugal scenario. Furthermore, our toroidal and poloidal velocities have the same ratio as theoretical predictions Vlahakis et al. (2000), and we can use these velocities, and measured at a distance, , from the rotation axis, to obtain values for the wind-launch region in terms of distance from the rotation axis along the disk plane, . Using Equation 1 Anderson et al. (2003),
| (1) | |||||
and assuming all three sources are of mass M⋆ 1M⊙, which is a reasonable approximation given the weak dependence on M⋆, we obtain values for as shown in Table 4. We have chosen measurements at 0.1 and 0.2 from the jet axis as limits of a suitable range, being less contaminated by projection effects. Where emission was faint, values corresponding to 0”.05 were used, but it should be noted that these are less accurate. Also, the values at 0.1 are less precise than those at 0.2, when both are present, since increased projection effects close to the jet axis tend to reduce the line of sight averaged vϕ,∞, and hence the resulting value of (Pesenti et al 2003). Considering the red-shifted jet-lobes which both have very strong signal-to-noise in [OI] and [NII] emission lines, we calculate a wind-launch region spanning 0.3 to 1.6 AU, in keeping with previous estimates for DG Tau of 1.8 AU Bacciotti et al. (2002) and 0.3 to 4 AU Anderson et al. (2003). The observational evidence presented here supports the idea that disk winds are launched, via the magneto-centrifugal mechanism (e.g. Königl & Pudritz, 2000), at radii within a few AU of the star. Determination of the most appropriate model however will have to await higher spatial and spectral resolution observations in the future.
| Star | Jet lobe | |||||
|---|---|---|---|---|---|---|
| arcsec | AU | km s-1 | km s-1 | AU | ||
| TH28 | Red-shifted | 0.1 - 0.2 | 17 - 34 | 10 - 25 | 30 - 20 | 0.3 - 1.6 |
| Blue-shifted | 0.1 - 0.2 | 17 - 34 | 8 - 15 | 50 - 40 | 0.1 - 0.4 | |
| RW Aur | Red-shifted | 0.1 - 0.2 | 14 - 28 | 10 - 25 | 105 - 100 | 0.4 - 1.3 |
| Blue-shifted | 0.05 - 0.1 | 7 - 14 | 10 - 25 | 180 - 170 | 0.1∗ - 0.4 | |
| LkH321 | Blue-shifted | 0.05 - 0.1 | 27.5 - 55 | 5 - 12 | 390 - 380 | 0.1∗ - 0.2 |
5 Conclusions
The jets from the three young stars observed, TH28, RW Aur and LkH321, show distinct and systematic radial velocity asymmetries in opposing positions with respect to the jet axis, at 0′′.2 - 0′′.3 from the source. Although the on-axis higher velocity component of the jet remains unresolved, radial velocity differences in the lower velocity component located in the outer jet channel are found to be on the order of 10 to 25 (5) km s-1. For the bi-polar jets from TH28 and RW Aur, the velocity differences have the same sign in both lobes. We interpret these radial velocity asymmetries as rotation signatures in the region where the jet has been collimated but has not yet manifestly interacted with the environment. Therefore the sense of rotation of the jets, looking down the blue-shifted lobe towards the star, is clockwise for TH28, and anti-clockwise for RW Aur and LkH321.
Our findings are reinforced in a number of ways: the velocity differences are of the same magnitude as those measured in the similar DG Tau jet of 5 to 10 km s-1 Bacciotti et al. (2002), which was shown to be in agreement with the predictions of MHD disk-wind models Bacciotti et al. (2002); Anderson et al. (2003); Dougados et al. (2003); Pesenti et al. (2003); they are in line with similar research on the RW Aur jet Woitas et al. (2003) which yields rotational velocities of 10 to 20 km s-1, with the same sense of rotation; and finally, they lead to values for the distance of the LVC footpoint from the central axis of 0.5 - 2 AU, consistent with the models of magneto-centrifugal launching Anderson et al. (2003).
Acknowledgements
We wish to thank Marcello Felli, Catherine Dougados, Emma Whelan and Jonathan Ferreira for
useful comments and suggestions. D.C. and T.P.R. would like to acknowledge
support for their research from Enterprise Ireland and J. E. and J. W.
likewise wish to acknowledge support from the Deutsches Zentrum für Luft- und Raumfahrt
under grant
number 50 OR
0009. We would also like to thank the anonymous referee for useful comments.
References
- Anderson et al. (2003) Anderson, J. M., Li, Z.-Y., Krasnopolsky, R. & Blandford, R., 2003, ApJ, 590, L107
- Bacciotti & Eislöffel (1999) Bacciotti, F. & Eislöffel, J., 1999, AA, 342, 717
- Bacciotti et al. (2000) Bacciotti, F., Mundt, R., Ray, T. P., Eislöffel, J., Solf, J. & Camezind, M. 2000, ApJ, 537, L49
- Bacciotti et al. (2002) Bacciotti, F., Ray, T. P., Mundt, R., Eislöffel, J. & J., Solf, 2002, ApJ, 576, 222
- Chavarría-K. et al. (1981) Chavarría-K., C., & de Lara, E., RMxAA, 1981, 6, 159C
- Davis et al. (2000) Davis, C. J., Berndsen, A., Smith M. D., Chrysostomou, A. & Hobson, J., 2000, MNRAS, 314, 241
- Dougados et al. (2003) Dougados, C., Cabrit, S., Ferreira, J., Pesenti, N., Garcia, P. & O’Brien, D., in proc of “Magnetic Fields and Star Formation, theory versus observations”, 2003, AP&SS in press
- Ferreira (1997) Ferreira, J., 1997, A&A, 319, 340
- Graham et al. (1988) Graham, J. A. & Heyer, M. H., 1988, PASP, 100, 1529
- Königl & Pudritz (2000) Königl, A. & Pudritz, R., 2000, in Protostars and Planets IV, V. Mannings, A. P. Boss, S. S. Russell (Tuscon: Univ. Arizona Press), 759
- Krautter (1986) Krautter, J., 1986, AA, 161, 195
- Kwan & Tademaru (1988) Kwan, J. & Tademaru, E., 1988, AJ332L, 41K
- López-Martín et al. (2003) López-Martín, L., Cabrit, S. & Dougados, C., 2003, AA, 405, L1
- Mundt & Eislöffel (1998) Mundt, R. & Eislöffel, J., 1998, AJ116, 860
- Pesenti et al. (2003) Pesenti, N., Dougados, S., Cabrit, S., Ferreira, J., Casse, F., Garcia, P. & O’Brien, D., 2003, AA, submitted
- Shu et al. (2000) Shu, F. H., Najita, J. R., Shang, H. & Li, Z.-Y., 2000, in Protostars and Planets IV, V. Mannings, A. P. Boss, S. S. Russell (Tuscon: Univ. Arizona Press), 789
- Testi et al. (2002) Testi, L., Bacciotti, F., Sargent, A. I., Ray, T. P. & Eislöffel, J., 2002, AA, 394, 31
- Vlahakis et al. (2000) Vlahakis, N., Tsinganos, K., Sauty, C. & Trussoni, E., 2000, MNRAS, 318, 417
- Whelan et al. (2003) Whelan, E. T., Ray, T. P., Davis, C. J. & 2003, AA, submitted
- Woitas et al. (2002) Woitas, J., Ray, T. P., Bacciotti, F., Davis, C. J. & Eislöffel, J., 2002, ApJ, 580, 336
- Woitas et al. (2003) Woitas, J., Bacciotti, F., Ray, T. P., Marconi, A., Coffey, D. & Eislöffel, J., 2003, AA, submitted