The magnetic field structure of SNR G328.4+0.2
from polarimetric
observations at 19 GHz
Abstract
We report on the first polarimetric observations at 19 GHz made with the upgraded Australia Telescope Compact Array. Observations were made of the Galactic supernova remnant (SNR) G328.8+0.2. We find the SNR has circular morphology with a strong central bar, similar to that seen at lower frequencies. The SNR has high linear polarization throughout, with fractional polarization in the bar up to 50 per cent. The orientation of the magnetic field lines follow the filamentary structure of the SNR. The magnetic field at the edge of the SNR is generally toroidal, interspersed with radial fingers, likely caused by Rayleigh-Taylor instabilities. Although the SNR has been identified as Crab-like, we prefer an interpretation in which the bar is a pulsar powered wind nebula with the rest of the SNR consisting of the shell. The proposed pulsar parameters make the SNR / pulsar system more like SNR G11.2–0.3 than the Crab Nebula.
keywords:
supernova remnants: individual : G328.4+0.21 Introduction
Traditionally, supernova remnants (SNRs) have been classified into three main classes, the most numerous of which are the shell SNRs. These are characterised by synchrotron radio emission with a ‘shell’ or ’barrel’ like morphology. Typically, these shell SNRs have spectral indices in the radio of –0.7 (where is defined in the sense that ). However, the presence of an active, energetic young pulsar near the centre of the SNR can give rise to composite SNRs. In addition to the shell, these SNRs have a central component, a synchrotron nebula, which is powered by a young and energetic pulsar. These synchrotron nebulae generally have a rather flat spectral index (0) and a high degree of linear polarization. The third class of SNR, called Crab-like, consist of pulsar powered nebulae without a detectable shell. The Crab Nebula forms the archetype of this class, but there are less than 10 Galactic SNRs with this classification.
SNR G328.4+0.2 was first detected as a radio source in the early 1960s. The most recent radio observations of the SNR were carried out by Gaensler, Dickel & Green (2000). At 1.4 and 4.5 GHz, the SNR has a diameter of 5 arcmin and a rather smooth appearance with evidence for a central bar. Caswell et al. (1975) derived a lower distance limit to the SNR of 17.5 kpc, based on Hi absorption measurements, a value confirmed by Gaensler et al. (2000). The latter authors also showed that the SNR is highly polarized at 4.5 GHz and that the rotation measure is –900 rad m-2. The spectral index of the entire SNR is . Their conclusion was that G328.4+0.2 is an addition to the Crab-like SNR class, i.e. it is a pulsar nebula with no visible shell. By considering the energetics necessary to power the plerion, Gaensler et al. (2000) showed that the central pulsar must have a high spin-down energy, erg s-1, a short period and a relatively low magnetic field strength. SNR G328.4+0.2 was also observed in X-rays with the ASCA satellite by Hughes, Slane and Plucinsky (2000). The SNR was detected in the hard X-ray band but the small angular diameter of the SNR coupled with the large beam of ASCA meant that no detail was observed. The emission appeared to be non-thermal and consistent with other synchrotron emission nebulae.
Observations at high radio frequencies are not affected by differential Faraday rotation and the small synthesized beam also minimises the effects of the tangling of the magnetic field along the line of sight. This is particularly important in SNR G328.4+0.2 where the rotation measure is very high. The Australia Telescope Compact Array (ATCA) has recently been upgraded for operation at frequencies up to 100 GHz. Each of the 22-m antennas has had surface upgrades and, during the past year, all six antennas have been equipped with receivers operating over the frequency range 16 to 24 GHz with receiver temperatures of 20–30 K. The upgrade makes southern SNRs an immediate and compelling target for polarization observations. In this paper we report on observations of SNR G328.4+0.2 at 19 GHz. We derive the intrinsic magnetic field directions and compare with magneto-hydro dynamic (MHD) simulations of SNR evolution. We also speculate on the nature and classification of SNR G328.4+0.2.
2 Observations
Observations of SNR G328.4+0.2 were made with the ATCA, which is an east-west synthesis telescope located near Narrabri, NSW and consists of five 22-m antennas on a 3-km track with a sixth antenna a further 3 km distant. The ATCA can observe at two different frequencies simultaneously and is capable of recording all four Stokes parameters at each frequency.
Our observations were obtained with two different array configurations, 750C and EW367, on 2003 June 17 and August 10. In these configurations, five antennas were arranged to give maximum baseline lengths of 750 m and 367 m respectively and a minimum baseline of 45 m in both cases. Two different frequency bands were recorded, each with two linear polarizations, centered at 18.752 GHz and 18.880 GHz. Each frequency band was 128 MHz wide and contained 32 frequency channels each of width 4 MHz. The central pointing position for SNR G328.4+0.2 was (J2000) = , –53° 17′ 00″. The measured system temperatures were 40–50 K for antenna elevations 40°. Because the primary beam at 18.8 GHz is only 1.8 arcmin and the SNR has a diameter of 5 arcmin, we observed with seven separate pointings in a hexagonal pattern separated by 1.1 arcmin. Each pointing was observed for 60 seconds, the pattern was observed twice before visiting the phase calibrator PKS 1613–586 for 2–3 min, and this entire cycle was repeated for 12 hr in each array configuration. For bandpass calibration we used PKS 1921–293 (June) and PKS 0420–014 (August). The flux density of PKS 1921–293 varies substantially at high frequencies, and we therefore used PKS 1934–638 (flux density 1.15 Jy) as the primary flux calibrator. Table 1 gives the calibrator fluxes we obtained with respect to PKS 1934–638. We also observed the planets Mars and Uranus, deriving scaling factors within 10% of the adopted flux calibration. Reference pointing was carried out every hour during the August observing run using the phase calibrator PKS 1613–586 (flux density 3 Jy). The pointing correction was typically 15″ to 20″ with an rms of 8″.
The data were reduced in the miriad software package using standard procedures. After calibration, the uv-data (excluding the 6 km antenna) were Fourier-transformed using multi-frequency synthesis of both bands and ‘natural’ weighting to produce Stokes , , and mosaiced ‘dirty’ images. We then performed maximum entropy deconvolution of the polarization images using the task pmosmem [Sault, Bock & Duncan 1999]. This task constrains to be positive and simultaneously cleans the , and images. The deconvolved images were restored with a synthesized beam of . An image in linear polarization was computed by adding the and images in quadrature. Polarization vectors were computed when the linearly polarized flux density exceeded 0.3 mJy beam-1 (, where mJy beam-1 was obtained from the Stokes V image), the total flux density was in excess of 1.5 mJy beam-1 and when the error in the vector was less than 10°.
| Date | Source | Flux Density (Jy) | |
|---|---|---|---|
| 18.752 GHz | 18.880 GHz | ||
| 2003 June | 1934–638 | 1.154 | 1.146 |
| 1921–293 | 13.46 | 13.49 | |
| 1613–586 | 3.18 | 3.17 | |
| 1253–055 | 16.16 | 16.19 | |
| 1334–127 | 3.96 | 3.97 | |
| 2003 August | 1934–638 | 1.154 | 1.146 |
| 1921–293 | 13.34 | 13.42 | |
| 1613–586 | 3.25 | 3.25 | |
| 0420–014 | 14.23 | 14.27 | |
3 Results and Discussion
3.1 Images of the SNR
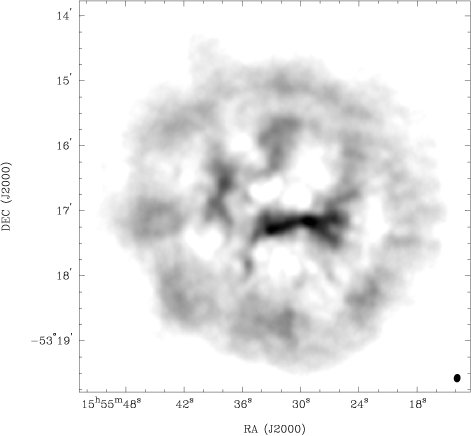
Figure 1 shows the total intensity image of G328.4+0.2. The expected flux density of the SNR at 19 GHz, extrapolating from the Gaensler et al. (2000) values at lower frequencies, is 10 Jy whereas we measure only 4–5 Jy. This is almost certainly because the interferometer is filtering out the emission on scales larger than resolved by our shortest baseline, i.e. 1.6 arcmin.
The SNR is almost perfectly circular with a diameter of 5 arcmin. The extent of the SNR is identical to that seen at lower radio frequencies. The 19 GHz image has a more mottled appearance than at low frequencies but this is caused by the lack of short spacings in the high frequency image. Spatial filtering of the low frequency image presented in Gaensler et al. (2000) results in an image that is virtually identical to the one shown here, including the filamentary structure. As seen in Figure 1, the central bar is clearly delineated and has an extent of 72 pc (assuming a distance of 17 kpc). It runs east-west and is slightly offset to the south from the geometric centre of the SNR. The circular morphology and the enhanced emission from the interior is similar to that of G11.2–0.3 [Green et al. 1988].
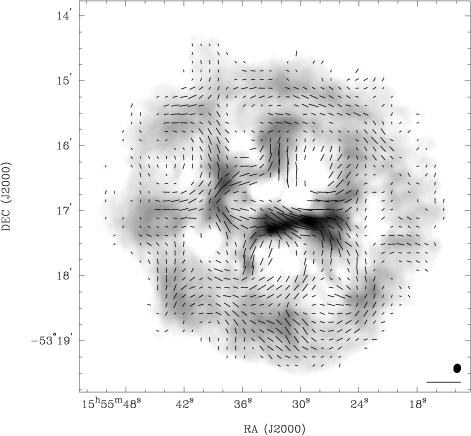
The SNR is highly polarized throughout, with fractional polarization of up to 50 per cent in many regions. At this frequency, depolarization due to either high rotation measures across the band or large variations in the rotation measure from the back to the front of the SNR are unimportant and hence the polarization that we observe is significantly higher than at lower frequencies. Furthermore, even the high rotation measure of 1000 rad m-2 (Gaensler et al. 2000) imposes a turn of only 10° on the position angle of the polarized radiation giving us confidence about the derived magnetic field vectors. Figure 2 shows the total intensity overlaid with vectors showing the direction of the magnetic field. The magnetic field clearly follows the direction of the filamentary structures in the SNR, with the twists and turns showing equally well in both total intensity and magnetic field direction. At the boundary between the SNR and the ambient medium, the magnetic field is clearly toroidal (especially in the north) with evidence of radial structure, e.g. in the south-east, where the remnant departs from its circular appearance. We note that we are not sensitive to the large scale magnetic field structure (if it exists) due to the lack of short spacings in the image but we can be confident in the magnetic field vectors tracing the small scale structures.
3.2 The bar in G328.4+0.2
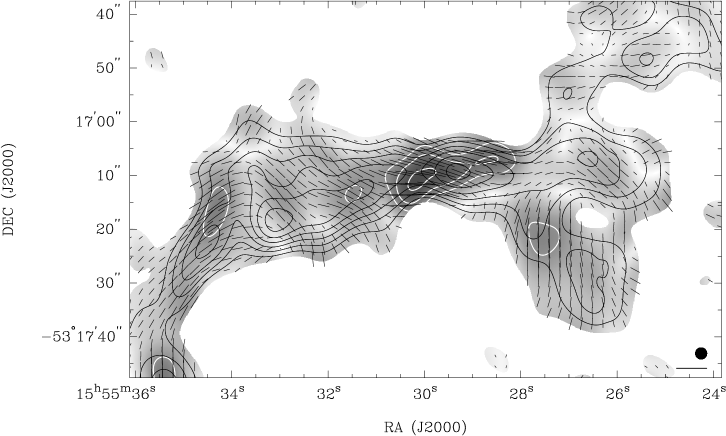
Fig. 3 shows an enlarged view of the central bar at a resolution of 2″. The region with the highest linearly polarized intensity is at the centre of the bar and offset to the east from the peak in total intensity. The magnetic field runs parallel to the major axis of the bar except where it appears to be crossed by a foreground filament. The bar shows signs of bifurcation, especially in the west. The nature of the bar, in size, morphology and magnetic field orientation is remarkably similar to the bar in the composite SNR G326.3–1.8 [Dickel, Milne & Strom 2000]. In that SNR, the bar is also elongated, shows signs of bifurcation at the ends and has a magnetic field which runs parallel to the major axis. If one assumes that a pulsar is located in the centre of the bar and that it originated in the centre of the SNR at the time of the explosion then in both SNR G328.4+0.2 and SNR G326.3–1.8 the orientation of the major axis of the bar is perpendicular to the inferred velocity vector of the pulsar. A second example of a plerion with a similar structure is SNR 3C58. Although that SNR shows no shell, the plerion again has a similar size, morphology [Bietenholz, Kassim & Weiler 2001, Reynolds & Aller 1988] and polarization [Wilson & Weiler 1976] to SNR G328.4+0.2.
3.3 Magnetic field structure
Observationally, young SNRs such as Tycho and Kepler show radial magnetic fields [Milne 1987]. In older SNRs, the structure tends to be more patchy, but toroidal fields seem more to be the norm. Gull (1973) first proposed that the radial fields were the results of Rayleigh-Taylor instabilities forming at the interface between the expanding shell and the ambient medium. Jun & Norman (1996) carried out MHD simulations of expanding SNR shells and showed that the generally toroidal field around the outer shell would be broken by radial ‘fingers’ caused by Rayleigh-Taylor instabilities. Although their simulation deals with young SNRs, their results are very similar to the structure of the magnetic field at the outer edges of SNR G328.4+0.2. The magnetic field appears to be toroidal around the rim of the SNR (especially in the north and west). In the south-west there is some indication of radial protusions poking through the rim.
Within the SNR, we see a frothy, bubble-like structure with the magnetic fields tracing the total intensity in the filaments surrounding the bubbles. This is common in SNRs: in Vela, for example, the magnetic field structure is highly correlated with the filamentary structure [Milne 1995].
MHD simulations of the evolution of a pulsar wind nebula have most recently been performed by van der Swaluw (2003). He suggests that PWN should be elongated, with axial ratios of 2:1, and that the magnetic field should run along the bar. Again, he deals mainly with young SNRs, but the parallels with SNR G328.4+0.2 are clear. The axial ratio of the bar is somewhat larger than 2:1 but the magnetic field does indeed run along the major axis. Van der Swaluw (2003) also speculates that if the reverse shock has had time to ‘crush’ the pulsar wind nebula, this would tend to increase the axial ratio in the bar. It may be that in SNR G328.4+0.2 the reverse shock is already interacting with the bar.
3.4 Nature of the SNR and central pulsar
Gaensler et al. (2000) put forward some convincing arguments for classifying the entire observable structure as a plerion, or Crab-like SNR. However, the size and luminosity of G328.4+0.2 are both considerably larger than the Crab, and the inferred properties of the pulsar would make it the most energetic known.
We propose an alternative, equally plausible explanation which removes the energetics problem. In our explanation, the central bar structure is the pulsar wind nebula and the rest of the SNR is the conventional synchrotron emitting shock between the ejecta and the interstellar medium. G328.4+0.2 would then be a composite SNR, with properties more akin to G11.2–0.3 than the Crab. Assuming a distance to the SNR of 17 kpc, the diameter of the SNR is 25 pc and the extent of the bar is about 2 pc. The flux density in the bar is only about one tenth of the entire SNR (as obtained from the Gaensler et al. (2000) image). Following the same line of reasoning as in Gaensler et al. (2000) we determine the spin-down energy of the putative pulsar to be only erg s-1 and an age for the SNR of 10 kyr. This immediately removes the energetics problem and implies that the pulsar has a current spin period of 50 ms and a standard magnetic field strength of G. These parameters are very similar to those of the pulsars in G11.2–0.3 ( ms, G; Torii et al. 1999) and 3C58 ( ms, G; Murray et al. 2002). Indeed the radio structure of G11.2–0.3 [Green et al. 1988, Tam, Roberts & Kaspi 2002] and G328.4+0.2 are also similar, with a central asymmetric pulsar wind nebula surrounded by a ‘filled-in’ shell structure. In the case of G11.2–0.3 however, the wind nebula is much more prominent in X-rays than in the radio. In both G11.2–0.3 and 3C58, the pulsar is located at the centre of the pulsar wind nebula rather than at one edge. We surmise that the situation is likely similar in G328.4+0.2. The geometric centre of the SNR is offset from the centre of the bar structure which would require a pulsar of age 10 kyr to have a velocity of 300 km s-1, well within the range of known pulsar velocities.
4 Summary
Interferometric observations of SNR G328.4+0.2 at 19 GHz have been obtained with the ATCA. They show a highly polarized, circular SNR with a strong central bar. The magnetic field lines are mostly toroidal at the edge of the SNR and run parallel to the major axis of the bar. We propose that this SNR is a composite remnant rather than a Crab-like remnant as proposed by Gaensler et al. (2000) and there are strong parallels between this SNR, G326.3–1.8 and G11.2–0.3. High resolution X-ray observations are needed on this SNR. Non-thermal emission is likely to be seen from the bar, but presumably with a smaller extent due to the reduced synchrotron lifetimes in the X-ray. This will give a clear indication of the current location of the pulsar, which we believe should be at the centre of the bar. With luck, the pulsar itself may be detected through its pulsations as was the case in 3C58.
Acknowledgments
We acknowledge the excellence and the dedication of the members of the Receiver Group of the ATNF. The Australia Telescope is funded by the Commonwealth of Australia for operation as a National Facility managed by the CSIRO. We thank Bryan Gaensler for providing his images and comments which helped improve the text.
References
- [Bietenholz, Kassim & Weiler 2001] Bietenholz M. F., Kassim N. E., Weiler K. W., 2001, ApJ, 560, 772
- [Caswell et al. 1975] Caswell J. L., Murray J. D., Roger R. S., Cole D. J., Cooke D. J., 1975, AA, 45, 239
- [Dickel, Milne & Strom 2000] Dickel J. R., Milne D. K., Strom R. G., 2000, ApJ, 543, 840
- [Gaensler, Dickel & Green 2000] Gaensler B. M., Dickel J. R., Green A. J., 2000, ApJ, 542, 380
- [Green et al. 1988] Green D. A., Gull S. F., Tan S. M., Simon A. J. B., 1988, MNRAS, 231, 735
- [Gull 1973] Gull S. F., 1973, MNRAS, 161, 47
- [Hughes, Slane & Plucinsky 2000] Hughes J. P., Slane P. O., Plucinsky P., 2000, ApJ, 542, 386
- [Jun & Norman 1996] Jun B.-I., Norman M. L., 1996, ApJ, 472, 245
- [Milne 1987] Milne D. K., 1987, Australian Journal of Physics, 40, 771
- [Milne 1995] Milne D. K., 1995, MNRAS, 277, 1435
- [Murray et al. 2002] Murray S. S., Slane P. O., Seward F. D., Ransom S. M., Gaensler B. M., 2002, ApJ, 568, 226
- [Reynolds & Aller 1988] Reynolds S. P., Aller H. D., 1988, ApJ, 327, 845
- [Sault, Bock & Duncan 1999] Sault R. J., Bock D. C.-J., Duncan A. R., 1999, A&AS, 139, 387
- [Tam, Roberts & Kaspi 2002] Tam C., Roberts M. S. E., Kaspi V. M., 2002, ApJ, 572, 202
- [Torii et al. 1999] Torii K., Tsunemi H., Dotani T., Mitsuda K., Kawai N., Kinugasa K., Saito Y., Shibata S., 1999, ApJ, 523, L69
- [van der Swaluw 2003] van der Swaluw E., 2003, AA, 404, 939
- [Wilson & Weiler 1976] Wilson A. S., Weiler K. W., 1976, AA, 49, 357