Modelling galactic spectra: II - Simultaneous study of stellar dynamics and stellar mix in NGC 3258††thanks: Based on observations obtained at the European Southtern Observatory, La Silla, Chile (Programmes Nr. 62.N-0492, 64.N-0192)
Abstract
In this paper we adopt a method to analyse absorption line spectra from elliptical galaxies that determines the dynamics of the galaxy and at the same time offers a way to study the stellar populations in that galaxy by a direct fit to the spectra. The result of the modelling is a distribution function for each stellar population that is considered in the fit. The method is described in detail in an accompanying paper (De Bruyne et al., 2003a).
This paper reports on a dynamical stellar population study in NGC 3258, based on spectra in two different wavelength regions, the near-IR Ca II triplet around 8600 Å and the Ca H and K lines around 3900 Å. These absorption lines have discriminating power toward various stellar types.
The dynamical model shows an increase in dwarfs (represented by G2V stars) toward the centre. Most of the rotation in the model is delivered by the giants (represented by M1III stars). Moreover, the different models that were considered indicate that establishing a potential for a galaxy is dependent on the wavelength range used for the modelling.
keywords:
methods: numerical - methods: statistical - galaxies: kinematics and dynamics - galaxies: elliptical and lenticular, cD - galaxies: individual (NGC 3258) - galaxies: structure1 Introduction
Elliptical galaxies are no longer seen as simple isothermal objects that follow a de Vaucouleurs-law and that are chemically well mixed. Color gradients indicating that elliptical galaxy centres have redder colours than the outer regions (e.g. Michard (2000), Peletier et al. (1990a), Peletier et al. (1990b)), and variations in line strengths (see Kobayashi & Arimoto (1999) and references therein) can be interpreted in terms of a metallicity or an age gradient (Worthey, 1994). Moreover, spectroscopic studies revealed that a considerable number of early-type galaxies have a kinematically distinct core, that may have a separate stellar population (Bertola et al., (1996), Surma & Bender (1995), Mehlert et al. (1998), De Rijcke et al., (2003)).
Current stellar population modelling techniques for elliptical galaxies explicitly take an evolution scenario into account. Most of them use theoretically calculated isochrones and a library of theoretical or observed stellar spectra. A number of frequently used techniques are:
-
•
Evolutionary synthesis models (Bruzual & Charlot, (1993), Worthey (1994), Bressan et al., (1994)) : these models predict the spectral evolution of a stellar population, based on computed isochrones (i.e. the positions of the stars of a single-age, single-metallicity population in a color-magnitude diagram at a given instant). In such a single-burst population, the distribution of the stars over mass is given by the initial-mass function (IMF). The spectral properties of a population in which stars have formed over an extended period of time according to some star-formation rate, can be calculated as convolution integrals of the corresponding properties of the single-burst populations. Hence the need for a large library of observed or computed spectra of stars of various ages, masses and metallicities.
-
•
Chemo-evolutionary models (Bressan et al., (1994), Vazdekis et al. (1996), Vazdekis (1999)) : these models are similar to the previous ones except that a physical basis is provided for the star-formation rate. The evolution of a galaxy is followed starting from a uniform gas cloud in which stars form at a rate given by the Schmidt law which assumes the star-formation rate to be proportional to the gas fraction. Both the evolutionary synthesis models and the chemo-evolutionary models assume elliptical galaxies to be homogeneous at all times so that they cannot describe metallicity gradients.
-
•
Chemo-dynamical models (Berczik, (1999), Theis et al. (1992)) : these sophisticated models use a Smoothed Particle Hydrodynamics (SPH) code to describe the dynamics of the gaseous phase in a galaxy. Within this framework, star formation, energy feedback and chemical enrichment can be incorporated, providing a realistic description of the chemical and dynamical evolution of galaxies. As the assumption of homogeneity is relaxed, metallicity gradients can be studied.
The models mentioned above produce colors and absorption line indices. Despite the fact that it is hard to overcome the age-metallicity degeneracy when disentangling the integrated galaxy light into separate stellar populations, it seems that elliptical galaxies can be well represented by a single-age, single-metallicity model (e.g. Bruzual & Charlot, (1993), Worthey (1994), Vazdekis et al. (1996)). This suggests that most of the stars in these early-type galaxies were formed in a single burst, long ago. More recently Trager et al. (2000a) and Trager et al. (2000b) presented data and models for the centers of elliptical galaxies and found a wide range of stellar population parameters. Moreover, their best fitting models implied adding a younger stellar population to an underlying old population.
On the other hand, the calculation of line widths, needed for comparison between observations and population synthesis models, suffers from the fact that the internal velocity dispersion results in a broadening of the spectral lines. This affects both the continuum and the lines, and at high velocity dispersion cause the absorption-line indices to appear weaker than they really are. This results in a decrease of the measured equivalent widths. Therefore, some sort of velocity dispersion correction is applied to the equivalent widths calculated from the synthesis models. The velocity dispersion used for this correction is in most cases taken to be the from the Gaussian that is used as model line-of-sight velocity distribution (hereafter LOSVD) (Vazdekis et al. (1997), Worthey (1994)), which is now believed to be only a first approximation of the true LOSVD. Furthermore, metallicity gradients in ellipticals are in most cases determined without taking the radial gradient in the velocity dispersion into account (Vazdekis et al., 1997), or by using some simple scaling relation.
In this paper the possibility to exploit the tight connection between stellar populations and stellar dynamics is explored. Dynamics and stellar populations are studied by modelling directly the observed spectra (De Rijcke & Dejonghe,, 1998). The dynamical model holds a distribution function (hereafter DF) that gives the densities of the stars in phase space. Fitting directly to the galactic spectra has the consequence that a DF is known for each stellar template that is considered in the fit. That such a method is potentially rewarding, has been proved by the seminal work by Pickles (Pickles & Visvanathan (1985)) and by the extensive tests we have performed using synthetic data. These DFs are sums of basis functions and are obtained by a quadratic programming code that minimizes the differences between the observed spectra and the spectra calculated from the model, taking positivity constraints for the DF into account.
Whereas a first paper in this series (De Bruyne et al., 2003a) (hereafter paper I) elaborated on the use of this method for establishing a gravitational potential for the elliptical galaxy NGC 3258, based on spectra of the near-IR CA II triplet, this paper has the scope to investigate the behaviour of different stellar classes in this galaxy. For this reason, the modelling uses spectral features from different wavelength ranges, the near-IR Ca II triplet and the blue Ca H and K lines, that are believed to be tracers of different stellar populations. For an extensive discussion of the modelling strategy and the basis functions that were used to construct the DFs, the reader is referred to paper I.
The observations of the Ca H and K lines near 3900 Å are presented in section 2. These data will be referred to as the ’B’ data, in contrast with the data set around 8600 Å, which will be called the ’near-IR’ data. The data reduction and model for this data set is presented in paper I. In section 3, we discuss two of the tests we have performed to show the method’s potential. Section 4 gives an overview of the absorption features and stellar templates that were used. As a first step, the B data set is modeled separately. The results for the potential and the stellar templates can be compared with the results in paper I, this is done in section 5. The model for the combined data set is presented in section 6. A discussion and conclusions can be found in section 7 and 8 respectively.
2 Observations and data reduction
The E1 galaxy NGC 3258 is found at a distance of 36.12 Mpc (taking =75 km/s/Mpc), hence 1 kpc corresponds to . The galaxy is a member of the Antlia Group and has NGC 3260 (at ) and NGC 3257 (at ) in its neighbourhood.
The photometric data are presented in paper I. There is also a dust disk.
2.1 Spectroscopy
Longslit spectra along the optical major axis ofNGC 3258 were obtained with the ESO-NTT telescope in the nights of 11-12/2/1999, using the blue arm of EMMI, covering the Ca H and K lines around 3900 Å. A number of standard stars (G dwarfs and K and M giants) were also observed in the same instrumental setup, they are listed in table 1.
For these spectra, grating # 12 was used, having a dispersion of 0.92 Å/pix. The detector was a Tektronix CCD with 10241024 pixels, 2424 in size and with a pixel scale of /pix. A slit width of yielded a spectral resolution of 3.73 Å FWHM, resulting in an instrumental broadening of about 122 km/s in the region of the Ca H and K lines. Several exposures of 3600 sec were taken (in total 8 hours).
| HD 21019 | G2V |
| HD 115617 | G5V |
| HD 102070 | G8III |
| HD 117818 | K0III |
| HD 114038 | K1III |
| HD 44951 | K3III |
| HD 29065 | K4III |
| HD 99167 | K5III |
| HD 129902 | M1III |
| HD 93655 | M2III |
Standard reduction steps were applied to these spectra with ESO-MIDAS111ESO-MIDAS is developed and maintained by the European Southern Observatory. A more detailed description of the data reduction can be found in paper I. The calibrated spectra containing the Ca H and K lines have a step of Å.
In a second observation run (in the nights of 27-28/2/2000) major axis spectra taken using the red arm of EMMI, covering the Ca II triplet around 8600 Å (see paper I). Care was taken to put the slit on the same position of the galaxy as in the previous observing run in order to be able to compare the data sets. The galaxy center, being the brightest spot of the galaxy, was taken as reference. The accuracy was better than the equivalent size of a pixel.
2.2 Kinematic parameters
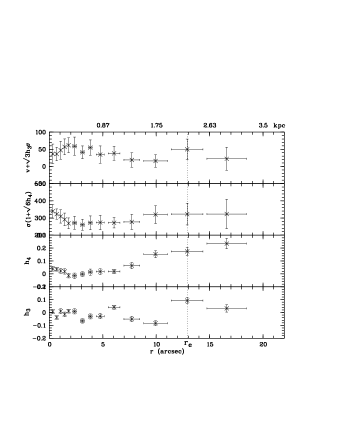
In figure 1 kinematic parameters from the B data set are presented. These data are retrieved from the observations in the same way as the near-IR data. For a more detailed description of the latter, the reader is referred to paper I. The spectra for the B data set are analysed with a mix of a G5V dwarf and a M1III giant.
It is not surprising that the values for the kinematic parameters are not exactly the same for the blue data and the near-IR data. There can be various reasons for the this, like differences in data reduction, the fact that different stellar populations are looked at or that for none of the data set a perfectly matching template was used. Such differences are also reported in Barth et al., (2002). These authors use Mg and Fe lines to derive velocity dispersions. They argue that the results for the blue dispersions may suffer from the fact that elliptical galaxies have a different Mg/Fe ratio than the stellar templates that are used and that these results cause the difference between the blue and red velocity dispersions. They suggest it would be better to only fit the Mg or Fe lines. For the velocity dispersions presented in this paper Ca lines were used in both wavelength regions. Hence, in contrast with Barth et al., (2002) the risk of using template stars with different abundance ratios is not existing in this case. Although there is a slight systematic offset, both kinematic parameter sets are in agreement, in the sense that the data mostly lie within each others error bars.
3 Testing the modeling method
As was argued in section 1, the composition of the stellar population of elliptical galaxies exhibits radial gradients. Hence the introduction of multiple distribution functions : these allow to model a galaxy with a radially varying stellar mix in which stars with different physical characteristics can be in different dynamical states. Of course, it will only be possible to discriminate between stars that have sufficiently different spectral features in the wavelength region(s) covered by the data. Therefore, the use of a broad spectral range, containing absorption lines that are strong enough to show up in noisy galaxy spectra as well as being sufficiently sensitive to the composition of the stellar mix will be prerequisite. Before applying it to real data, we have extensively tested the modeling method and the robustness of the results using synthetic spectra covering a 200 Å-wide region around the Mgi triplet and in two regions (8478Å-8570Å and 8638Å-8700Å) containing the lines of the Caii triplet. We will disscuss the most relevant results of two of these tests.
As a first test, the modeling method is applied to synthetic spectra of a tangentially anisotropic Plummer model. The spectrum of this model galaxy is calculated using the spectra of a G8iii, a K5iii and a M0iii star (see Fig. 2). These stellar spectra cover a very wide spectral range (4800Å-8920Å) with high resolution (1.25Å). They are taken from the AAS CDROM, volume vii, 1996, Leitherer et al. (1996). The synthetic spectrum extends to one half-light radius of the Plummer model (Dejonghe,, 1987). The signal-to-noise ratio is about 130 per pixel in the central line-of-sight (a pixel measures 0.5′′ in the spatial direction and 50 km/s in the dispersion direction), dropping to 60 per pixel at the last data-point. The stellar spectra that are used to calculate the synthetic data also serve as template spectra in the modeling. Thus, we need not worry about template mismatch. We also adopted the correct gravitational potential to model the data. Only the constraint that the distribution function of each stellar class must be positive is imposed.
The results of this experiment are presented in figure 3, where we compare the retrieved kinematics of the three stellar classes with the input model. The projected and the spatial densities are reproduced rather well. The kinematics of the G8iii and K5iii classes are retrieved with comparable accuracy. The deviations between the radial and tangential velocity dispersions of the fitted model and the input model are everywhere between 10-20 km/s. The corresponding errors of the M0iii class can be as large as 30 km/s. The projected dispersions of the three classes can be reproduced with an accuracy of about 10-20 km/s. The errorbars that express the uncertainties, introduced by the noise on the data, on the kinematics of the separate classes are large. This is quite natural since only the summed properties of the three classes are constrained by the data. The errorbars on the kinematics of the total stellar population are much smaller. Concluding, this experiment yields a rather satisfactory result. Given ideal circumstances – the correct potential is assumed, template mismatch is no worry – the modeling technique is able to give a fairly reliable idea of the dynamical state of the three stellar classes in the model galaxy.
As a second test, we use a more varied stellar mix and we do not use the stellar spectra that are used to calculate the synthetic data as templates. The synthetic spectra are calculated with K0v, G5iv, K3iii and the M0iii stellar spectra while we use a K5iii instead of a M0iii template spectrum when fitting to the spectra. The other three template spectra are left untouched. A number of low-order continuum terms are added to the library of components to help the modeling method compensate for this template mismatch. In the spectral region around the Mgi triplet, the K5iii and the M0iii are almost indistinguishable. The lines of the Caii triplet are about 10% deeper in the M0iii than in the K5iii spectrum. In both spectra, these lines are equally broad.
The results of this test are presented in figure 4. The K5iii template more or less takes over the role of the M0iii spectrum. Since the absorption lines in the K5iii and the M0iii template spectrum are equally broad, no large systematic errors are introduced in the kinematics : the spatial velocity dispersions are reproduced with an accuracy of 30-40 km/s. The spatial densities of the different stellar classes are only poorly retrieved. This is a corollary of the fact that the model needs to compensate for the differences in the continuum shape and the depth of the absorption lines between the K5iii and the M0iii spectrum. An important conclusion of this test is that we pay dearly the systematic deviations between the galaxy spectrum and the model spectrum in the Caii triplet region in terms of the . Its value is significantly too high, allowing the model to be rejected at the 99% level. Thus, the modeling method is sensitive to the composition of the stellar population : one is able to reject a galaxy model if the spectral properties of its stellar population do not match those of the galaxy’s stellar mix. Again, the importance of a judicious choice of the spectral regions included in the fit is demonstrated. If only the Mgi triplet region is used in the fit, the model provides an excellent fit to the data, reflected in a perfectly acceptable value.
As a conclusion, one can state that it is possible to extract information from galaxy spectra on the dynamics of different stellar classes if the modeling method is applied to spectral regions that contain absorption features that are sensitive to the composition of the stellar population. If the experiments described in this paragraph are generic, a model can be expected to give a realistic description of the composition and the dynamics of the stellar population of a galaxy in the region where the data quality is has a of more than 30 per bin.
4 Spectral features and templates used for the modelling
4.1 Spectral features
For the extraction of kinematic data out of galaxy spectra, one uses absorption lines that are strong enough to show up in noisy galaxy spectra. Most kinematic data available in the literature come from features in the optical. In this region, the contribution of the sky lines to the integrated spectra is moderate. Near the near-IR-region, the sky becomes more prominent. On the other hand, a stellar population synthesis benefits from the use of a broad spectral region, covering many absorption features.
For the simultaneous study of kinematics and populations as presented in this paper it is important to use absorption features that have enough signal and that have discriminating power toward various stellar types. On the other hand, the number of data points that can be included in the fit is limited.
For our modelling, we used the two strongest lines from the near-IR Ca II triplet. These absorption features are strong in the spectra of giant stars (F-M).
Cenarro et al., (2002) find a complex behaviour of the Ca II triplet strength as a function of three atmospheric parameters: effective temperature, gravity and metallicity. For hot and cold stars, these lines are rather insensitive to metallicity and can be used as a dwarf/giant discriminant. This and the fact that they are very strong and isolated, makes the lines very suited for kinematic studies (Delisle & Hardy (1992), Kormendy & McClure (1993)). Recent results indicate that these lines are insensitive to age for populations older than 1 Gyr. However, they can be contaminated by TiO bands. These bands are absent in the spectra of stars of spectral classes O till late K but become very strong in spectra of very cool stars (later than M0).
From the B data set, the Ca H and K lines were used. These two lines are very strong in early type stars and are sensitive to metallicity. These lines can be used as tracers for recent starbursts (Longhetti et al. (1998), Longhetti et al. (1999)).
The absorption lines used in the modelling are sensitive to different stellar properties and can be used as a diagnostic for different stellar populations. They give complementary information since they are not influenced in the same way by the presence of dust in the galaxy and their detection suffers in a different way from the night sky.
Tests with a broader basis in wavelength, also including the Ca4227, the G band and the Fe4383 feature, are presented and commented on in 7.2.
4.2 Templates
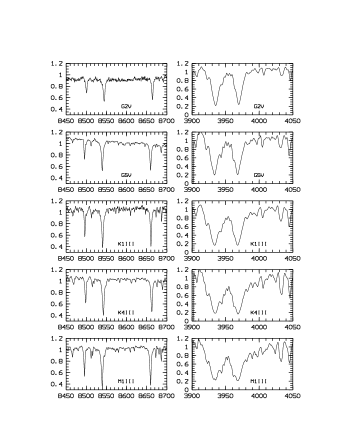
Five template stars that have discernible spectral properties were used: a G2V dwarf, a G5V dwarf, a K1III giant, a K4III giant and a M1III giant (listed in table 1). The spectra are shown in figure 5.
The dynamical models were created in an iterative process. First, models were calculated with a single template star, using a library of about 100 dynamical components. Afterward, the components that are selected for the single template models are used to create mixed stellar template dynamical component libraries. With these mixed libraries, new models were calculated.
5 Models based on Ca H and K lines around 3900 Å
The dynamical modelling strategy and the dynamical components that were used, are discussed in paper I. In that paper, the models for NGC 3258 based on the two strongest near-IR CaII triplet lines (at 8542 Å and 8662 Å) were presented. In similar fashion, the gravitational potential can also be established from modelling the Ca H and K lines.
5.1 Potential
The luminous mass density was obtained from the R luminosity density, hence it is the same profile as used for modelling the Ca II triplet features in paper I.
On a grid of models with different slope of dark matter halo and different total mass, the lowest was obtained for a potential where the spatial density of the total amount of matter was 2.5 times the spatial density of the luminous matter at 2 kpc. This scaling implies that the total mass at is , of which is luminous matter. The total mass at is , and of this is luminous matter.
Just like in paper I it was not necessary to include a black hole in the modelling. The model based on the near-IR data (paper I) used a potential with the same relative amount of luminous and dark matter but with a mass at of .
5.2 Dynamical model
The best fitting model for the B data around the Ca H and K lines is shown in figure 6. Judging from these plots, the fit reproduces the spectra well. The error bars in the centre are very small compared to the error bars in figure 12 in paper I. The main reason for this is that the Ca H and K lines are more pronounced features in the spectrum than the Ca II triplet lines. Moreover, also the contribution of the sky is much smaller in this region.
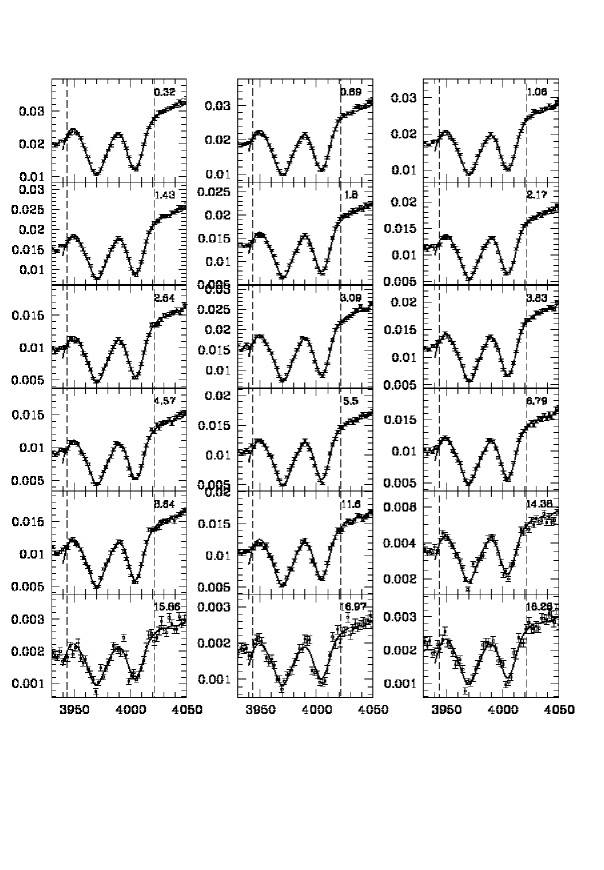
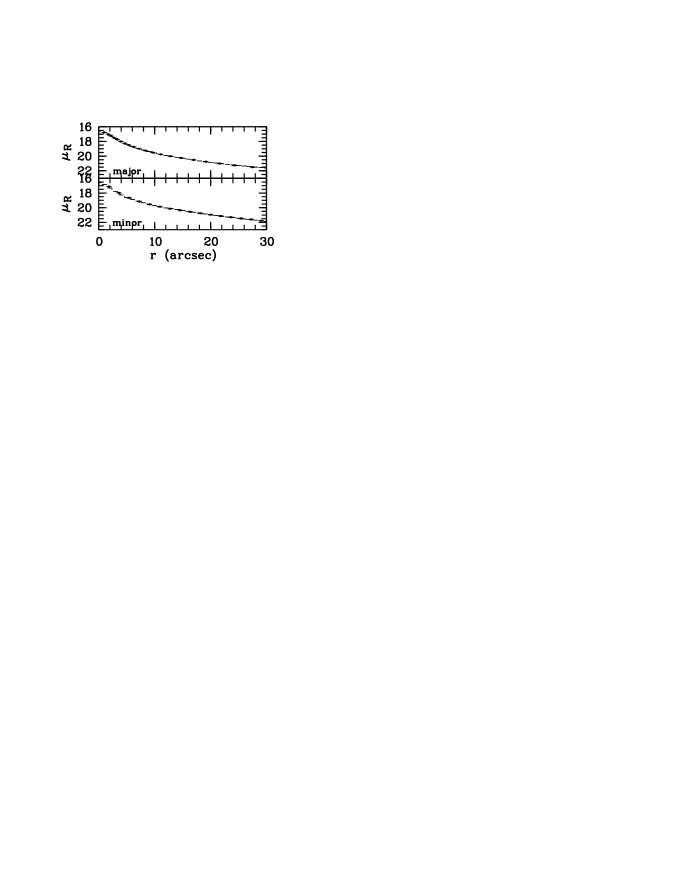
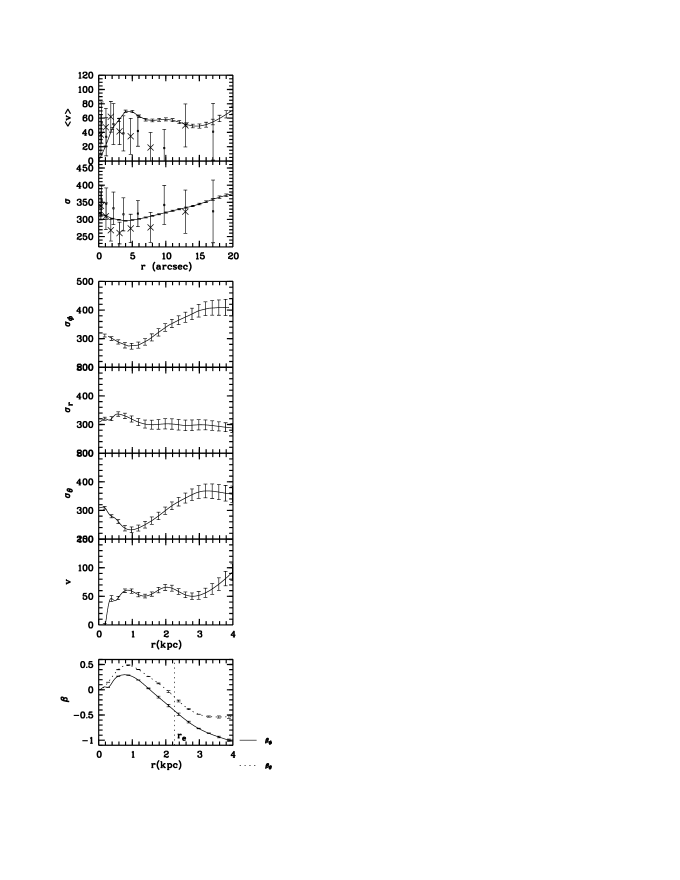
Figure 7 shows some derived quantities of the B model. The upper left panel shows the projected density on major and minor axis. As can be seen, the flattening of the galaxy is well reproduced. The right panels show calculated projected mean velocity and velocity dispersion profiles (solid lines), together with uncertainties on these quantities as derived from the B model. Values and error estimates for the corrected projected mean velocity and velocity dispersion, as presented in figure 1 are plotted on top in dots.
The mean velocity from the B model is between 5 and 12 arcsec somewhat higher than the data points suggest. In figure 7 also the anisotropy parameters (in solid line, also known as Binney’s anisotropy parameter) and (in dotted line) are displayed in the lower left panel. For this model, is positive out to about 1.2 kpc and drops to -1.3 at 4 kpc. This means that the model changes from isotropic in the very centre to radial anisotropic and further on to tangential anisotropic.
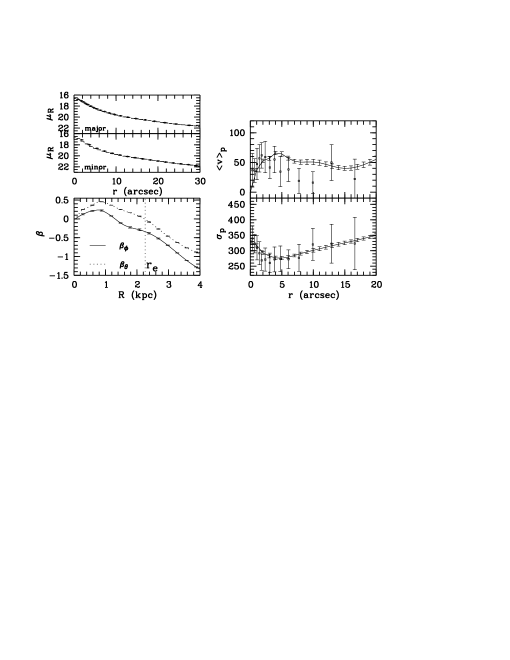
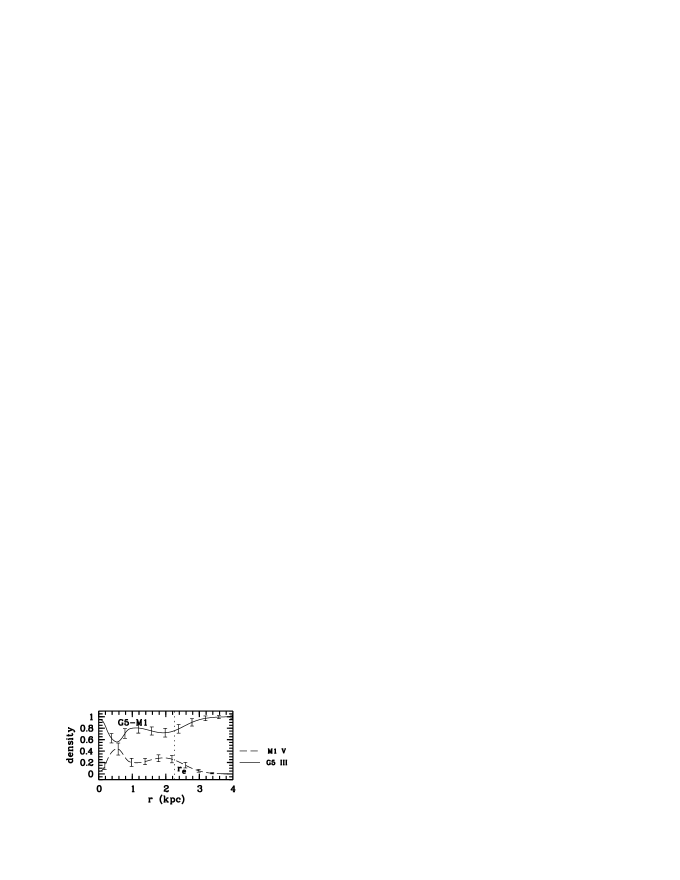
Figure 8 shows the resulting template mix for the best fitting model. In this case the combination of G5V and M1III stars yielded the best result. At all positions, the largest fraction of the density can be found in the G5V stars. The fraction of M1III stars is more than 10 between 0.2 and 2.8 kpc, with a peak of 45 near 0.5 kpc. Further tests have shown that a model with G5V and K4III stars clearly preferred G5V stars, only in the centre there is a very slight contribution of K4III stars. Models where G2V stars are used instead of G5V stars yield the same conclusions concerning mixing of dwarfs and giants, although the relative densities are different.
6 Models based on both spectral regions.
6.1 Potential
The best model for the Ca II triplet data and the best model for the Ca H and K data, were based on a potential with an equal relative amount of dark matter, but the total masses for the models were different. Therefore, also the model based on the combined data sets will be modeled with a potential that is scaled such that the total amount of matter is 2.5 times the amount of luminous matter at 2 kpc. The near-IR model based on the Ca II triplet feature required a total mass that is 20 % higher than that of the model based on the Ca H and K lines. For the model based on the combined spectra, a potential with intermediate mass profile was used.
6.2 The fit
Figure 9 shows the simultaneous fit to the spectra around 8600 Å (first 9 panels) and around 3900 Å (last 10 panels). The spectra were rebinned to higher S/N than for the near-IR and B models based on one spectral region, in order to keep the number of data points in the fit about the same. Overall, the spectral features are well represented.
The minor differences in quality between the fit of this model and each of the models based on only one data set is probably due to the fact that the total mass for this model was different from the total masses used for the near-IR and B models based on only one spectral region. The total mass is 8.3 lower than the mass for the near-IR model based on the 8600 Å data and 10 higher than the mass for the B model based on the 3900 Å data. Hence, the velocity dispersion is maybe a bit too low to fit the Ca II triplet lines perfectly, and maybe a bit too high to fit the Ca H and K lines perfectly.
In principle, it is possible to attribute different velocity dispersions to different stellar populations with the modelling method used in this paper. However, in this case the differences in velocity dispersions cannot simply be solved this way because they are retrieved from wavelength regions that are not far apart.
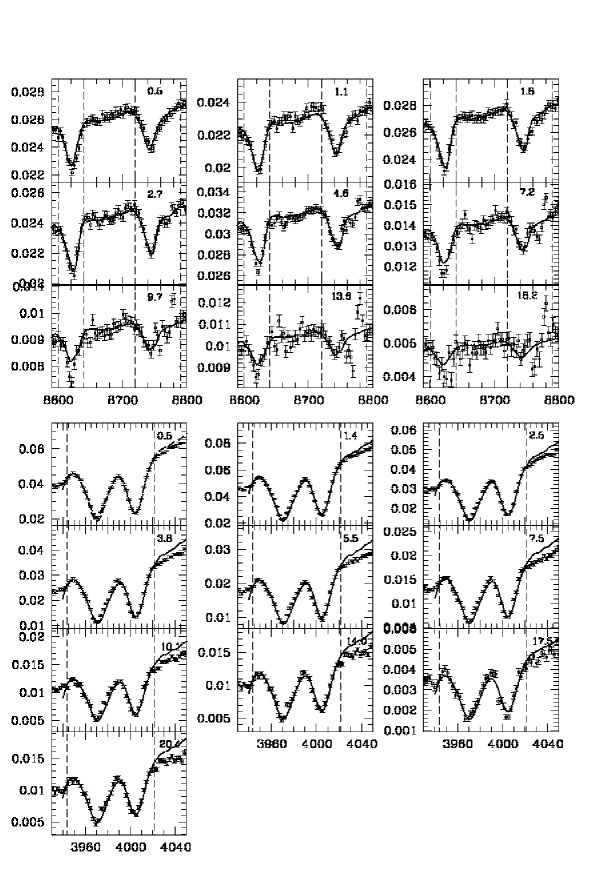
Figure 10 shows some dynamical quantities derived from the model. The data points that are overplotted (corrected projected mean velocity and velocity dispersion) are taken from the near-IR data set of the Ca II triplet (dots) and from the B data set of the Ca H and K lines (crosses). These points are only shown for comparison, they were not included in the fit. It is clear that the projected velocity dispersion profile calculated from the model based on both data sets is in general somewhat lower than the data points from the Ca II triplet set and somewhat higher than the data points from the Ca H and K lines in the B data set. This is again connected to the differences in mass between the several models.
The lower panels display the spatial moments and, in the lowest panel, the anisotropy parameters. As can be seen from the positive values of up to 1.5 kpc, the model is radially anisotropic in the centre and becomes tangentially anisotropic further out.
6.3 Template mixes
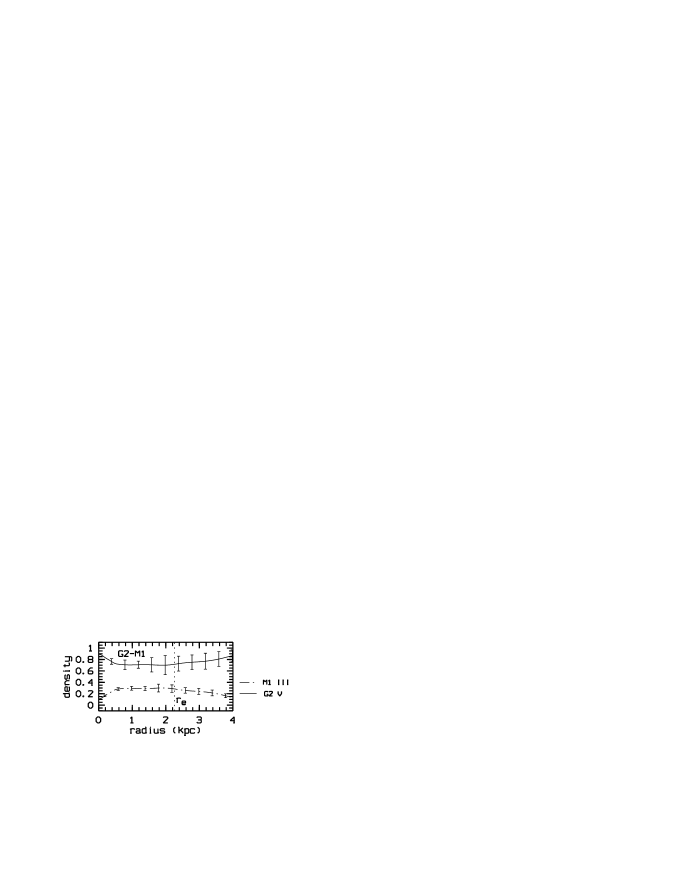
The model composed of G2V dwarfs and M1III giants turns out to be the best model; its template mix is shown in figure 11.
6.3.1 Comparison with other models for the combined data set
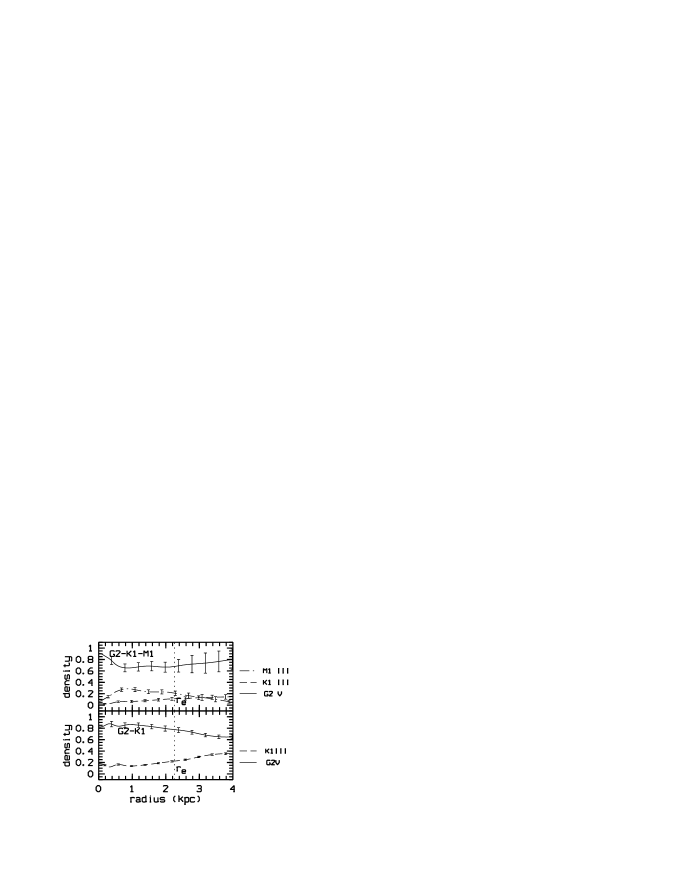
In fact, the model composed of G2V-K1III-M1III stars (mix presented in upper panel of figure 12) has the lowest value for . However, this value is only marginally lower than the for the G2V-M1III model. Furthermore, as can be seen from the presentation of the mix (figure 12), the contribution of the K1 stars to the mix is almost negligible in the centre and is at its maximum at the outermost radius in the figure (there were no data available to constrain the model in this region). The mix for the G2V-K1III-M1III model indicates that the dynamical constraints on that population are not that strong and that the contribution to the total DF in the inner part of the galaxy is not that large. These are arguments in favor of presenting the G2V-K1III model as the best fitting model.
The lower panel of figure 12 shows the stellar mix for the model composed of G2V and K1III stars. It suggests that the contribution of K1III stars increases outwards. This is in contrast with the behaviour of the G2V-M1III model, where the contribution of M1III stars is decreasing between 2 kpc and 4 kpc. In both panels of figure 12, G2V stars clearly contribute most to the total density, at least 65 for the G2V-K1III model and at least 70 for the G2V-M1III model, with an increasing number of dwarfs toward the centre.
6.3.2 Comparison with models based on a single data set
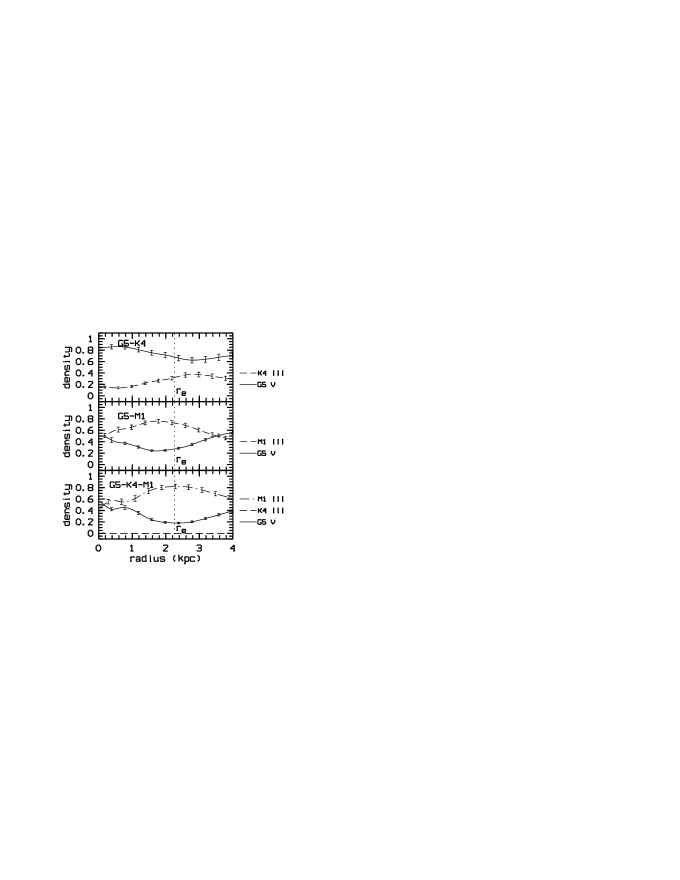
Figure 13 compares the models based on only one spectral region with models based on the combined data set. The stellar populations that were preferably used in the former case, are not the ones that provide a best fit here. However, it may be instructive to see what are the differences and the concordances. The panels that can be compared with panels for the model based on the spectra around 8600 Å in figure 15 from paper I are the ones with the G5V-K4III mix and the G5V-K4III-M1III mix. The G5V-K4III mix for the combined model shows, just like for the near-IR model, a radial decrease in contribution from G5V stars. However, the density of G5V stars is larger for the model presented here. This is not surprising, since the G5V stars are the dominant population in the B model, see figure 8. On the other hand, relative contributions of stellar types in the G5V-M1III panel for the combined model look very different from the G5V-M1III panel in figure 8. Hence, it is no surprise that the G5V-K4III-M1III combination (but where K4III stars are almost not used) provides not as good a model as the G2V-K4III-M1III combination.
6.3.3 Dynamics
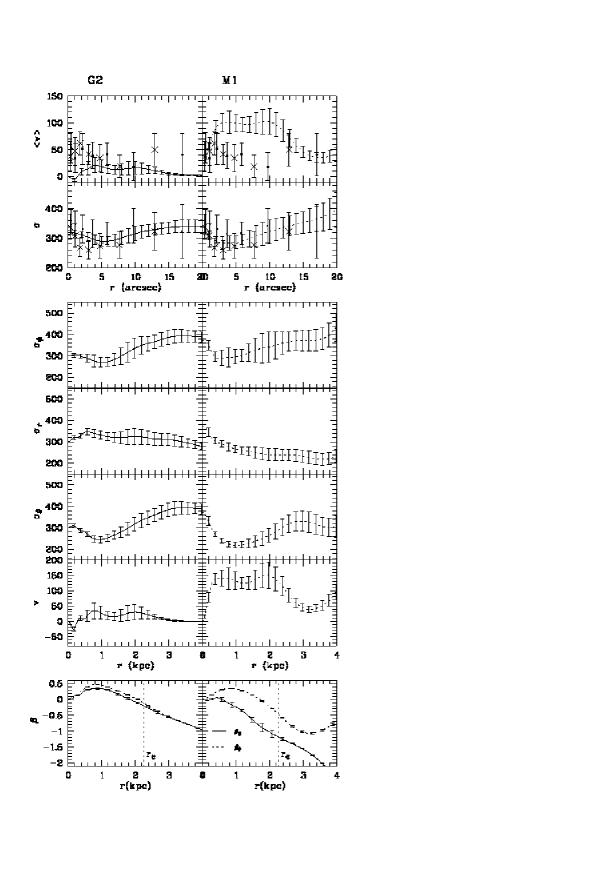
In figure 14 a number of dynamical quantities are shown for the separate populations in the best fit model for the combined data set (composed of G2V and M1III stars). It can be compared with figure 10, where the same quantities are shown for the combined DF. The panels show (from top to bottom) the projected mean velocity, the projected velocity dispersion, , , , the spatial velocity and the anisotropy parameters for the two populations (in columns). Not surprisingly, the error bars on the dynamical quantities are larger for the populations that contribute less to the total density. This means that the dynamical model is putting more constraints on the moments for the populations that contribute more to the total density. The agreement between these projected moments and the data retrieved with a classical technique (overplotted in dots and crosses) is not really of great importance. However, one would expect that for a mix of this kind where one particular stellar type is really dominant, the dynamical moments of this population more or less agree with the data. This is indeed the case, as can be seen in in the first column, where the results for the G2V stars are shown. Form the two columns in this figure, it becomes clear that the two populations in this model have quite distinct kinematic properties.
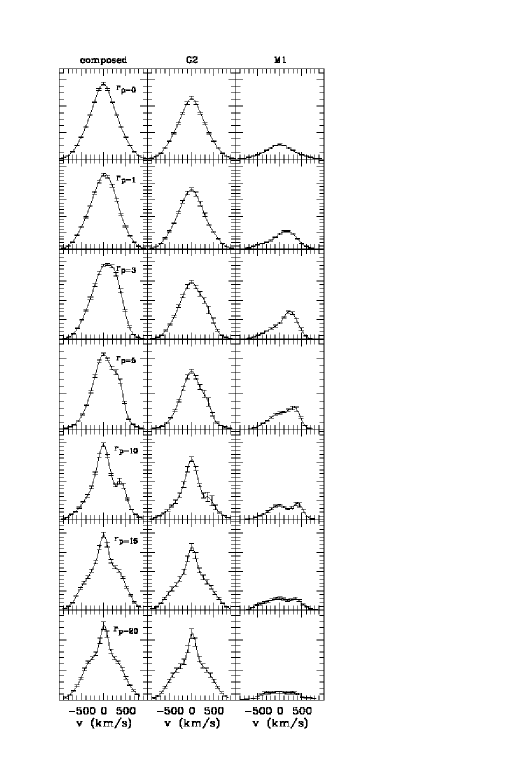
6.4 LOSVDs
For the best fitting model for the combined data set, a number of line profiles are shown in figure 15. The LOSVDs are calculated on the major axis, at 0, 1, 3, 5, 10, 15, and 20 arcsec from the centre (panels from top to bottom), as indicated in the left column of the figure. From left to right are shown: the LOSVD for the complete model, for the G2V population and for the M1III population. In general, these LOSVDs are clearly not Gaussian. The height of the LOSVD is proportional to the contribution of the population to the total density.
The total LOSVD in the centre is almost symmetric, as are the LOSVDs for G2V and M1III stars. At a projected radius of 1 arcsec, the total LOSVD shows a slight wing toward positive velocities, whereas the LOSVD for the G2V stars is fairly symmetric. The LOSVD for the M1III stars is highly antisymmetric, with a strong wing toward positive velocities. This characteristic is also reflected in the total LOSVD. At that position (0.5 kpc), the M1III stars contribute about 30 to the total density. Also for larger radii, it is clear that the contribution of a small stellar class to the total LOSVD can be important. At 10 arcsec, the bump in the total LOSVD is mainly caused by the M1III stars, and there (at about 1.7 kpc) they also contribute about 30 to the total density. Also from the LOSVDs one can see that the two stellar populations have very different kinematics.
6.5 Distribution functions
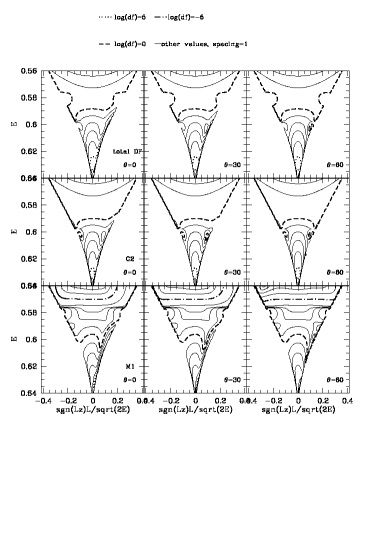
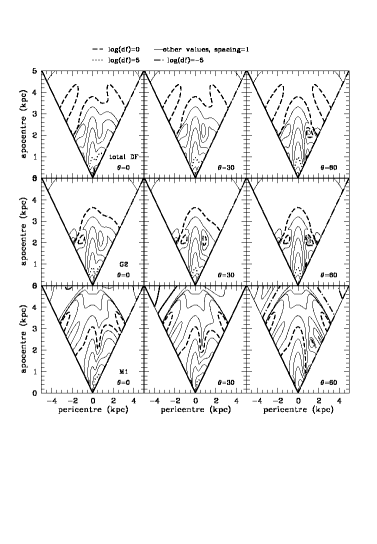
Figures 16 and 17 show DFs for the best fitting model. Due to the fact that the model is based on a spherical potential, the DF is built with planar orbits. The DF itself is a function of three parameters (the energy E, the modulus of the total angular momentum L and the vertical component of the angular momentum ). Hence, it seems a natural choice to present this three-dimensional function by means of sections with a plane that is tilted with respect to the equatorial plane of the reference system used for the modelling. In this case, the -axis corresponds to the rotation axis. All orbits in a plane tilted over an angle with the -axis, have . Each column in figures 16 and 17 shows a section with a different plane: the equatorial plane (, left), a plane tilted over (middle) and a plane tilted over (right). For a plane parallel to the z-axis, the DF is symmetric.
The plots in figure 16 show DFs in integral space, for the total DF (upper row) and the DFs for the separate stellar classes. The DF is expressed in phase space number densities. The contour plots in figure 17 show DFs in turning point space, also for the total DF (upper row) and the DFs of the separate stellar classes. In a sense, the representation in integral space and in turning point space give complementary information. The representation in integral space highlights the radial orbits, whereas the circular orbits are squeezed. The orbits with no or very little angular momentum can be found near the vertical axis of the panels. The opposite is true for the representation in turning point space, see e.g. also De Bruyne et al., (2001). These orbits have small differences between the values for peri- and apocentre and can be found near the edge of the plots.
The logarithm of the DF is shown in each panel, the spacing between the contours is 1.
From these figures it is again clear that
-
•
For increasing tilt of the plane of section, the structure due to the sign of is decreasing.
-
•
For the total DF (following the dotted contour for log(df)=5) it seems that circular orbits are preferred, though there is also a large fraction of radial orbits (upper left panels of figures 16 and 17). This is clearly due to the behaviour of the M1III stars, that are almost all on circular orbits (lower left panels of figures 16 and 17). This is not surprising, since the rotation velocity of the M1III stars is very high, where that of the G2V stars is rather low (see figure 14). This preference of M1III stars for circular orbits remains at larger radii or lower energies, while the G2V stars gradually prefer more and more intermediate or near radial orbits. This caused a lot of structure in the panels for the total DF, especially in the representation in turning point space.
-
•
both populations have substantially different kinematics.
7 Discussion
This is the first paper that reports on the application of this modelling technique to a combination of data taken from different wavelength regions. Whereas the goal of simultaneously studying kinematics and stellar populations is reached, there are still some issues to address.
7.1 Wavelength regions
From paper I and section 4 in this paper it is clear that data sets from different wavelength regions produce best models with different potentials. This means that an accurate determination of the potential benefits from including absorption features over a broad wavelength range. Moreover, most of the mass estimates that are currently found in literature are likely to be biased because of the limited wavelength range they are based on. Combining information from different wavelength ranges is not easy to obtain, both observationally and on the modelling side when conventional modelling techniques are used. Hence, we believe that the modelling method illustrated in this paper may be a possible way to improve current techniques.
7.2 Technical issues
The construction of a dynamical model implies that a number of choices have to be made, that may have arisen from technical issues originally, but some of them might raise points of discussion.
-
•
How dependent is the result on the use of the specific stellar templates? The final model is composed of the spectra of HD21019 and HD129902, a G2V and M1III star. It is not tested how the obtained results change when other representatives of the G2V and M1III classes of stars would have been used. However, the differences between spectra of other representatives of the same stellar class are supposed to be smaller than the differences between the spectra of different stellar classes. Therefore, we expect that models with other template stars than the ones used now, will lead to the same general conclusions, while the exact values of the DFs may be different. However, a similar concern may be expressed when a standard technique is used to derive kinematic data from observed galaxy spectra.
-
•
How dependent is the result on the use of the specific parts of the spectra? It is clear that the outcome of the population synthesis depends on the spectral features that are used. This is also the case for stellar population studies that use a more common technique, like e.g. Vazdekis et al. (1997). These authors find in their chemo-evolutionary population synthesis study of early-type galaxies that the metallicity determined from the Fe lines differs from that determined from the Mg lines.
However, stellar population synthesis techniques are restricted to the use of only a limited number of lines. Classical models assuming a single burst are not expected to explain an extended set of indices (Worthey, 1994) because the formation history of a real galaxy is more complicated than that.
For the modelling technique presented in this paper current computational limitations (the number of data points is restricted) put a limit on the number of absorption lines that can be used. Moreover, the broadening of the lines due to the high velocity dispersions in elliptical galaxies has the consequence that only the strongest lines can be used. For the data around 3900 Å, it is checked that the inclusion of some smaller features, at 4227 Å (Ca line) and at 4383 Å (Fe line), does not change the main conclusions of the model. Possible concerns are that the set of template stars and dynamical components that deliver the best fit to a small spectral region, is not adequate for fitting a broader region.
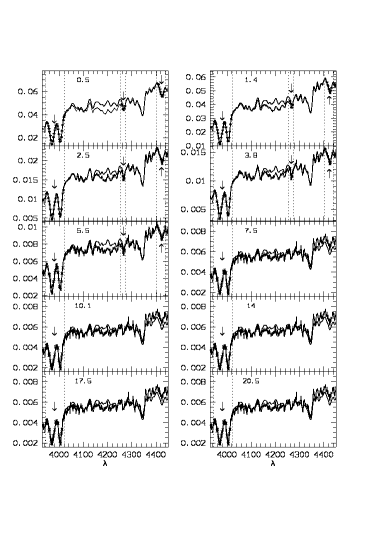
Figure 18: Fit to a broader wavelength region. The regions included in the fit are located between the intervals indicated by dashed lines and are indicated with an arrow. The projected radii of the positions where the spectra are taken are indicated in the panels. The fit to this extended B data set is shown in figure 18, the spectral lines of interest are between vertical dotted lines. The fit to the Ca 4227 and Fe 4383 lines (first five panels) is within the error bars. For larger radii, the lines were not included in the fit, but even there, the Ca 4227 line is also good represented by the model spectra. For the Fe 4383 line, the difference between the original and model spectrum is larger. The main reason for this is probably the fact that during the fit, the normalization of the spectra is only applied for the parts that are included in the fit.
This shows that in this case the extended data set can be modelled with the stellar templates and dynamical components that give a good fit for the smaller data set. Hence, we expect that for a model based on the strongest lines (the ones that are used now) and some weaker lines the results on the stellar mix and the dynamical state of the galaxy and populations are robust, though the values of the DFs and the derived moments may be slightly different.
-
•
How realistic are the error bars on the model and the derived quantities? The error bars on the model depend on the errors on the data and on the components that are included in the model. The error bars on the models are derived from the Hessian matrix involved in the quadratic programming. These error bars have a statistical meaning, if the noise on the spectra is Poisson noise and if the data points are weighted by their errors. But after standard data reduction, rebinning and sky subtraction, the noise on the spectra is no longer pure Poisson noise, neither are the data points independent (see De Bruyne et al., (2003)). However, the use of a quadratic programming assumes independent data points.
If a component goes to zero, also the error on that component goes to zero. This explains why e.g in figure 14, for the G2V stars, the error on the velocity is zero for larger radii. It is also possible that the error on the dispersion is lower in outer regions. This happens when less components contribute in the outer regions than for the inner regions. There will be larger constraints on these fewer components, hence the error bars will be smaller. This indicates that the error bars calculated from the model will underestimate the real errors.
7.3 Formation history
The photometry (see paper I) revealed a dust disk around the centre of NGC 3258. Unfortunately, our B spectra do not extend far enough to check the presence of any [OII] emission. Central dust disks are found in a number of galaxies. Most of these galaxies are powerful radio sources (e.g. NGC 7052 van der Marel & van den Bosch (1994), NGC 4261 Jones et al. (2000)) or show clear signs of kinematically distinct cores (Carollo et al.,, 1997). This is not the case for NGC 3258. In X-rays, there is no sign of major activity in the centre of this galaxy, the measured flux is consistent with the relation pointed out by Mahdavi & Geller (2001). Hence, it is not very probable that the centre harbours an (at the moment) active nucleus.
Due to the limited spatial resolution of our data, we detect no kinematic signature of a central massive black hole, although following the scaling relation of Ferrarese & Merritt (2001), a central black hole of about could be present in the galaxy.
Moreover, the disk seems to be aligned with the major axis of the galaxy, which tends to be the case in more galaxies (Tran et al., 2001). This may well point at an internal origin of the dust, or of a capture long enough ago so that no obvious signs of interaction are left.
The B-R colour indicates a reddening toward the centre and the population synthesis points suggests that the number density of dwarfs is increasing from 0.5 kpc inwards. Hence this reddening may be caused by a combination of dust effects and higher metallicity, consistent with findings of e.g. Kobayashi & Arimoto (1999). Also the Mg2 indices (Golev & Prugniel, 1998) point toward higher metallicity in the centre. This also suggests that the star formation in the centre went on longer than in the outer parts of the galaxy. This does fit in a formation scenario as outlined and simulated by Mori et al. (1999), where the shrinking of a protogalaxy increases the density in the centre so that active star formation ignites. In the centre of the galaxy, cycles of newborn and dying stars continue and cause the metallicity to increase. In the outer regions there is not enough gas to continue star formation in an enriched environment.
The central dust disk reported in paper I probably harbours the hot dust component of (Ferrari et al., 2002). This could be interpreted as a star formation region or as the signature of a black hole. To solve this issue of the hot dust, further observations would be required.
It seems possible that NGC 3258 is observed in a stage in the cycle where there is no (or very low) star formation. The increase of dwarfs toward the centre may be a remnant of a past star formation period. The fact that there is still dust in the centre and still some gas, conform the weak [OII] and HI emission, leaves the possibility open that this galaxy will go through another star forming episode in the future. If there is indeed a black hole in the centre, following a suggestion of Tran et al. (2001), the present period of inactivity may be due to an at the moment inefficient fuel accretion.
The dynamical analysis of the two stellar populations in the model based on the Ca H and K lines and the Ca II triplet lines indicates that the old population of M1III giants contains a lot of rotation, while the younger G2V dwarfs show little or no rotation. The difference in rotation between the two populations suggests that the bulk formation of dwarfs occurred at a moment when the material they are made of had less angular momentum. Also Van Dokkum & Franx (1995) suggest that dust should have some way of losing angular momentum. A possible way to do this might be through dissipationless merging. Zurek et al (1988) found in their simulations that dissipationless merging forces the cores of the merging galaxies into the core of the final product, in the process of which cores become more bound and lose angular momentum.
8 Conclusions
In this paper we present a method to analyse spectra from elliptical galaxies in order to retrieve dynamical information and a stellar population synthesis at the same time. The method originates from the field of dynamical modelling and is outlined by De Rijcke & Dejonghe, (1998). The main idea is that the different stellar populations that contribute to the integrated galaxy spectrum do not necessarily share the same kinematic characteristics. Hence, in terms of dynamical modelling, they should be given different distribution functions. Hence, our aim is to find a spatial distribution of the different stellar populations in the galaxy under study, while the dynamical constraints are obeyed.
Until very recently, stellar template spectra observed with the same instrumental setup as the galaxy spectrum were indispensable to extract kinematical information from the galaxy spectra. However, facing the realities concerning the obtainment of observing time on heavily oversubscribed observatories, it is simply impossible to observe a large number of template stars, covering a wide range of spectral types, ages, and metallicities. Nor do the galaxy spectra, usually covering only a limited spectral region with only a handful of strong absorption lines, allow to constrain the dynamical states of a large number of distinct stellar populations. Since the template spectra need to have the same instrumental characteristics as the galaxy spectra, it is very difficult to extend an observed set of templates with archival data.
If stellar templates are used, the method presented in this paper does not explicitly take an evolutionary status into account and is akin to the empirical spectral synthesis method pioneered by Pickles (Pickles & Visvanathan (1985)). We do conceed that the present method can only show its full potential if realistic template spectra are used. With the work of Vazdekis (Vazdekis (1999)), SSP spectra have become available that potentially can replace stellar templates. These SSP spectra have high spectral resolution and can be transformed to the instrumental characteristics of the observed galaxy spectra (see Falcón-Barroso (Falcón-Barroso et al (2003)) for an first application). However, they still have to prove their usefulness in the field of galaxy dynamics and much more applications to real data will have to be done before they can completely replace observed stellar templates. Although this holds great promises for the future, stellar templates will be in use for some time to come. Our modeling method makes the best possible use of the kinematical and stellar-mix information in the spectra and nothing prevents us from replacing observed templates by SSP spectra, opening the door to a complete assessment of the dynamical and chemical state of a stellar system.
Such models can be used to obtain more information than immediately available from the observations. An other important advantage is that dynamical models are suitable for comparisons between individual galaxies (e.g. De Bruyne et al., (2001)), whereas evolutionary models are less appropriate for this (Worthey, 1994). However, the latter have the advantage that they consider an evolution in time. With the method presented here it is possible to combine spectral features coming from different wavelength regions and even different observational setups. This is an important advantage in comparison with modelling methods that use LOSVDs or kinematic parameters that are derived from the spectra.
More specific conclusions are :
-
•
Potential.
The potential derived from the Ca II triplet or the Ca H and K lines is different. The slope of the dark matter halo is the same, but the total amount of mass is different. This conclusion is based on the modelling of the spectra, but the modelling of the kinematic profiles would probably also lead to different potentials. The total amount of mass inferred from the model based on the combined data sets lies in between the masses of the models based on only one spectral region. These three models give an estimate for the total mass at 2 (4.5 kpc) of (lower limit from B model, upper limit from near-IR model). At this radius 37 of the mass is in luminous matter.
This indicates that establishing a potential for a galaxy may be dependent on the wavelength range used for the modelling. Here, the total mass included in the B and near-IR models at 2 differs as much as (about 20 to 25 % of the total mass) depending on the wavelength range that is used. If multiwavelength information is indeed required to determine the potential of elliptical galaxies, this modelling method has non-negligible advantages. It is clear that in such a case only modelling methods can be used where it makes sense to combine information from different wavelength regions.
The modelling did not require to include a black hole in the centre.
-
•
Stellar populations.
The stellar population mixes from the models based on the Ca II triplet, the Ca H and K lines and the combined data sets are different. For the models based on one spectral region, this can be expected, since the sensitivity of the spectral features that are used is different.
However, the stars that give the best results for these models (G5V-K4III for the Ca II triplet and G5V-M1III for the Ca H and K lines) do not provide the stellar mix that gives the best results for the model based on both spectral regions. The best model is in this case composed of G2V and M1III stars, more than 75 of the stars are dwarfs.
Toward the centre there is an increase in dwarfs, this result is also seen in the B model and is consistent with results obtained by Trager et al. (2000b). This indicates that the reddening toward the centre is caused by a metallicity gradient. Part of the reddening may be caused by the dust disk (see paper I).
-
•
Internal dynamics
All three models are isotropic in the very centre, radially anisotropic in an intermediate region (till roughly for the near-IR model and roughly for the B model and till roughly for the combined model) and are tangential anisotropic at large radii.
The model for the combined data set is studied in more detail and clearly attributes substantially different kinematic behaviour to the two classes of stars used for the combined spectra. In this case, almost all rotation is delivered by the giants.
9 Appendix
Acknowledgments
VDB acknowledges financial support from FWO-Vlaanderen. WWZ acknowledges the support of the Austrian Science Fund (project P14783) and the support of the Bundesministerium für Bildung, Wissenschaft und Kultur.
References
- Barth et al., (2002) Barth A.J., Ho L.C., Sargent W.L.W., 2002, AJ, 124, 2607
- Berczik, (1999) Berczik P., 1999, A&A, 348, 371
- Bertola et al., (1996) Bertola F., Cinzano P., Corsini E.M., Pizzella A., Persic M., Salucci P., 1996, ApJ, 458L, 67
- Bregman et al. (1998) Bregman J.N., Snider B.A., Grego L., Cox C.V., 1998, ApJ, 499, 670
- Bressan et al., (1994) Bressan A., Chiosi C., Fagotto F., 1994, ApJS ,94, 63
- Bruzual & Charlot, (1993) Bruzual G., Charlot S., 1993, ApJ, 405, 538
- Carollo et al., (1997) Carollo C.M., Franx M., Illingworth G.D., Forbes D.A., 1997, ApJ, 481, 710
- Cenarro et al., (2002) Cenarro A.J., Gorgas J., Cardiel N., Vazdekis A., Peletier R.F., 2002, MNRAS, 329, 863
- De Bruyne et al., (2001) De Bruyne V., Dejonghe H., Pizzella A., Bernardi M., Zeilinger W.W., 2001, ApJ, 546, 903
- De Bruyne et al., (2003) De Bruyne V., Vauterin P., De Rijcke S., Dejonghe H., 2003, MNRAS, 339, 215
- De Bruyne et al. (2003a) De Bruyne V., De Rijcke S., Dejonghe H., Zeilinger W.W., in preparation (paper I)
- Dejonghe, (1987) Dejonghe H., 1987, MNRAS, 224, 13
- Delisle & Hardy (1992) Delisle S., Hardy E., 1992, AJ, 103, 711
- De Rijcke & Dejonghe, (1998) De Rijcke S., Dejonghe H., 1989, MNRAS, 298, 677
- De Rijcke et al., (2003) De Rijcke S., Dejonghe H., Zeilinger W.W¿, Hau G.T., in preparation
- Falcón-Barroso et al (2003) Falcón-Barroso J., Balcells M., Peletier R. F., Vazdekis, A., 2003, A&A, 405, 455
- Ferrarese & Merritt (2001) Ferrarese L., Merritt D., 2000, ApJ, 539, L9
- Ferrari et al. (2002) Ferrari F., Pastoriza M.G., Macchetto F.D., Bonatto C., Panagia N., Sparks W.B., 2002, A&A, 389, 355
- Ferrari et al. (1999) Ferrari F., Pastoriza M.G., Macchetto F.D., Caon N., 2000, A&AS, 136, 269
- Jones et al. (2000) Jones D.L., Wehrle A.E., Meier D.L., Piner B.G., 2000, ApJ, 534, 165
- Kobayashi & Arimoto (1999) Kobayashi C., Arimoto N., 1999, ApJ, 527, 573
- Kormendy & McClure (1993) Kormendy J., McClure R.D., 1993, AJ, 105, 1793
- Longhetti et al. (1998) Longhetti M., Rampazzo R., Bressan A., Chiosi C., 1998, A&AS, 130, 251
- Longhetti et al. (1999) Longhetti M., Bressan A., Chiosi C., Rampazzo R., 1999, A&A, 345, 419
- Mahdavi & Geller (2001) Mahdavi A., Geller M.J., 2001, ApJ, 554, L129
- Mehlert et al. (1998) Mehlert D., Saglia R.P., Bender R., Wegner G., 1998, A&A, 332, 33
- Michard (2000) Michard R., 2000, A&A, 360, 85
- Golev & Prugniel (1998) Golev V., Prugniel P., 1998, A&AS, 132, 255
- Leitherer et al. (1996) Leitherer et al., 1996, PASP, 108, 996
- Mori et al. (1999) Mori M., Yoshii Y., Nomoto K., 1999, ApJ, 511, 585
- Peletier et al. (1990a) Peletier R. F., Davies R. L., Illingworth G. D., Davis, L. E., Cawson M., 1990a, AJ, 100, 1091
- Peletier et al. (1990b) Peletier R. F., Valentijn E. A., Jameson R. F., 1990b, A&A, 233, 62
- Pickles & Visvanathan (1985) Pickles A.J., Visvanathan N., 1985, ApJ, 294, 134
- Surma & Bender (1995) Surma P., Bender R., 1995, A&A, 298, 405
- Theis et al. (1992) Theis Ch., Burkert A., Hansler G., 1992, A&A, 265, 465
- Trager et al. (2000a) Trager S.C., Faber S.M., Worthey G., González J.J., 2000, AJ, 119, 164
- Trager et al. (2000b) Trager S.C., Faber S.M., Worthey G., González J.J., 2000, AJ, 120, 165
- Tran et al. (2001) Tran H.D., Tsvetanov Z., Ford H.C., Davies J., Jaffe W., Van den Bosch F.C., Rest A., 2001, AJ, 121, 2928
- Vazdekis et al. (1996) Vazdekis A., Casuso E., Peletier R.F., Beckman J.E., 1996, ApJS, 106, 307
- Vazdekis (1999) Vazdekis A., 1999, ApJ, 513, 224
- Vazdekis et al. (1997) Vazdekis A., Peletier R.F., Beckman J.E., Casuso E., 1997, ApJS, 111, 203
- van der Marel & van den Bosch (1994) van der Marel R.P., van den Bosch F.C., 1998, AJ, 116,2220
- Van Dokkum & Franx (1995) Van Dokkum P.G., Franx M., 1995, AJ, 110, 2027
- Worthey (1994) Worthey G., 1994, ApJSS, 95, 107
- Zurek et al (1988) Zurek W.H., Quinn P.J., Salmon J.K, 1988, ApJ, 330, 519