DW Cancri: a magnetic VY Scl star with an orbital period of 86 minutes.
Abstract
We present the first time-resolved spectroscopic study of the cataclysmic variable DW Cancri. We have determined an orbital period of min, which places the system very close to the observed minimum period of hydrogen-rich cataclysmic variables. This invalidates previous speculations of DW Cnc being either a permanent superhumper below the period minimum or a nova-like variable with an orbital period longer than 3 hours showing quasi-periodic oscillations. The Balmer and He i lines have double-peaked profiles and exhibit an intense S-wave component moving with the orbital period. Remarkably, the Balmer and He i radial velocity curves are modulated at two periods: min (orbital) and min. The same short period is found in the equivalent width variations of the single-peaked He ii 4686 line. We also present time-resolved photometry of the system which shows a highly-coherent variation at 38.51 min, consistent with the short spectroscopic period. The large number of similarities with the short-period intermediate polar V1025 Cen lead us to suggest that DW Cnc is another intermediate polar below the period gap, and we tentatively identify the photometric and spectroscopic 38 min signals with the white dwarf spin period. DW Cnc has never been observed to undergo an outburst, but it occasionally exhibits low states mag fainter than its typical brightness level of , resembling the behaviour of the high mass-transfer VY Scl stars.
keywords:
accretion, accretion discs – binaries: close – stars: individual: DW Cnc – novae, cataclysmic variables1 Introduction
Despite their name, a surprisingly large fraction of cataclysmic variables (CVs, see Warner (1995) for a review) do not display frequent and/or large amplitude brightness variations and may easily escape detection. DW Cnc (FBS 0756+164) is an example of such systems. It has been identified in the First Byurakan Survey, a spectroscopic galaxy survey, as a CV because of its noticeable Balmer emission lines. Stepanian (1982) reported brightness variations in the range and suggested that DW Cnc is a dwarf nova, a classification later supported by Kopylov et al. (1988).
Uemura et al. (2002) performed the first time-resolved photometric study of DW Cnc and found it at . They also observed a variation with an amplitude of mag —which they explained as quasi-periodic oscillations (QPOs)— and no outburst activity. Two possible periods (37.5 and 73.4 min) were reported. The authors attributed the variability to either permanent superhumps with the longest period or trapped disc oscillations in a 3-hour period nova-like system.
We recently noticed DW Cnc as a bright but poorly studied CV in the course of our ongoing large-scale spectroscopic survey for new CVs (e.g. Gänsicke et al. 2000; Gänsicke, Hagen & Engels 2002; Araujo-Betancor et al. 2003). In this paper we present the first time-resolved spectroscopic observations of DW Cnc, along with the analysis of new and archival photometry.
2 Observations and data reduction
2.1 Photometry
Differential CCD photometry of DW Cnc was obtained with the 1.0-m Jacobus Kapteyn Telescope on La Palma (Isaac Newton Group archive data; 1999 February 24, 28) and the 0.82-m IAC80 telescope on Tenerife (2003 April 12). The JKT observations were performed in the -band using the pixel2 Tek4 CCD detector, whilst unfiltered images were taken with the pixel2 Thomson CCD at the IAC80 (See Table 1). The raw images were debiased and flat-fielded in the standard way. After aligning all images, we measured the instrumental magnitudes of the target and two close comparison stars using the point spread function (PSF) packages within iraf111iraf is distributed by the National Optical Astronomy Observatories.. Differential photometry of DW Cnc was then computed relative to each comparison star. The accuracy of the photometric measurements was mag and mag for the JKT and IAC80 data, respectively. A magnitude offset between the JKT -band data and the IAC80 white-light data was calculated from the instrumental magnitudes of the same comparison stars measured in both image sets. The IAC80 light curve was then shifted by this offset in order to be consistent with the -band data. The fact that the JKT and IAC80 light curves share approximately the same mean level indicates that the colour correction is negligible.
| Date | Telescope | Band | Exp. (s) | Coverage (h) |
|---|---|---|---|---|
| 1999 Feb 24 | JKT | 120 | 5.58 | |
| 1999 Feb 28 | JKT | 90 | 3.03 | |
| 2003 Apr 12 | IAC80 | White light | 15 | 1.52 |
2.2 Spectroscopy
Time-resolved spectroscopy of DW Cnc was performed with the Calar Alto 2.2-m telescope (2003 April 7, 8, 9, 11) and the 2.5-m Isaac Newton Telescope (INT) on La Palma (2003 March 13 and April 22, 26). At the 2.2-m telescope we used the Calar Alto Faint Object Spectrograph (cafos) along with the G-100 grism. This setup, together with a slit width of 1.2″, gave a spectral resolution of 5.7 Å (FWHM) and a useful wavelength range of on the pixel2 SITe CCD. The Intermediate Dispersion Spectrograph (ids) on the INT, with the R632V grating and a slit width of 1.5″, provided a useful range of at 2.3 Å (FWHM) resolution on the pixel2 EEV10a chip (April data). For the March run at the INT we used the R900V grating and a slit width of 1.2″. This setup gave a spectral range of at a resolution of 1.6 Å (FWHM). Details on the spectroscopic observations are found in Table 2.
The -band magnitude of DW Cnc was measured during the Calar Alto run from the cafos acquisition images with respect to the Hubble Space Telescope guide star GSC0136301286 (). The values are , for the four nights. The brightness of DW Cnc is therefore consistent with the mean magnitude measured over 8 years (see Fig. 1).
The individual spectra were corrected for the bias level and flat-field structure. After sky-subtraction, they were optimally extracted (Horne, 1986). For the wavelength calibration a low-order polynomial was fitted to the arc data, the rms being always less than a tenth of the spectral dispersion. The wavelength scale for each target spectrum was interpolated from the wavelength scales of two neighbouring arc spectra. These reduction processes were performed using the standard packages for long-slit spectra within iraf.
Only the cafos spectra —which have the widest wavelength coverage— were flux calibrated. The spectrophotometric standard BD +75∘ 325 observed with the same setup in order to correct for the instrumental response. The flux calibration, as well as all subsequent analysis on the whole data set were performed using Tom Marsh’s molly package.

| Date | Telescope | Exp. (s) | Coverage (h) |
|---|---|---|---|
| 2003 Mar 12 | INT | 1.05 | |
| 2003 Apr 07 | 2.2-m | 1.00 | |
| 2003 Apr 08 | 2.2-m | 0.99 | |
| 2003 Apr 09 | 2.2-m | 0.37 | |
| 2003 Apr 11 | 2.2-m | 0.95 | |
| 2003 Apr 22 | INT | 2.07 | |
| 2003 Apr 26 | INT | , | 1.36 |
3 Photometric variability
3.1 Long-term behaviour
Fig. 1 shows the long-term light curve of DW Cnc. The photometric measurements were taken from the AFOEV archive222ftp://cdsarc.u-strasbg.fr/pub/afoev/ and the VSNET333http://www.kusastro.kyoto-u.ac.jp/vsnet. A mean magnitude of is derived from the long-term light curve, with excursions of up to mag. This scatter is comparable with the short-term variation of the source (see below). No outburst has been recorded in the -year monitoring of DW Cnc. However, the system occasionally displays faint states down to at least . This is confirmed by the USNO-A2.0 measurements, which caught DW Cnc at and , whereas the DSS1 and DSS2 plates show DW Cnc at its typical brightness of . The magnitude range covered by the long-term light curve in Fig. 1 is consistent with that given by Stepanian (1982). Taken at face value, the long-term behaviour of DW Cnc resembles that of the VY Scl stars, which have high mass accretion rates and are found above the period gap.

3.2 The JKT and IAC80 light curves
The JKT and IAC80 light curves of DW Cnc clearly show short time-scale variability with a peak-to-peak amplitude of mag (Fig. 2). Inspection of the light curves by eye suggests a separation between consecutive maxima of min.
To explore the presence of periodicities in the data we computed an analysis-of-variance (AOV, Schwarzenberg-Czerny, 1989) periodogram of the whole photometric data set, which is shown in Fig. 3. The strongest peak is centred at min. The very complex alias structure of the periodogram (due to the coarse sampling) prevents an unequivocal determination of the maximum peak frequency to be made. sine fits to the entire data set folded over the alias signals contained in the range 35.37 to 39.38 cycles/day favour 37.39 cycles/day ( min; the error being half the FWHM of the peak). The periodograms also show significant power at around min. The ratio between the two strongest frequencies detected in the photometry is approximately 2 but, again, the inadequate sampling does not allow to address a definite conclusion as to whether the two frequencies are comensurate or not. Uemura et al. (2002) found two peaks in their power spectrum at 37.5 and 73.4 min, but their periodograms also display strong aliasing effects due to poor sampling. A more extensive photometric study is then fundamental to test in detail whether both periods are independent or not.
Fig. 4 shows all the photometric data folded on 38.51 min and averaged into 70 phase bins. The high degree of coherence in the photometric signal is remarkable, since it is detected at the same frequency (within the errors) in data spanning more than 4 years. This strongly suggests that its origin is closely related to a “stable clock” in the system, such as the orbital period or the spin period of the white dwarf.


Noticeably, the light curve exhibits a dip of at approximately maximum brightness, appearing every 38.51 minutes. The dips can be easily seen in the IAC80 light curve (bottom panel of Fig. 2). The total duration of one of these events is min, which makes it unlikely to be an eclipse by the secondary star. If that was the case the orbital period of DW Cnc should be 38.51 min, very much shorter that the observed minimum orbital period of CVs with non-degenerate secondaries and inconsistent with our spectroscopic study described below.
4 The average spectrum and line profile variations
In Fig. 5 we show the average of the 20 cafos spectra. The spectrum of DW Cnc is dominated by Balmer and He i emission lines superimposed on a blue continuum. There is noticeable He ii 4686 emission, which indicates the presence of a source of ionising photons in the system. The Bowen blend of C/N and several lines of Fe ii are also present. There are no obvious absorption features from either the secondary or the white dwarf. In Table 3 we show some line parameters as measured in the average spectrum.
We have extended the spectral energy distribution (SED) of DW Cnc into the infrared using its 2MASS magnitudes (, , ). A fit to the combined optical/IR SED of DW Cnc (after converting the IR magnitudes into fluxes) gives , which is exactly the spectral slope of a steady-state, optically thick accretion disc (Lynden-Bell, 1969).


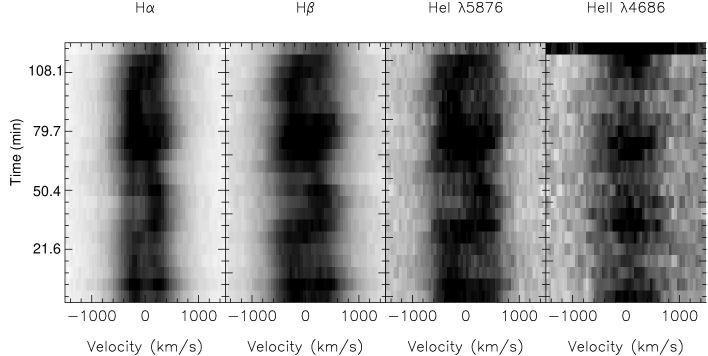
The line profiles, with the exception of He ii 4686, are clearly double-peaked ( Å separation in H), indicating the presence of an accretion disc. Fig. 6 presents the evolution of the H and He i 5876 profiles for the night of 2003 April 22. The relative intensity of the two peaks clearly changes with time. At some phases the lines turn single-peaked, showing a nearly flat-topped profile. Furthermore, the profiles display asymmetric wings extending up to km s-1. All of this suggests the presence of at least another component in the Balmer and He i lines such as an emission S-wave moving accross the double-peaked profile, as well as emission from material moving very close to the primary. To investigate this in more detail we constructed trailed spectrograms of the April 22 H, H, He i 5876 and He ii 4686 lines after normalizing the spectra with a spline fit to the continuum (see Fig. 7). An emission S-wave with a semi-amplitude of km s-1 is indeed detected with the same phasing in H, H and He i 5876. This value is consistent with the velocity semi-separation of the double peak ( km s-1 in H), suggesting that the emission S-wave originates in the outer regions of the disc, possibly at the location of the bright spot.
| Line | Centre | EW | FWHM |
|---|---|---|---|
| (km s-1) | (Å) | (km s-1) | |
| H | |||
| H | |||
| H000From 2003 March data. | |||
| H | |||
| He ii 4686 | |||
| He i 5876 | |||
| He i 4472 |
Remarkably, the strength of the Balmer, He i and He ii 4686 lines suffers a significant increase around spectra number 14 (see Fig. 7), which is probably caused by enhanced emission since the continuum is not seen to significantly drop in the non-normalized spectra. Similar enhancements seem to take place around spectra number and 7. These “flares” are more evident in the He ii 4686 trailed spectra, which does not show the S-wave observed in the Balmer and He i lines. The flares repeat every min, a time scale comparable with the photometric variability. The same behaviour is observed in the spectra taken on April 26.
5 The orbital period of DW Cnc
5.1 Radial velocity variations
Visual inspection of our trailed spectrograms (Fig. 7) reveals an S-wave modulated at a a period of . If we identify, by analogy to most other CVs, the observed velocity variation of the S-wave with the orbital revolution of the system, the orbital period of DW Cnc is very close to the observed period minimum for hydrogen-rich CVs.
We have measured the radial velocities of H and He i 5876 for all the cafos and ids spectra. We first rebinned the normalized spectra to a constant velocity scale for each line. The radial velocities were then derived by correlating the individual profiles with a single Gaussian template. The FWHM of the Gaussian function was chosen either as the FWHM of the corresponding line measured in the average spectrum (see Table 3), or fixed to km s-1. We will refer to the two FWHM in the following as “broad” and “narrow”, respectively. The correlation with the narrow Gaussian is intended to follow the motion of the S-wave, which is much narrower than the double-peaked line profile. The resulting radial velocity curves are shown in Fig. 8.
The radial velocities obtained by correlating with the broad Gaussian display an unusual morphology, as maxima and minima do not have the same velocity. In the curves corresponding to the April 22 data high- and low-velocity maxima seem to alternate. The separation between consecutive maxima is d for all the lines, very close to the main photometric period. A different picture arises when the radial velocities are measured by correlation with the narrow Gaussian. Now, the radial velocity curves seem to trace the motion of the S-wave (especially in the April 22 data). They are modulated at a period of d, approximately twice the period obtained when using the broad Gaussian template, i.e. within the range in which we expect the orbital period of DW Cnc to be.
We computed AOV periodograms for all the H and He i 5876 radial velocity curves. These are shown in Fig. 9. The periodograms reflect the behaviour observed in the double- and single-humped radial velocity curves. The correlation with the broad Gaussian results in periodograms with most of the power around 36 cycles/day, whilst those measured using the narrow Gaussian have the strongest signal at about half this frequency. Unfortunately, the complex alias structure of the periodograms prevents us to select an unique value of the “best period”. Table 4 lists the periods of the strongest peaks and their neighbour aliases in order of decreasing power.

In view of the information extracted from the radial velocities we strongly favour an orbital period in the range d. The unusual shape of the radial velocity curves obtained from the correlation with the broad Gaussian seems to point to the existence of at least another emission component which contaminates the radial velocity curves. Hence, the possibility of having the velocities modulated at two different periods can not be discarded.

5.2 V/R ratios
So far, the most reliable piece of information for the determination of the orbital period we have is the motion of the S-wave, which is especially prominent in He i 5876 and is very like to come from the bright spot. The effect of the S-wave on the double-peaked line profiles is such that we expect the ratio between the blue and red peak intensities to be modulated at the orbital period. We have computed these / ratios for the H, H, and He i 5876 profiles. The periodograms of the / curves are displayed in Fig. 10.
The cleanest modulation is obtained when folding / curves on min. The quoted error represents an average value of half the FWHM of the corresponding peak in the periodograms. This period is consistent with one of the aliases seen in the periodograms of the radial velocity curves obtained by correlation with the narrow Gaussian template (see Table 4). The H velocities showed the best smoothest modulation at 76.94 min, which is the second strongest alias observed in the H / ratios. Based on our spectroscopic data, we favour 86.1 min as the orbital period of DW Cnc, even though we can not exclude the d-1 and d-1 aliases.
Shortly before the submission of this paper, we became aware of a more extensive spectroscopic study carried out by J. Thorstensen (private communication). He finds two distinct periods in his radial velocity measurements which are very close to our best estimate of the orbital period (based on the ratios) and to the strongest peak detected in our photometry.

| Line | Method | Period | Aliases |
|---|---|---|---|
| (min) | (min) | ||
| H | km s-1 | 39.60 | 41.90 |
| 38.59 | |||
| H | km s-1 | 76.94 | 86.12 |
| 81.26 | |||
| He i 5876 | km s-1 | 39.60 | 40.75 |
| 38.59 | |||
| He i 5876 | km s-1 | 91.58 | 86.12 |
| 81.26 |
6 He ii 4686 equivalent widths
The He ii 4686 trailed spectra presented in Fig. 7 show that this line experiences flares which repeat in a periodic fashion. The separation between two consecutive flares is consistent with the photometric period, so we decided to compute the EW of the He ii 4686 and perform a period analysis. The EW was measured in the line velocity interval km s-1 to avoid contamination by the nearby Bowen blend and He i 4713 line. The AOV periodogram of the resulting EW curve is shown in Fig. 11. The strongest peak is located at min, which is consistent with what is found in the photometry and Thorstensen’s radial velocities.
Our photometric and spectroscopic data then seem to reflect the presence of two independent modulations. The fact that they are also found in the radial velocities suggests that line emission is produced in different locations. A modulation of the radial velocities with the spin period of the white dwarf is observed in most intermediate polar (IP) CVs which suggests that the 38.58-min oscillation might represent (or might be related to) the spin period of the white dwarf.


7 Discussion
7.1 DW Cnc as a VY Scl star
We have shown that DW Cnc has a likely orbital period of 86.10 min, a value very close to the observed period minimum of hydrogen-rich CVs. This observed period minimum has been very early explained by (Paczyński, 1981) as the consequence of the secondary star turning from a (nearly) main-sequence star into a degenerate object and the corresponding change of its mass-radius relation. However, models including more detailed stellar physics notoriously predict the minimum period to be near 65 min, which is in strong disagreement with the observations. The mismatch between theory and observations can be resolved if an additional angular momentum loss mechanism besides gravitational is active in short period CVs (e.g. Patterson, 1998; King et al., 2002).
The orbital period range min is populated primarily by SU UMa dwarf novae and by polars (CVs containing a strongly magnetic white dwarf which prevents the formation of a disc). A fair fraction ( 15 per cent) of the dwarf novae belongs to the WZ Sge sub-class, showing infrequent but huge amplitude outbursts. As far as we are aware, no outburst of DW Cnc has ever been recorded (Section 3.1, Fig. 1). Combining the “normal” brightness of DW Cnc () with the large number of all-sky surveys and amateur observers scanning the sky it appears rather unlikely that possible outbursts of DW Cnc have been overlooked. On the contrary, there is multiple evidence that DW Cnc displays occassional low states, dropping by mag below its typical brightness. This behaviour is reminiscent of the VY Scl stars, which are high mass-transfer CVs found above the period gap, typically in the h period range. Combining the long-term behaviour of DW Cnc with the fact that the slope of its optical/IR spectral energy distribution is consistent with that of a steady-state accretion disc (Section 4), we suggest that the mass transfer rate in this system must be unusually high for its orbital period, keeping its accretion disc persistently in the hot, ionised state.
Recently, Hameury & Lasota (2002) have suggested that the absence of outbursts in the VY Scl stars during low state (when the mass transfer rate is believed to be sufficiently low for thermal disc instabilities to occur) could be due to the truncation of the accretion disc by the primary’s magnetic field. This hypothesis is compatible with the results presented in this paper, as DW Cnc clearly shows VY Scl-like low states and the coherent oscillations detected in its optical light curve are very likely due to the rotation of a magnetic white dwarf.
Other CVs commonly showing VY Scl-like low states are the SW Sex stars (see e.g. Martínez-Pais et al. 1999; Taylor et al. 1999; and Rodríguez-Gil & Martínez-Pais 2002 for an updated review of the properties of the SW Sex stars). These CVs have been recently proposed as magnetic accretors based on the detection of variable circular polarization and emission-line flaring (Rodríguez-Gil et al. 2001), which gives further support to the idea of the VY Scl states being caused by a combination of high mass-transfer rate and magnetic truncation of the inner disc.
7.2 A possible intermediate polar scenario
The optical spectrum of DW Cnc differs from those of other short-period dwarf novae by the presence of an unusually strong He ii 4686 line, indicating the presence of high-energy photons in the system. Moreover, He ii 4686 exhibits a remarkable behaviour. It does not display the S-wave seen in the Balmer and He i lines and its EW is modulated at a period of 38.58 min (see Fig. 11). If the 86.10-min modulation represents the actual orbital period (and there is strong evidence for that), the He ii 4686 modulation is not likely to be related to the orbital motion. The same modulation is seen in the photometry which we have shown to be highly coherent. Hence, the 38.58-min period must be related to another stable clock in the system, most likely to the asynchronous rotation of a magnetic white dwarf.
It is interesting to note that the photometric and spectroscopic behaviour of DW Cnc is similar in many aspects to that of V1025 Cen (Buckley et al., 1998), a confirmed intermediate polar CV. This system has an orbital period of 84.6 min and a spin period of 35.8 min (nearly half the orbital period). The optical spectrum of V1025 Cen is nearly identical to that of DW Cnc, containing strong multi-component emission lines. The radial velocity curves of V1025 Cen reveal two periodicities, reflecting both the spin and the orbital motion. Our identification of two different periodicities in the radial velocity curves of DW Cnc at 38.58 and 86.10 minutes points to the same origin. Unfortunately, our photometric and spectroscopic data are not sufficient to unequivocally pinpoint the complex interplay between orbital, spin and sideband periods.
An important difference with V1025 Cen is that DW Cnc has not been detected in the ROSAT All Sky Survey (Voges et al. 2000). The galactic column density of neutral hydrogen in the direction of DW Cnc is not very high (), making it unlikely that the non-detection is due to absorption. It may, however, be that DW Cnc was in one of its low states during the ROSAT observation, and therefore too faint to be detected by the satellite. A detailed study aiming at the detection of X-rays modulated at the suspected white dwarf spin period is mandatory for the confirmation of DW Cnc as an IP.
8 Conclusions
In what follows we summarize our results:
-
1.
The emission lines of DW Cnc have a double-peaked profile, indicating the presence of a moderately-inclined accretion disc in the system. The Balmer and He i lines show an intense S-wave moving within the double peaks. None of the stellar components is detected.
-
2.
We have found the orbital period of DW Cnc to be most likely min, which places DW Cnc very close to the observed minimum period of hydrogen-rich CVs.
-
3.
The Balmer and He i radial velocity curves show a double-periodic morphology with modulations both at the orbital period and 38.58 min. In addition, the EW of the He ii 4686 line is also modulated at the latter period .
-
4.
The photometric light curves also show a coherent modulation at 38.51 min, consistent with the short period found in the radial velocities and the He ii 4686 EWs. We suggest that this variation is produced by the asynchronous rotation of a magnetic white dwarf.
-
5.
No dwarf nova outburst has ever been observed in DW Cnc. Instead, the system displays low states during which its brightness drop by mag, resembling the VY Scl stars. The optical/IR spectral energy distribution of DW Cnc is very similar to that of a steady-state accretion disc. Combining all evidences, DW Cnc appears to be a high-mass transfer system below the period gap.
-
6.
Despite the lack of significant X-ray emission from DW Cnc, the observed behaviour (both photometric and spectroscopic) is very similar to that of the IP V1025 Cen, and we suggest that DW Cnc is another short-period intermediate polar.
Despite its brightness, DW Cnc remains a poorly studied CV. Although we have provided evidence that points to a magnetic nature, it must be confirmed by means of more extensive photometry and higher-resolution spectroscopy. UV, X-ray, and polarimetric observations will also provide fundamental information.
Acknowledgments
We thank the anonymous referee for his/her valuable comments on the original manuscript. We are very grateful to John Thorstensen for sharing his results with us. PRG, BTG and SAB thank PPARC for support through a PDRA grant, an Advanced Fellowship, and a postgraduate studentship, respectively. The Isaac Newton Telescope and the Jacobus Kapteyn Telescope are operated on the island of La Palma by the Isaac Newton Group in the Spanish Observatorio del Roque de los Muchachos of the Instituto de Astrofísica de Canarias. The IAC80 telescope is operated on the island of Tenerife by the Instituto de Astrofísica de Canarias in the Spanish Observatorio del Teide of the Instituto de Astrofísica de Canarias. Based in part on data obtained at the German-Spanish Astronomical Centre, Calar Alto, operated by the Max-Planck-Institute for Astronomy, Heidelberg, jointly with the Spanish National Commission for Astronomy. We acknowledge the use of data from the Isaac Newton Group archive. The use of the molly and trailer packages developed by Tom Marsh is also acknowledged.
References
- Araujo-Betancor et al. (2003) Araujo-Betancor S., Gänsicke B. T., Hagen H.-J., Rodriguez-Gil P., Engels D., 2003, A&A, 406, 213
- Buckley et al. (1998) Buckley D. A. H., Cropper M., Ramsay G., Wickramasinghe D. T., 1998, MNRAS, 299, 83
- Gänsicke et al. (2000) Gänsicke B. T., Fried R. E., Hagen H.-J., Beuermann K., Engels D., Hessman F. V., Nogami D., Reinsch K., 2000, A&A, 356, L79
- Gänsicke et al. (2002) Gänsicke B. T., Hagen H. J., Engels D., 2002, in Gänsicke B. T., Beuermann K., Reinsch K., eds, The Physics of Cataclysmic Variables and Related Objects On the space density of cataclysmic variables. ASP Conf. Ser. 261, pp 190–199
- Hameury & Lasota (2002) Hameury J. M., Lasota J. P., 2002, A&A, 394, 231
- Horne (1986) Horne K., 1986, PASP, 98, 609
- King et al. (2002) King A. R., Schenker K., Hameury J. M., 2002, MNRAS, 335, 513
- Kopylov et al. (1988) Kopylov I. M., Lipovetsky V. A., Somov N. N., Somova T. A., Stepanian J. A., 1988, Afz, 28, 287
- Lynden-Bell (1969) Lynden-Bell D., 1969, Nat, 223, 690
- Martínez-Pais et al. (1999) Martínez-Pais I. G., Rodríguez-Gil P., Casares J., 1999, MNRAS, 305, 661
- Paczyński (1981) Paczyński B., 1981, AcA, 31, 1
- Patterson (1998) Patterson J., 1998, PASP, 110, 1132
- Rodríguez-Gil et al. (2001) Rodríguez-Gil P., Casares J., Martínez-Pais I. G., Hakala P., Steeghs D., 2001, ApJ, 548, L49
- Rodríguez-Gil & Martínez-Pais (2002) Rodríguez-Gil P., Martínez-Pais I. G., 2002, MNRAS, 337, 209
- Schwarzenberg-Czerny (1989) Schwarzenberg-Czerny A., 1989, MNRAS, 241, 153
- Stepanian (1982) Stepanian J. A., 1982, Peremennye Zvezdy, 21, 691
- Taylor et al. (1999) Taylor C. J., Thorstensen J. R., Patterson J., 1999, PASP, 111, 184
- Uemura et al. (2002) Uemura M., Kato T., Ishioka R., Novak R., Pietz J., 2002, PASJ, 54, 299
- Voges et al. (2000) Voges W., et al., 2000, IAU Circ., 7432, 3
- Warner (1995) Warner B., 1995, Cataclysmic Variable Stars. Cambridge University Press, Cambridge