Tidal Streams and Low Mass Companions of M31
Abstract
We have imaged the extended HI environment of M31 with an unprecedented combination of high resolution and sensitivity. We detect a number of distinct High Velocity Cloud components associated with M31. A sub-set of the features within 30 kpc appear to be tidal in origin. A filamentary “halo” component is concentrated at the M31 systemic velocity and appears to extend into a “bridge” connecting M31 and M33. This may represent condensation in coronal gas. A population of discrete clouds is detected out to radii of about 150 kpc. Discrete cloud line-widths are correlated with HI mass and are consistent with a 100:1 ratio of dark to HI mass. These may be the gaseous counterparts of low-mass dark-matter satellites. The combined distribution of M31’s HVC components can be characterized by a spatial Gaussian of 55 kpc dispersion and yields an NHI distribution function which agrees well with that of low red-shift QSOs.
ASTRON, P.O. Box 2, 7990 AA Dwingeloo, The Netherlands
Department of Physics and Astronomy, Johns Hopkins University, 3400 N. Charles St., Baltimore MD 21218-2695, U.S.A.
1. Introduction
The high velocity cloud (HVC) phenomenon has been under study for some 40 years, since the first detections of 21 cm emission from atomic hydrogen at velocities far removed from those allowed by rotation in the Galaxy disk (Muller, Oort & Raimond 1963). Several explanations have been put forth for their interpretation, including a galactic fountain, infall of circum-galactic gas, tidal debris from mergers and sub-galactic-mass companions. These last two processes in particular have a direct bearing on this meeting. The suggestion has been made that at least one component of the Galactic HVCs, the so-called CHVCs (Braun & Burton 1999, Blitz et al. 1999) might be the gaseous counterpart of low-mass dark-matter satellites. A definitive explanation for the Galactic HVCs is hampered by the extreme difficulty of obtaining direct distance estimates. Although this difficulty can, in principle, be circumvented by studying external galaxies, it has proven extremely difficult to achieve the necessary combination of high spatial resolution, low mass sensitivity and large field-of-view in practise (Braun & Burton 2001). HI studies of nearby galaxies have often revealed features that could be termed HVCs (eg. in NGC 628 by Kamphuis & Briggs 1992), but typically only one or a few of such features have been detected near each host at masses as low as about 107 M⊙. Only in the last few years has sufficient sensitivity and resolution been obtained to begin revealing diffuse systems of peculiar velocity HI, such as the slowly rotating “halo” component of NGC 2403 (Fraternali et al. 2002).
We have undertaken a program of three seperate surveys (defined below) to determine the HI content in the environment of our nearest spiral neighbour, M31, with high sensitivity and over a very wide range of spatial scales. This has allowed us to detect several distinct classes of HVC components associated with M31. Indications are seen for most or all of the hypothesized HVC explanations listed above. While the origin of all components is not yet firmly established, the relative importance of the various processes is at last beginning to be constrained.
2. Three HI Surveys of the M31 Environment
2.1. The WSRT wide-field Survey
The WSRT array was used to acquire 380 hours of observing in the period Aug. 2002 to Oct. 2002 to complete a drift-scan survey centered approximately on the position of M31 and Nyquist-sampled over 6030∘in R.A.Dec. The primary data consists of auto-correlation spectra with an effective angular resolution of 49′ FWHM, although cross-correlation data were also acquired simultaneously. An rms sensitivity of about 18 mJy/Beam at a velocity resolution of 17 km/s was realized between V km/s. Further details of this survey together with an analysis of the detected background galaxies can be found in Braun, Thilker & Walterbos (2003). The analysis of the Local Group features is presented in Braun & Thilker (2003). At the distance of M31, the angular resolution and field-size correspond to about 11 kpc over a region of 800400 kpc, while the RMS column density sensitivity was 41016cm-2. This can be compared to the recently completed HIPASS survey (Barnes et al. 2001) which reaches a similar point source flux sensitivity of 14 mJy/Beam at a velocity resolution of 18 km/s in a 155 beam, but an order of magnitude poorer column density sensitivity of about 41017cm-2.
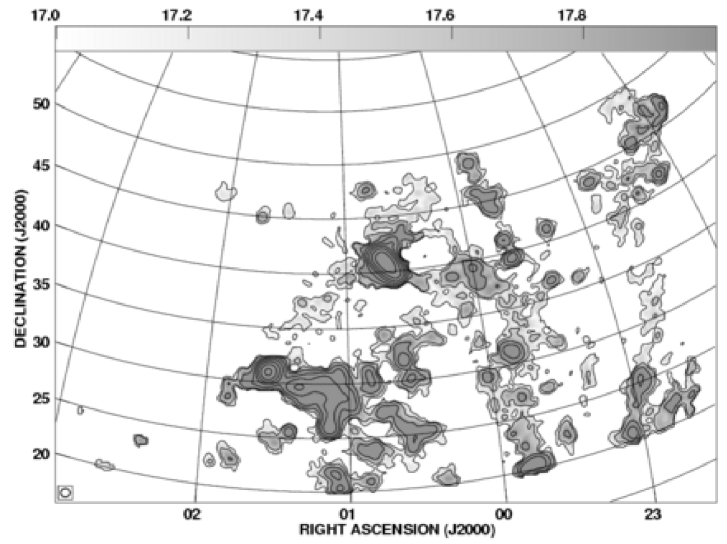
An overview of detected emission features which were distinct from the intermediate velocity wings of Galactic emission at negative LSR velocities is shown in Figure 1. We detect high velocity HI emission at a column density in excess of our 2 limit of about 1017cm-2 from fully 29% of the area of our 1800 deg2 survey field. The detected emission is due to a mix of discrete and diffuse components. The brightest discrete features visible in this image are M31 ()=(00:43,+41:16)), M33 (01:34,+30:40) and Wright’s HVC (01:15,+29:00). Some 95 additional discrete HVCs are detected, of which more than 80% are isolated from any diffuse HI emission at a column density of 1.51017cm-2.
Diffuse HI emission is also detected in the form of: 1) a “western filament” extending north-north-west from ()=(23:00,+20) to (22:30,+35), 2) an “eastern loop” extending to the north from (23:40,+20) to (23:40,+42) and arcing back down to (01:00,+20) and 3) a diffuse bridge of emission that extends between M31 and M33 and continues to the north-west of M31 to () = (00:20,+48). The line-of-sight velocity varies continuously along each of these features, with the M31/M33 “bridge” connecting the systemic velocities of these two galaxies.
2.2. The GBT Survey
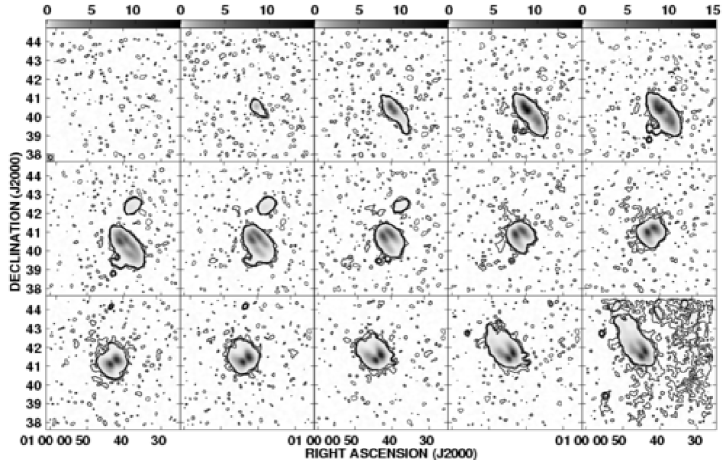
The recently completed GBT was used for about 70 hours observing in the period July 2002 to Sept. 2002 to complete six Nyquist-sampled on-the-fly coverages of a 77∘field centered on M31 (as well as a 55∘field centered on M33, which we will discuss elsewhere). An rms sensitivity of about 6.6 mJy/Beam was realized at a velocity resolution of 18 km/s (although the velocity resolution was 1 km/s). The angular resolution and field-size correspond to about 2 kpc over a region of 9595 kpc, while the RMS column density sensitivity was about 1.51017cm-2 (at 18 km/s). Further details of this survey and it’s analysis can be found in Thilker et al. (2003).
An overview of the GBT survey data is given in Figure 2, as a series of channel maps after a mild spatial and velocity smoothing (to 3 kpc, 36 km/s). A population of at least 20 faint and compact discrete HI features is apparent at heliocentric velocities between about 520 and 180 km/s. Galactic foreground confusion limits detections to velocities more negative than about 180 km/s. In addition, a diffuse filamentary component can be seen centered spatially on M31 near the systemic velocity of 300 km/s.
2.3. The WSRT Mosaic
The WSRT array was used to acquire some 350 hours of observing in the period Aug. 2001 to Jan. 2002 distributed over 163 pointing centers on a 63∘Nyquist-sampled grid aligned with the M31 major axis. Joint deconvolution of this synthesis data, together with total power data, required some 3 months processing on a 4-CPU machine that was kindly made available to us for this purpose by the PuMa team of the University of Amsterdam. An rms sensitivity of about 1.4 mJy/Beam was realized at a velocity resolution of 2 km/s. The maximum angular resolution of 15′′corresponds to about 50 pc resolution over a region of 8040 kpc. The column density sensitivity (at 20 km/s) is 1.0, 3.5, 11 and 241018cm-2 at angular resolutions of 120, 60, 30 and 20′′. A more extensive description of the survey and it’s scientific goals can be found in Braun et al. (2002, 2003).
The combined data is presented in Braun et al. (2002), where the peak brightness temperature is shown at the full spatial and velocity resolution. In addition to a very detailed view of the M31 disk (the largest ratio of FOV to beam-size yet acquired in HI for any galaxy), the compact cores are detected of many HVC features which are 10’s of kpc from the nearest normal disk emission.
3. Results
3.1. Foreground Features: The Magallenic Stream
As can be seen in Fig. 1, high velocity HI features are almost ubiquitous from our vantage point in the Galaxy, once sufficient column density sensitivity is employed. Fortunately, the line-of-sight velocity can be used to distinguish different components from one another. Of the three diffuse features noted previously in the wide-field survey field-of-view, the first two (the “western filament” and “eastern loop”) constitute a previously undetected extension of the Magellanic Stream (MS).
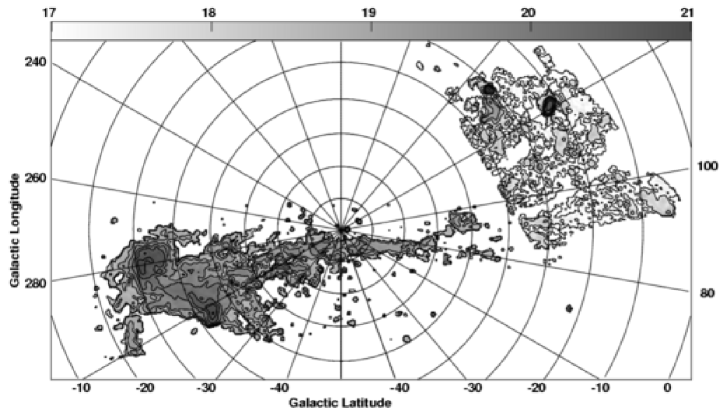
The full extent of the Stream can be seen in Fig. 3, where we have combined the HIPASS data of Putman et al. (2003) with the WSRT wide-field survey. Note that the HIPASS data is limited by sensitivity to log(NHI) 18.3 while the WSRT data reach an order of magnitude deeper for these diffuse structures, to log(NHI) 17.3. It is important to realize that only a sub-set of the diffuse features seen in this figure are kinematically associated with the MS (Braun & Thilker 2003). This sub-set displays a smoothly varying, single-valued radial velocity. Additional diffuse and discrete components are detected which may well have other origins.
Both the approximate spatial distribution and the radial velocity of the “western filament” and “eastern loop” extensions of the MS were correctly predicted in the models of Gardiner & Noguchi (1996) and Gardiner (1999). These models seem to require the inclusion of some ram pressure interaction with the Galactic halo although they are dominated by gravitational interaction. In these models the orbit of the Magellanic Clouds with the Galaxy varies between about 150 and 50 kpc radius. The Clouds are currently near peri-galacticon, while the most distant trailing portions of the Stream (which we have now detected) trace the apo-galacticon portion of the orbit near 150 kpc, where the Clouds where located some 0.9 Gyr ago.
3.2. The M31 HVC Populations
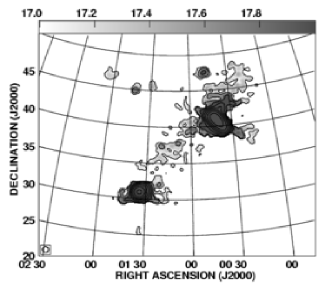
Several different components of high velocity HI are detected in our three surveys which appear to be intimately related to M31. The largest of these is the diffuse bridge of HI connecting the systemic velocities of M31 and M33 and continuing to the north-west of M31 in the anti-M33 direction. Superposed on this distribution is a population of very faint, discrete HI clouds with a very broad range of radial velocities (at least 520 to 180 km/s) that is only detected within a radius of about 15∘(corresponding to 200 kpc) of M31. This can be compared with the normal disk rotation of M31 which extends from about 600 to 20 km/s. The most extreme negative velocities of previously cataloged (C)HVCs (De Heij et al. 2002, Putman et al. 2002) are also in this general direction, but they do not exceed 465 km/s. The M31 components are shown in left-hand panel of Fig. 4 as they appear in our wide-field survey after blanking of all features which have kinematic continuity with other, presumed fore-ground, HVC features; most notably the Magellanic Stream and Wright’s Cloud.

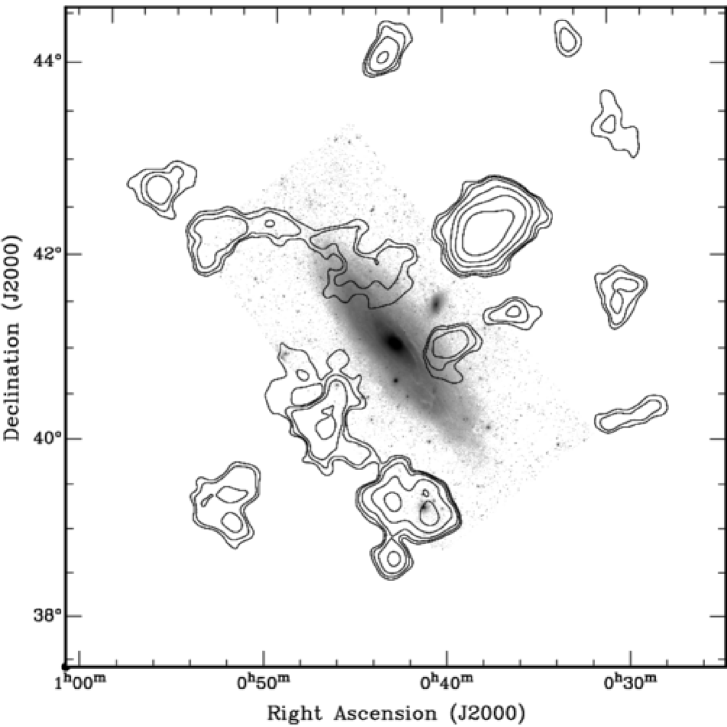
The faint HVC poulation near M31 is confirmed in our GBT data of the central 9595 kpc. All features in this survey which could be cleanly separated from the M31 disk emission are shown in Fig. 5 overlaid on a V-band image of the galaxy. The radial velocities of the discrete HVCs reflect the general pattern of M31 disk rotation, with the most negative occurring in the south-west and the most positive in the north-east. A sub-set of the discrete features are organized into elongated structures with a smoothly varying radial velocity, suggestive of a tidal origin. The series of features, extending to about 25 (35 kpc) south of the M31 nucleus is the most obvious of these. This feature is partially coextensive with the “giant stellar stream” of M31 discovered by Ibata et al. (2001). Another feature seems likely to be related to NGC 205, given it’s modest offset in position and velocity from that galaxy. While this sub-set of features is strongly suggestive of a tidal origin, the same indications do not apply to the majority of detected features.
The GBT survey also detects a centrally concentrated filamentary component near the M31 systemic velocity, reminiscent of the “bridge” feature seen on larger scales. We have recently been able to confirm our faintest discrete HVC detections, together with the brightest portions of the “bridge” with additional pointed GBT observations. The origin of these diffuse HVC components is not clear, although they may be a manifestation of cooling in a tenuous inter-galactic medium. In this view, HVCs condense from, and remain confined by, the bulk of coronal gas pervading the Local Group. Sembach et al. (2003) present evidence for an extended and highly ionized Galactic corona or Local Group medium traced by high-velocity OVI absorption.
The large-scale distribution of the M31 HVC population is illustrated in the right-hand panel of Fig. 4, where HI column density has been azimuthally averaged and plotted as a function of projected radius. The secondary peak in the distribution near 200 kpc is due to M33. Two Gaussian curves are overlaid on the distribution; a central disk component with spatial disperion, =8 kpc and peak log(NHI) =20.95 as well as an extended circum-galactic component of =55 kpc and peak log(NHI) =17.2. As can be seen in the left-hand panel of Fig. 4 as well as Fig. 5, the HVC distribution is actually a combination of discrete and (elliptical) diffuse components, rather than simply a symmetric Gaussian.
A possible source of high velocity HI near M31 might be the gas associated with a putative population of low mass dark-matter halos. Current numerical simulations of the Local Group in a CDM cosmology predict a large population of low mass DM halos surviving to the present epoch (Klypin et al. 1999, Moore et al. 1999) which dramatically outnumber known dwarf galaxies. If the M31 HVCs were tracers of substantial dark-matter concentrations, then this should be directly reflected in their internal linewidths. We plot the observed HI mass versus FWHM line-width for discrete clouds in the left-hand panel of Fig. 6. The line-width distribution has an approximate lower bound roughly consistent with thermal broadening for gas at 104 K (FWHM = 24 km/s). A systematic increase in FWHM line-width is observed with increasing HI mass, reaching some 70 km/s for the clouds near 106 M⊙. Although Davies’ HVC is significantly offset from the remainder of the distribution in the figure, high-resolution imaging has revealed much higher internal line-widths in that object as well De Heij et al. (2002). To demonstrate the expected distribution of line-width with mass, we have over-plotted a curve corresponding to , where the characteristic discrete cloud radius, R, has been held constant at 500 pc, based on our WSRT mosaic detections of some of the cloud cores. This curve, corresponding to a dark to HI mass ratio of about 100:1, is not intended to represent a fit to the observed data, but merely provide a basis for comparison. The hypothesis of a kinematically dominant dark-matter component appears to be consistent with the observed line-widths of the discrete M31 HVCs.
Another aspect of the dark-matter mini-halo scenario that can be checked is the expected number of such objects in the appropriate mass range in the vicinity of M31. Sternberg et al. (2002) predict dark matter mini-halos associated with gravitationally confined HI within a radius of 40 kpc around M31, based on the simulations of Klypin et al. (1999) and Moore et al. (1999). This is fully consistent with the 20 discrete M31 HVC’s we have detected. The Sternberg et al. calculations also suggest that circum-galactic objects of such low mass and peak HI column density should be only % neutral, implying and .


3.3. M31 HVCs and QSO Absorption Lines
Our results for M31 can be placed in a broader context by comparing the properties of the extended HVC population we detect with those probed by observations of Ly absorption toward low red-shift QSOs. Charlton et al. (2000) have previously suggested making such a comparison. We have calculated the distribution function of HI column density by combining the data from all three of our HI surveys of M31 in the right-hand panel of Fig. 6. The dashed line is from the WSRT mosaic with 1′ resolution over 8040 kpc, the dotted and solid lines from our GBT survey with 9′ resolution over 9595 kpc and the dot-dash line from the wide-field WSRT survey with 48′ resolution out to about 150 kpc projected radius. The column density data was normalized with the space density of galaxies of M31’s HI mass (using the HIPASS BGC HIMF of Zwaan et al. 2003). The filled circles with errorbars in the figure are the low red-shift QSO absorption line data as tabulated by Corbellli & Bandiera (2002). As can be seen in the figure, very good agreement is found in both the shape and normalization of the distribution function. It seems that the upper five orders of magnitude of the HI distribution function, between about log(NHI) = 17 and 22, can be accounted for by comparable HVC populations associated with M∗ galaxies.
References
Barnes, D. G., Staveley–Smith, L., de Blok, W. J. G., et al. 2001, MNRAS, 322, 486
Blitz, L., Spergel, D. N., Teuben, P. J. et al. 1999, ApJ, 514, 818
Braun, R., Burton, W. B. 1999, A&A, 341, 437
Braun, R., Burton, W. B. 2001, A&A, 375, 219
Braun, R., Thilker, D. A., Walterbos, R. A. M., 2003, A&A, 406, 829
Braun, R., Thilker, D. A. 2003, A&A, submitted
Braun, R., Thilker, D. A., Corbelli, E., Walterbos,
R. A. M. 2002,
http://www.astron.nl/newsletter/2002-1/index.html
Braun, R., Thilker, D. A., Corbelli, E., Walterbos, R. A. M. 2003, A&A, in prep.
Charlton, J. C., Churchill, C. W., Rigby, J. R. 2000, ApJ 544, 702
Corbelli, E., Bandiera, R. 2002, ApJ, 567, 712
de Heij, V., Braun, R., Burton, W. B. 2002, A&A, 391, 67
de Heij, V., Braun, R., Burton, W. B. 2002, A&A, 391, 159
Gardiner, L. T., Noguchi, M. 1996, MNRAS, 278, 191
Gardiner, L. T., 1999, in ASP Conf. Ser. Vol. 166, High-Velocity Clouds, eds. B. Gibson & M. Putman (San Franciscio: ASP), 292
Fraternali, F., van Moorsel, G., Sancisi, R., Oosterloo, T. 2002, AJ, 123, 3124
Ibata, R., Irwin, M., Lewis, G. et al. Nature, 412, 49
Kamphuis, J. & Briggs, F. 1992, A&A, 253, 335
Klypin, A., Kravtsov, A. V., Valenzuela, O., Prada, F. 1999, ApJ, 522, 82
Moore, B. et al. 1999, ApJ, 524, L19
Muller, C. A., Oort, J. H., & Raimond, E. 1963, C.R.Acad.Sci. Paris, 257, 1661
Putman, M. E. de Heij, V., StavelySmith, L., et al. 2002, AJ, 123, 873
Putman, M. E., StavelySmith, L., Freeman, K., et al. 2003, ApJ, 586, 170
Sembach, K. R., Wakker, B. P., Savage, B. D. 2003, ApJS, 146, 165
Sternberg, A., McKee, C. F., Wolfire, M. G. 2002, ApJS, 143, 419
Thilker, D. A., Braun, R., Walterbos, R. A. M., et al. 2003, ApJL, in press
Zwaan, M. A., Staveley–Smith L., Koribalski, B. S., et al. 2003, AJ, 125, 2842