11email: mira.veron@oamp.fr; philippe.veron@oamp.fr 22institutetext: Byurakan Astrophysical Observatory and Isaac Newton Institute of Chile, Armenian branch, Byurakan 378433, Aragatzotn province, Armenia
22email: bal@moon.yerphi.am; aregmick@apaven.am; sanna@eugene.yerphi.am 33institutetext: INAOE, Apdo. postal 51 y 216, 72000 Puebla, Pue., Mexico
33email: rmujica@inaoep.mx; vahram@inaoep.mx 44institutetext: Hamburger Sternwarte, Gojenbergsweg 112, 21029 Hamburg, Germany
44email: dengels@hs.uni-hamburg.de; fzickgraf@hs.uni-hamburg.de 55institutetext: Max-Planck-Institute für extraterrestrische Physik, Postfach 1312, D-85741, Garching, Germany
55email: whv@mpe-garching.mpg.de 66institutetext: National astronomical observatories, Beijing 100012, China
66email: dwxu@bao.ac.cn
Optically bright Active Galactic Nuclei in the ROSAT-Faint Source Catalogue††thanks: Tables 2, 3 and 4 are only available in electronic form at http://www.edpsciences.org
To build a large, optically bright, X-ray selected AGN sample we have correlated the ROSAT-FSC catalogue of X-ray sources with the USNO catalogue limited to objects brighter than O=16.5 and then with the APS database. Each of the 3 212 coincidences was classified using the slitless Hamburg spectra. 493 objects were found to be extended and 2 719 starlike. Using both the extended objects and the galaxies known from published catalogues we built up a sample of 185 galaxies with OAPS17.0 mag, which are high-probability counterparts of RASS-FSC X-ray sources. 130 galaxies have a redshift from the literature and for another 34 we obtained new spectra. The fraction of Seyfert galaxies in this sample is 20%. To select a corresponding sample of 144 high-probability counterparts among the starlike sources we searched for very blue objects in an APS-based color-magnitude diagram. Forty-one were already known AGN and for another 91 objects we obtained new spectra, yielding 42 new AGN, increasing their number in the sample to 83. This confirms that surveys of bright QSOs are still significantly incomplete. On the other hand we find that, at a flux limit of 0.02 count s-1 and at this magnitude, only 40% of all QSOs are detected by ROSAT.
Key Words.:
Quasars: general, X-rays: AGN, Galaxies: Seyfert1 Introduction
The ROSAT All-Sky Survey Bright Source Catalogue (RASS-BSC) is derived from the all-sky survey performed during the ROSAT mission in the energy band 0.1-2.4 keV; it contains 18 811 sources down to a limiting ROSAT-PSPC count-rate of 0.05 count s-1 (Voges et al. voges99 (1999)). The 2 012 brightest (count-rate above 0.2 count s-1) high galactic latitude (b30o) sources of the BSC catalogue have been tentatively optically identified by Schwope et al. (schwope00 (2000)). The ROSAT Faint Source Catalogue (FSC)(Voges et al. voges00 (2000)) contains 105 924 sources and represents the faint extension of the RASS-BSC.
The Hamburg QSO Survey is a wide-angle objective prism survey for finding bright QSOs in the northern sky. The survey plates have been taken with the former Hamburg Schmidt telescope now located at the Spanish-German Center in Calar Alto (Spain). A 17 objective prism has been used providing unwidened spectra with a dispersion of 1 390 Å mm-1 at H (Hagen et al. hagen95 (1995)). The slitless spectra allow the classification of objects brighter than about B=17.0. The first study of a sample of previously known QSOs with the has shown that, as a class, they are luminous X-ray emitters (Tananbaum et al. tananbaum79 (1979)). Bade et al. (bade98 (1998)) and Zickgraf et al. (zickgraf03 (2003)) have described a way to identify X-ray sources by using the Hamburg survey plates; this process has been applied to a subsample of 5 341 sources from the ROSAT-BSC.
In the present paper we try to find all AGN brighter than O=16.5 in a subarea of the
ROSAT-FSC. As the FSC survey is only about 2.5 times deeper than the BSC survey,
we do not expect a significant difference in the identification content of
these two samples but, because the number of sources in the FSC survey is much
larger, we expect the discovery of many additional optically bright AGN.
As the ROSAT survey is a low-energy survey,
it contains a relatively high fraction of Narrow-Line Seyfert 1 Galaxies
(NLS1s) because they usually have a soft X-ray excess (see for instance
Laor et al. laor97 (1997)); we therefore expect to find new bright NLS1s.
In the following we call AGN (or Active Galactic Nuclei) QSOs, BL Lac objects, Seyfert galaxies and Liners. QSOs are defined as Seyfert 1 galaxies brighter than MB=–23.0111Throughout this work we used Ho=50 km s-1 Mpc-1 and qo=0 .
2 Analysis
2.1 The sample
In the area of the sky defined by 0o and b 30o (10 313 deg2) there are 29 321 ROSAT-FSC sources.

Figure 1 shows the histogram of the logarithm of the X-ray count rates of these sources (in counts s-1). Below 0.02 counts s-1 the survey is obviously quite incomplete, reflecting the fact that its sensitivity limit is not uniform over the sky. On the other hand 130 sources have a count rate greater than 0.05 counts s-1 but were not included in the BSC as their detected photon number was less than 15. They were included in the FSC.
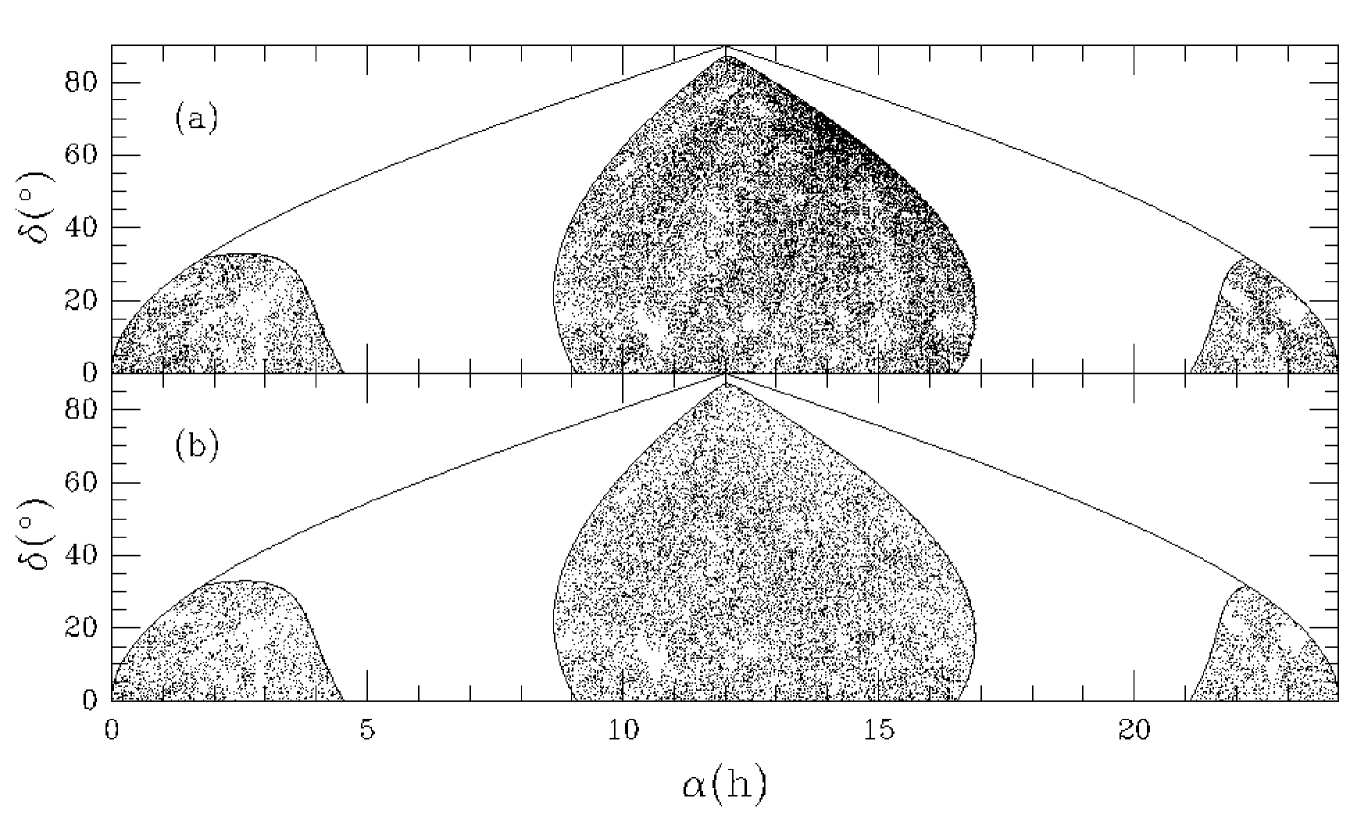
Figure 2 shows the distribution over the sky of (a) the 29 321
sources and (b) the 15 848 sources with F counts s-1.
The second distribution is much more uniform than the first and,
in the following, we shall restrict our analysis to this subsample.
2.2 Identification methodology
Our aim being to identify all bright extragalactic objects associated with a ROSAT-FSC source in the area defined above, we chose to make use of the Hamburg slitless survey of the northern sky which, in principle, allows us to determine the nature of every object brighter than O17.0. However this would require us to visually inspect all objects within a given radius around each of the 15 848 X-ray sources in the sample. This is obviously not feasible. We therefore decided to preselect all bright objects lying near the X-ray positions in the APS database, which is a catalogue of all objects visible on the Palomar Sky Survey plates, including magnitude, colour and classification as starlike or extended. But this could not be easily done as the APS was not directly available (when we started this work). The USNO catalogue is similar to the APS catalogue except that it does not classify the listed objects as starlike or extended; but it is available on CD-ROMs. It was therefore easy to select all bright USNO objects near the X-ray positions. We then sent the list of 3 776 selected objects to the University of Minnesota where a batch job was run to find their APS magnitude, colour and classification.
However, as very bright stars (O12.0) are saturated on the DSS1 images and bright extended galaxies are poorly recognized by the automatic extraction procedures of both the USNO and APS databases, to find these objects we had to cross-correlate the X-ray catalogue with various catalogues of bright stars and galaxies. We ended up with 3 212 objects found in the APS database, 685 bright stars and 91 additional galaxies.
The APS classification as ”star-like” or ”extended” were then evaluated by visual screening of the DSS2 images. 2 719 APS objects were found to be ”star-like” and 493 ”extended”. All 3 212 APS objects were subsequently classified using the digitized objective prism spectra of the Hamburg Quasar Survey.
Follow-up observations were started for the ”extended” objects and additional galaxies having OAPS17.0, showing the sample to be a mixture of galaxies containing 20% AGN.
The ”star-like” objects were separated into several subsamples according to their APS colour and magnitude. A sample of 144 high-probability AGN candidates was selected. Based on literature data and our own follow-up spectroscopy, 83 of them are now confirmed AGN.
2.3 The USNO and APS databases
To identify the X-ray sources with relatively bright optical counterparts we have cross-correlated our ROSAT sample with the USNO-A2.0 catalogue (Monet et al. 1996) from which we have extracted all objects in the magnitude range O=12.0-16.5 (4 420 441 i.e. 428 deg-2). We have found 25 549 objects located within 2 of one of the 15 848 X-ray sources.

As the USNO catalogue positions are rather poor for very bright objects, we have extracted the 1 306 PPM (Positions and Proper Motions) stars (Röser & Bastian roser (1991)) located within 120 of a ROSAT position. The PPM star catalogue contains 181 731 stars north of declination –25 , brighter than about mpg=11.0. Fig. 3 shows the distribution of the position differences between the ROSAT and PPM positions. The circle drawn on the figure has a radius of 25. The number of coincidences within this circle is 704 (with 19 X-ray sources being associated with two PPM stars), while the expected number of chance coincidences is 27. There are therefore 685 X-ray sources within 25 of at least one PPM star. We consider these 685 sources as identified; we ignored them in the following and we are left with 15 163 X-ray sources.

The histogram of the separation between the optical and X-ray positions (Fig. 4) shows that, for separations larger than 35, there is an overwhelming majority of chance coincidences. For smaller separations, the fraction of real associations rapidly increases. This empirically defined limit is a compromise to maximize the number of real associations and minimize the number of chance coincidences. It is not straightforward to determine the fraction of real associations having a separation larger than 35 and therefore lost by using this limit. For separations smaller than 35, there are 3 776 coincidences, half being expected by chance and half real. Including the PPM stars, about 17% of the X-ray FSC sources are therefore physically associated with a relatively bright object.
Zickgraf et al. (zickgraf03 (2003)) found that the 90% error radius for the X-ray positions in the BSC is 21. This is significantly smaller than the value of 35 we used for the separation limit for real associations. This difference can probably be ascribed to the differences in count rates between the two samples.
In total there are 3 364 X-ray sources with at least one USNO object within
35: 2 985 with a single USNO object, 348 with two, 29 with three and
2 with four.
In the APS database (Cabanela et al. cabanela03 (2003)), the objects are
classified as starlike or resolved (galaxies). The photometric calibration for the
starlike objects uses a magnitude-diameter relation derived from photoelectric
calibrating sequences. The O magnitudes have a mean r.m.s. of 0.15-0.20 mag over
the range 14-20 mag. These magnitudes are not as reliable for objects brighter
than 12th mag because of the diffraction pattern. For objects brighter
than 8th mag, photometry is not available. For galaxies, the integrated
magnitudes are obtained from a density-to-intensity conversion. APS derived
galaxy magnitudes show no systematic photometric errors and a typical r.m.s.
scatter of 0.2 to 0.3 magnitudes. The OAPS and B magnitudes for stars
are equal on average with a dispersion of 0.26 mag (Mickaelian et al.
mickaelian99 (1999)).
In contrast, the USNO catalogue makes no distinction between starlike and extended
objects. As a consequence, the magnitudes derived for galaxies are unreliable.
The typical photometric error for starlike objects is about 0.31 mag r.m.s. (Mickaelian
et al. mickaelian01 (2001)). Bright objects tend to saturate. The magnitudes
reported for such objects are generally too high.
Figure 5 shows the comparison of the USNO and APS O magnitudes for starlike
objects (left panel) and for galaxies (right panel). While the agreement between the
two sets of magnitudes is reasonably good for starlike objects, it is very poor for
galaxies.
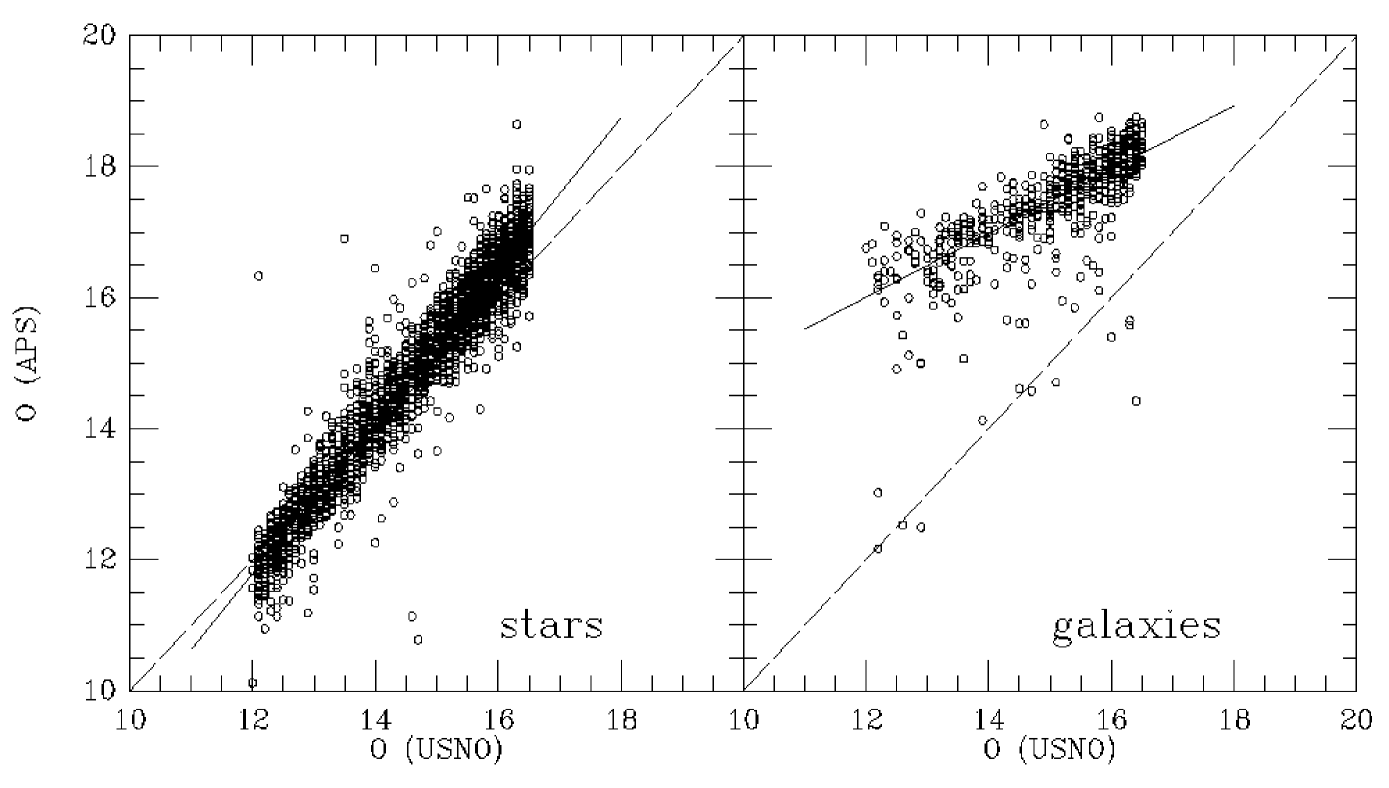
Figure 6 shows the comparison of the USNO and APS O magnitudes
with the NPM1 O magnitudes (Klemola et al. klemola87 (1987)) for 95 galaxies and
81 stars.
The least square solutions for galaxies are:
ONPM1G = 0.47OUSNO + 11.3 ( = 0.54 mag)
ONPM1G = 0.90OAPS – 0.29 ( = 0.50 mag)

This confirms that, for galaxies, the APS magnitudes are more reliable than the USNO magnitudes. We therefore extracted from the APS database objects within 10 from the 3 776 USNO objects, brighter than O=19.0. A number of these have no APS counterpart because the required plates were not available and 49 because there was no match. We checked these 49 USNO objects on the DSS2 images (Lasker et al lasker96 (1996)) and found that all of them, except one, have a starlike appearance. There are 3 212 coincidences between USNO and APS objects (the 3 212 sample), 2 652 with starlike and 560 with extended objects.
As the APS classification based on DSS1 is not always correct, all 3 212 images have been checked on the DSS2 plates. Of these, 2 719 were classified as starlike and 493 as extended. Out of the 560 APS galaxies, 135 have been reclassified as starlike; 45 of them appear as binaries so that in the APS they appear as extended. On the other hand, 68 APS starlike objects have an extended image on the DSS2
2.4 The Hamburg database
All 3 212 objects have been tentatively classified using the Hamburg slitless plates on the basis of a classification scheme introduced during the ROSAT-BSC identification program (Bade et al. bade98 (1998)). The statistics of this classification is given in Table 1. Of the 493 objects classified as extended, based on direct images of the DSS2 plates, four could not be classified spectroscopically because of overlapping spectra. Based on their continua the 489 remaining objects were classified as “galaxy” (red continuum),“blue galaxy” (blue continuum) or “AGN” (prominent UV excess). Sixty one of the galaxies are member of a pair (23) or of a group (38). Among the starlike objects, 2 181 were classified as stars due to absorption features in their spectra. The bright saturated objects (O12.0) were also considered as stars. Moreover 383 starlike objects, too weak for the study of absorption features, were classified on the basis of their continuum: red (RED-WK), blue (BLUE-WK) and extremely blue (EBL-WK). These objects have typically O16.0. Twenty two starlike objects were classified as QSOs due to the presence of a prominent UV excess and/or of emission lines. Fifty five objects could not be classified because of overlapping spectra and one more because its spectrum did not fit the classification scheme.
| HQS types | Number | % |
|---|---|---|
| AGN | 6 | 0.2 |
| Blue galaxy | 215 | 6.7 |
| Galaxy | 268 | 8.3 |
| QSO | 22 | 0.7 |
| EBL-WK | 84 | 2.6 |
| BLUE-WK | 212 | 6.6 |
| RED-WK | 87 | 2.8 |
| W-Dwarf | 20 | 0.6 |
| Star-BA | 137 | 4.3 |
| Star-FG | 1325 | 41.3 |
| Star-K | 674 | 21.0 |
| Star-M | 25 | 0.8 |
| Saturated | 81 | 2.5 |
| Overlap | 55 | 1.7 |
| Unidentified | 1 | 0.0 |
| Total | 3212 | 100.0 |
The HQS classifications have been checked with already known objects. In our sample there are 107 confirmed QSOs. Two could not be classified with the Hamburg material because of overlapping spectra. Seventeen have been classified as QSOs, one as an AGN, 56 as EBL-WK, 22 as BLUE-WK, two as RED-WK (J15563+0309, a low luminosity QSO with MB=–23.2 and KUV 16355+4146 at z=0.765, with (O–E)=1.60) and seven as blue galaxies. These blue galaxies are in fact low luminosity QSOs (MB–24.0). On the other hand eleven EBL-WK objects have been shown to be stars, as well as 21 BLUE-WK and two RED-WK objects. Clearly the EBL-WK objects are good QSO candidates as well as the BLUE-WK, although to a lesser degree. When they are not QSOs, they usually turn out to be WDs or CVs.
3 Galaxies
To find Seyfert galaxies we turned our attention to the 493 objects extended on the DSS2, found within 35 of an FSC source. If there were no real association, the number of coincidences within 15 would be 0.184 times the number of coincidences within 35 (the ratio of the respective areas). On the other hand, if all associations were real, Fig. 4 shows that almost all identifications would be located within 35 and about 50% within 15. In a sample in which the fraction of coincidences within 15 is , the fraction of true associations would be =(–0.184)/(0.5–0.184). 218 (x=44) of the 493 galaxies are within 15 of an X-ray source which shows that a large fraction of them (80%) are genuine associations.
As we have seen above, sixty eight of the objects found to be extended on the DSS2 were classified as starlike in the APS data base. Three of them (NGC 1085, IC 2439 and KUG 2323+85) were previously found to be bright galaxies and are included in Table 2. The 65 others are probably compact galaxies; 47 are classified as ”blue galaxies” on the slitless HQS spectra (in fact, ten of them are already known to be Seyfert 1s or low luminosity QSOs).
As the spectroscopic observations took place before we had the opportunity to check the APS classification on the DSS2 images (which is a rather tedious procedure as it is done visually rather than automatically), these 65 objects were not included in our original list of galaxy candidates.
Of the 493 extended objects, 155 are brighter than OAPS=17.0. Ninety four of them were classified as galaxies in the APS database. To these 94 galaxies we added 91 bright galaxies not appearing in the USNO or APS databases but found by cross-correlating the ROSAT FSC with catalogues of bright galaxies (NGC, UGC, NPM1G, Mark, Zw etc.). As the surface density in these catalogues is small, we accepted as identification all coincidences within 35. These 185 galaxy candidates are listed in Table 2. The redshift of 130 of them were known from the literature.
| J2000 optical position | ||||||||||||||
|---|---|---|---|---|---|---|---|---|---|---|---|---|---|---|
| h | m | s | ∘ | ’ | ” | sep(”) | c/r | LX | OUS | OAPS | z | ref. | Name | |
| 0 | 14 | 7.46 | 10 | 34 | 13.3 | 5.3 | 0.036 | 15.0 | 16.89 | |||||
| 0 | 19 | 37.80 | 29 | 56 | 2.0 | 27.2 | 0.042 | 42.02 | 15.37 | 0.024 | NGC 76 | |||
| 0 | 24 | 30.24 | 13 | 35 | 50.3 | 2.4 | 0.032 | 12.5 | 16.63 | NPM1G+13.0013 | ||||
| 0 | 46 | 29.20 | 8 | 25 | 59.6 | 18.9 | 0.023 | 42.18 | 15.5 | 16.32 | 0.039 | UGC 482 | ||
| 0 | 54 | 45.23 | 16 | 26 | 17.2 | 9.2 | 0.038 | 42.37 | 13.6 | 16.56 | 0.038 | MCG+03.03.008 | ||
| 0 | 54 | 48.64 | 28 | 52 | 1.1 | 26.7 | 0.024 | 41.74 | 15.66 | 0.023 | UGC 555 | |||
| 0 | 57 | 48.89 | 30 | 21 | 8.8 | 7.3 | 0.043 | 41.67 | 13.14 | 0.016 | Liner | NGC 315 | ||
| 1 | 16 | 14.83 | 31 | 2 | 1.8 | 34.2 | 0.021 | 41.42 | 0.017 | NGC 452 | ||||
| 1 | 20 | 38.97 | 29 | 41 | 43.9 | 9.4 | 0.031 | 41.85 | 16.0 | 15.40 | 0.023 | IC 1672 | ||
| 1 | 30 | 35.46 | 19 | 36 | 31.0 | 4.2 | 0.034 | 42.43 | 13.7 | 16.35 | 0.043 | UGC 1077 | ||
| 2 | 43 | 48.71 | 14 | 53 | 13.1 | 33.8 | 0.027 | 42.39 | 16.49 | 0.046 | IC 1835 | |||
| 2 | 46 | 25.36 | 3 | 36 | 27.3 | 7.1 | 0.078 | 42.25 | 12.5 | 14.91 | 0.023 | NGC 1085 | ||
| 2 | 51 | 12.98 | 13 | 11 | 31.3 | 16.1 | 0.031 | 41.92 | 13.8 | 16.34 | 0.025 | UGC 2337B | ||
| 2 | 58 | 51.14 | 6 | 22 | 25.9 | 5.4 | 0.026 | 42.35 | 13.5 | 16.88 | 0.045 | LEDA 074274 | ||
| 7 | 50 | 8.28 | 55 | 23 | 2.9 | 18.6 | 0.032 | 41.70 | 12.6 | 15.43 | 0.019 | abs | 2 | UGC 4035 |
| 8 | 1 | 55.04 | 62 | 32 | 15.0 | 6.0 | 0.034 | 42.88 | 14.0 | 0.072 | ||||
| 8 | 30 | 29.14 | 69 | 1 | 42.8 | 12.3 | 0.022 | 41.66 | 13.5 | 0.022 | Zw 331.048 | |||
| 8 | 36 | 45.79 | 48 | 42 | 0.7 | 30.1 | 0.027 | 13.7 | 16.24 | MCG+08.16.019 | ||||
| 8 | 39 | 55.44 | 74 | 5 | 15.9 | 32.2 | 0.024 | 15.1 | NPM1G+74.0038 | |||||
| 8 | 55 | 38.01 | 78 | 13 | 25.3 | 5.0 | 0.024 | 40.41 | 0.005 | Liner | NGC 2655 | |||
| 9 | 6 | 44.71 | 3 | 36 | 0.9 | 28.1 | 0.023 | 14.2 | ||||||
| 9 | 8 | 38.35 | 32 | 35 | 34.0 | 15.9 | 0.033 | 41.44 | 12.4 | 15.79 | 0.014 | IC 2439 | ||
| 9 | 11 | 37.50 | 60 | 2 | 15.0 | 22.9 | 0.026 | 40.45 | 12.12 | 0.005 | S | NGC 2768 | ||
| 9 | 12 | 38.04 | 75 | 38 | 55.4 | 13.2 | 0.040 | 42.81 | 12.8 | 0.061 | H II | 1,2 | NPM1G+75.0038 | |
| 9 | 16 | 3.95 | 17 | 37 | 43.6 | 10.1 | 0.060 | 42.34 | 14.63 | 0.029 | NGC 2795 | |||
| 9 | 16 | 50.01 | 20 | 11 | 54.6 | 19.8 | 0.021 | 41.85 | 15.04 | 0.028 | NGC 2804 | |||
| 9 | 19 | 27.31 | 33 | 47 | 26.4 | 26.4 | 0.029 | 41.65 | 13.7 | 16.83 | 0.019 | LEDA 139185 | ||
| 9 | 20 | 2.10 | 1 | 2 | 18.0 | 15.9 | 0.046 | 41.76 | 14.27 | 0.017 | UGC 4956 | |||
| 9 | 23 | 25.93 | 22 | 19 | 1.0 | 20.3 | 0.081 | 42.50 | 13.9 | 0.030 | UGC 4991b | |||
| 9 | 23 | 24.36 | 22 | 18 | 47.3 | 5.4 | 0.081 | 42.60 | 13.4 | 0.034 | UGC 4991a | |||
| 9 | 23 | 29.19 | 25 | 46 | 9.6 | 13.4 | 0.021 | 42.35 | 12.5 | 15.73 | 0.050 | S2 | 1,2 | Zw 121.071 |
| 9 | 24 | 14.29 | 49 | 15 | 14.9 | 32.9 | 0.021 | 40.86 | 14.71 | 0.009 | NGC 2856 | |||
| 9 | 25 | 28.30 | 23 | 36 | 31.6 | 1.5 | 0.035 | 42.21 | 12.2 | 16.12 | 0.033 | em | 1 | Zw 121.086 |
| 9 | 25 | 42.55 | 11 | 25 | 55.3 | 14.6 | 0.034 | 41.25 | 14.31 | 0.011 | NGC 2872 | |||
| 9 | 32 | 10.13 | 21 | 30 | 4.4 | 18.1 | 0.030 | 39.71 | 0.002 | H II | NGC 2903 | |||
| 9 | 32 | 16.98 | 9 | 41 | 0.5 | 28.6 | 0.023 | 14.8 | 16.74 | NPM1G+09.0188 | ||||
| 9 | 38 | 12.30 | 7 | 43 | 39.8 | 19.9 | 0.033 | 13.8 | 16.84 | Zw 035.017 | ||||
| 9 | 38 | 32.90 | 17 | 1 | 52.0 | 17.9 | 0.040 | 42.13 | 16.00 | 0.028 | NGC 2943 | |||
| 9 | 45 | 28.84 | 56 | 32 | 53.4 | 2.1 | 0.046 | 43.58 | 15.8 | 16.91 | 0.139 | abs | 1 | |
| 9 | 50 | 21.61 | 72 | 16 | 44.1 | 22.7 | 0.025 | 40.23 | 0.004 | S1.9 | NGC 2985 | |||
| 9 | 59 | 39.60 | 0 | 35 | 12.1 | 24.1 | 0.028 | 42.72 | 13.1 | 16.42 | 0.066 | UGC 5370 | ||
| 10 | 1 | 57.80 | 55 | 40 | 47.1 | 4.2 | 0.049 | 40.53 | 12.23 | 0.004 | S2 | NGC 3079 | ||
| 10 | 6 | 7.45 | 47 | 15 | 45.4 | 22.0 | 0.036 | 41.98 | 15.09 | 0.025 | NGC 3111 | |||
| 10 | 13 | 50.50 | 38 | 45 | 53.8 | 27.8 | 0.028 | 41.80 | 14.15 | 0.023 | NGC 3158 | |||
| 10 | 27 | 49.91 | 36 | 33 | 34.7 | 24.4 | 0.037 | 42.34 | 16.02 | 0.037 | S2 | HS 1024+3648 | ||
| 10 | 32 | 33.34 | 65 | 2 | 0.9 | 33.2 | 0.023 | 40.55 | 14.42 | 0.006 | NGC 3259 | |||
| 10 | 47 | 10.14 | 72 | 50 | 20.9 | 8.5 | 0.025 | 40.94 | 0.009 | NGC 3348 | ||||
| 10 | 51 | 29.91 | 46 | 44 | 41.5 | 24.1 | 0.026 | 13.3 | 16.00 | NPM1G+47.0182 | ||||
| 10 | 58 | 13.77 | 1 | 36 | 6.3 | 8.8 | 0.069 | 42.63 | 16.5 | 0.038 | abs | 1 | UGC 6057c | |
| 10 | 58 | 13.04 | 1 | 36 | 24.3 | 29.9 | 0.069 | 42.65 | 15.1 | 0.039 | UGC 6057b | |||
| 11 | 0 | 5.35 | 14 | 50 | 26.5 | 28.4 | 0.026 | 40.45 | 15.9 | 0.005 | NGC 3485 | |||
| 11 | 3 | 11.35 | 27 | 58 | 21.1 | 7.8 | 0.034 | 40.56 | 12.2 | 13.02 | 0.005 | H II | NGC 3504 | |
| 11 | 8 | 43.37 | 29 | 13 | 25.3 | 2.7 | 0.022 | 42.76 | 13.4 | 16.49 | 0.078 | em | 1,2 | LEDA 094150 |
| 11 | 10 | 45.96 | 11 | 36 | 41.2 | 14.3 | 0.025 | 42.28 | 13.2 | 16.16 | 0.042 | S1 | 1 | Zw 067.027 |
| J2000 optical position | ||||||||||||||
|---|---|---|---|---|---|---|---|---|---|---|---|---|---|---|
| h | m | s | ∘ | ’ | ” | sep(”) | c/r | LX | OUS | OAPS | z | ref. | Name | |
| 11 | 15 | 2.23 | 4 | 5 | 7.4 | 13.4 | 0.024 | 42.19 | 13.4 | 16.48 | 0.039 | Zw 039.090 | ||
| 11 | 24 | 43.64 | 38 | 45 | 46.3 | 22.1 | 0.051 | 41.03 | 12.9 | 12.50 | 0.007 | H II | NGC 3665 | |
| 11 | 25 | 45.33 | 24 | 8 | 24.5 | 28.9 | 0.029 | 41.86 | 12.7 | 15.12 | 0.024 | Zw 126.051 | ||
| 11 | 28 | 2.16 | 78 | 59 | 40.4 | 16.3 | 0.046 | 14.7 | 0.000 | H II | UGC 6456 | |||
| 11 | 34 | 6.64 | 25 | 33 | 34.8 | 18.9 | 0.029 | 12.8 | 16.55 | MCG+04.27.068 | ||||
| 11 | 39 | 14.88 | 17 | 8 | 37.2 | 4.2 | 0.037 | 41.85 | 13.1 | 16.23 | 0.021 | UGC 6614 | ||
| 11 | 39 | 41.57 | 31 | 54 | 41.1 | 2.9 | 0.034 | 41.07 | 15.9 | 0.009 | S1.8 | NGC 3786 | ||
| 11 | 46 | 12.24 | 20 | 23 | 29.9 | 27.2 | 0.048 | 42.04 | 14.5 | 14.61 | 0.023 | Liner | NGC 3884 | |
| 11 | 47 | 22.16 | 35 | 1 | 7.5 | 25.9 | 0.044 | 42.87 | 14.4 | 16.60 | 0.063 | S2 | B2 1144+35B | |
| 11 | 49 | 59.31 | 21 | 20 | 1.1 | 9.2 | 0.026 | 41.88 | 15.32 | 0.026 | NGC 3910 | |||
| 11 | 50 | 41.53 | 20 | 0 | 54.6 | 10.2 | 0.031 | 41.77 | 15.55 | 0.021 | NGC 3919 | |||
| 11 | 53 | 26.26 | 35 | 56 | 53.8 | 15.3 | 0.023 | 42.66 | 12.3 | 16.27 | 0.068 | S2 | 2 | KUG 1150+362 |
| 11 | 59 | 52.16 | 55 | 32 | 5.4 | 30.6 | 0.024 | 42.83 | 13.7 | 16.96 | 0.081 | PGC 2505536 | ||
| 12 | 4 | 6.25 | 20 | 14 | 6.2 | 25.5 | 0.028 | 41.72 | 12.9 | 14.99 | 0.021 | NGC 4065 | ||
| 12 | 4 | 43.34 | 31 | 10 | 38.2 | 16.7 | 0.025 | 41.83 | 15.11 | 0.025 | S1.9 | UGC 7064 | ||
| 12 | 5 | 49.83 | 35 | 10 | 46.4 | 11.9 | 0.190 | 43.38 | 12.7 | 16.74 | 0.054 | S1 | Mark 646 | |
| 12 | 8 | 5.56 | 25 | 14 | 14.1 | 16.0 | 0.034 | 41.89 | 15.32 | 0.023 | UGC 7115 | |||
| 12 | 10 | 33.61 | 30 | 24 | 5.9 | 21.4 | 0.045 | 39.29 | 13.71 | 0.001 | C | NGC 4150 | ||
| 12 | 14 | 18.10 | 29 | 31 | 4.5 | 5.0 | 0.021 | 42.57 | 16.96 | 0.064 | S2 | WAS 49b | ||
| 12 | 14 | 48.65 | 59 | 54 | 22.5 | 23.3 | 0.028 | 42.64 | 14.6 | 15.61 | 0.060 | NGC 4199a | ||
| 12 | 14 | 51.71 | 59 | 54 | 30.5 | 4.5 | 0.028 | 42.65 | 16.3 | 0.061 | abs | 1 | NGC 4199b | |
| 12 | 15 | 5.34 | 76 | 14 | 10.0 | 34.4 | 0.031 | 40.68 | 0.006 | UGC 7265 | ||||
| 12 | 16 | 0.00 | 12 | 41 | 1.4 | 5.4 | 0.033 | 42.78 | 16.60 | 0.065 | S1.9 | Mark 764 | ||
| 12 | 19 | 51.66 | 28 | 25 | 21.7 | 12.6 | 0.046 | 42.13 | 13.8 | 16.27 | 0.026 | Zw 158.075 | ||
| 12 | 20 | 6.86 | 29 | 16 | 50.5 | 11.4 | 0.037 | 39.80 | 12.6 | 12.53 | 0.002 | Liner | NGC 4278 | |
| 12 | 22 | 54.89 | 15 | 49 | 20.7 | 15.6 | 0.042 | 40.65 | 11.30 | 0.005 | C | NGC 4321 | ||
| 12 | 23 | 39.10 | 7 | 3 | 14.0 | 24.6 | 0.030 | 40.06 | 14.80 | 0.003 | NGC 4342 | |||
| 12 | 23 | 42.85 | 58 | 14 | 45.9 | 10.3 | 0.037 | 41.55 | 14.5 | 16.93 | 0.015 | S? | SBS 1221+585 | |
| 12 | 26 | 28.02 | 9 | 1 | 23.0 | 26.7 | 0.029 | 41.86 | 14.7 | 14.58 | 0.024 | Liner | NGC 4410 | |
| 12 | 26 | 26.98 | 31 | 13 | 22.6 | 4.4 | 0.033 | 39.75 | 12.2 | 12.17 | 0.002 | C | NGC 4414 | |
| 12 | 28 | 29.49 | 17 | 5 | 6.0 | 9.8 | 0.039 | 40.91 | 12.21 | 0.007 | Liner | NGC 4450 | ||
| 12 | 34 | 3.10 | 7 | 41 | 59.0 | 24.2 | 0.032 | 39.14 | 11.85 | 0.001 | H II | NGC 4526 | ||
| 12 | 34 | 46.81 | 47 | 45 | 32.4 | 34.2 | 0.043 | 42.25 | 16.12 | 0.031 | MCG+08.23.061 | |||
| 12 | 48 | 58.34 | 40 | 35 | 56.8 | 14.5 | 0.039 | 41.58 | 15.2 | 15.95 | 0.015 | IC 3808 | ||
| 12 | 50 | 26.60 | 25 | 30 | 5.8 | 8.3 | 0.028 | 40.28 | 11.04 | 0.004 | S2 | NGC 4725 | ||
| 12 | 55 | 7.78 | 78 | 37 | 14.9 | 4.1 | 0.029 | 42.36 | 12.9 | 0.043 | S1 | 1 | NPM1G+78.0053 | |
| 12 | 56 | 43.76 | 21 | 40 | 51.9 | 7.2 | 0.041 | 39.25 | 10.36 | 0.001 | S | NGC 4826 | ||
| 12 | 59 | 39.35 | 38 | 48 | 56.3 | 16.0 | 0.022 | 42.01 | 13.2 | 16.23 | 0.033 | IC 4003 | ||
| 13 | 0 | 39.13 | 2 | 30 | 5.3 | 22.4 | 0.027 | 40.02 | 12.98 | 0.003 | H II | NGC 4900 | ||
| 13 | 4 | 40.89 | 43 | 18 | 35.0 | 20.1 | 0.031 | 14.0 | 16.86 | NPM1G+43.0235 | ||||
| 13 | 4 | 57.99 | 43 | 33 | 10.9 | 25.2 | 0.052 | 13.1 | 16.06 | MCG+07.27.026 | ||||
| 13 | 7 | 3.03 | 56 | 31 | 59.2 | 5.5 | 0.044 | 43.08 | 12.4 | 16.40 | 0.080 | S1 | 1,2 | MCG+10.19.033 |
| 13 | 20 | 28.94 | 31 | 21 | 6.9 | 19.8 | 0.029 | 42.42 | 12.8 | 16.53 | 0.046 | Zw 160.204 | ||
| 13 | 29 | 58.73 | 47 | 16 | 4.5 | 29.1 | 0.046 | 39.90 | 11.51 | 0.002 | Liner | NGC 5195 | ||
| 13 | 32 | 48.62 | 41 | 52 | 18.9 | 12.3 | 0.038 | 42.07 | 14.08 | 0.027 | NGC 5214 | |||
| 13 | 38 | 17.27 | 48 | 16 | 32.0 | 18.4 | 0.043 | 42.16 | 15.05 | 0.028 | S2 | Mark 266SW | ||
| 13 | 42 | 8.34 | 35 | 39 | 15.2 | 15.3 | 0.021 | 40.16 | 13.06 | 0.004 | S1.9 | NGC 5273 | ||
| 13 | 44 | 1.90 | 25 | 56 | 27.8 | 28.5 | 0.026 | 12.8 | 17.00 | |||||
| 13 | 51 | 4.24 | 19 | 26 | 8.2 | 3.7 | 0.048 | 42.90 | 13.5 | 16.95 | 0.062 | em | 1,2 | |
| 13 | 51 | 42.19 | 55 | 59 | 43.2 | 29.3 | 0.022 | 15.1 | 16.68 | TEX 1349+562 | ||||
| 13 | 53 | 9.75 | 24 | 22 | 37.4 | 6.6 | 0.027 | 42.26 | 13.5 | 16.85 | 0.056 | S1 | 1,2 | Zw 132.035 |
| 13 | 53 | 26.69 | 40 | 16 | 58.9 | 7.7 | 0.048 | 41.12 | 0.008 | Liner | NGC 5353 | |||
| 13 | 53 | 43.82 | 33 | 13 | 20.3 | 28.2 | 0.024 | 42.43 | 14.5 | 15.61 | 0.051 | MCG +06.31.015 | ||
| 13 | 53 | 55.94 | 21 | 59 | 54.9 | 24.1 | 0.042 | 12.9 | 16.86 | |||||
| 13 | 58 | 19.76 | 7 | 13 | 15.2 | 27.4 | 0.044 | 42.07 | 15.7 | 0.025 | Zw 046.025 | |||
| 14 | 12 | 36.95 | 39 | 18 | 53.8 | 21.2 | 0.034 | 41.96 | 16.4 | 15.27 | 0.025 | S1.9 | NGC 5515 | |
| 14 | 13 | 23.13 | 24 | 31 | 56.8 | 24.3 | 0.024 | 42.44 | 12.2 | 16.34 | 0.052 | abs | 2 | Zw 133.012 |
| 14 | 18 | 9.20 | 7 | 33 | 52.0 | 24.3 | 0.042 | 42.02 | 14.97 | 0.024 | NGC 5546 | |||
| J2000 optical position | ||||||||||||||
|---|---|---|---|---|---|---|---|---|---|---|---|---|---|---|
| h | m | s | ∘ | ’ | ” | sep(”) | c/r | LX | OUS | OAPS | z | ref. | Name | |
| 14 | 22 | 55.37 | 32 | 51 | 2.7 | 2.0 | 0.028 | 42.14 | 15.28 | 0.034 | S1.8 | UGC 9214 | ||
| 14 | 26 | 2.32 | 8 | 6 | 40.5 | 34.6 | 0.024 | 41.84 | 16.98 | 0.026 | Zw 047.039 | |||
| 14 | 26 | 18.64 | 26 | 14 | 52.3 | 13.8 | 0.027 | 42.02 | 16.3 | 15.58 | 0.030 | IC 4423 | ||
| 14 | 28 | 23.06 | 78 | 53 | 8.2 | 0.2 | 0.047 | 42.03 | 12.1 | 0.023 | IC 4470 | |||
| 14 | 29 | 40.64 | 0 | 21 | 59.2 | 13.8 | 0.025 | 42.51 | 14.8 | 16.92 | 0.055 | abs | 1 | Zw 019.045 |
| 14 | 29 | 48.51 | 53 | 57 | 54.3 | 25.6 | 0.025 | 42.30 | 13.2 | 16.19 | 0.043 | IC 1027 | ||
| 14 | 42 | 39.65 | 29 | 20 | 48.2 | 7.5 | 0.028 | 42.82 | 13.5 | 17.00 | 0.074 | H II | 1,2 | NPM1G+29.0326 |
| 14 | 50 | 51.40 | 5 | 6 | 52.0 | 25.9 | 0.025 | 41.92 | 15.29 | 0.028 | S2 | NGC 5765B | ||
| 14 | 50 | 55.42 | 27 | 34 | 42.1 | 13.1 | 0.032 | 42.09 | 15.89 | 0.030 | IC 4514 | |||
| 14 | 51 | 14.39 | 30 | 41 | 32.2 | 33.9 | 0.044 | 12.5 | 16.28 | Zw 164.036 | ||||
| 14 | 55 | 28.21 | 32 | 50 | 24.0 | 30.3 | 0.026 | 14.1 | 16.21 | MCG+06.33.009 | ||||
| 15 | 4 | 15.88 | 28 | 29 | 47.5 | 32.7 | 0.127 | 43.26 | 15.66 | 0.058 | MCG+05.36.002 | |||
| 15 | 5 | 56.60 | 3 | 42 | 26.0 | 15.6 | 0.027 | 42.18 | 16.00 | 0.036 | S1.8 | Mark 1392 | ||
| 15 | 9 | 20.51 | 7 | 38 | 19.4 | 28.5 | 0.044 | 43.05 | 16.0 | 16.94 | 0.077 | abs | 2 | |
| 15 | 13 | 40.25 | 4 | 4 | 17.2 | 24.9 | 0.025 | 42.21 | 13.3 | 16.96 | 0.039 | H II | 2 | Zw 049.061 |
| 15 | 20 | 29.00 | 44 | 58 | 15.3 | 11.5 | 0.046 | 42.89 | 13.9 | 16.86 | 0.063 | abs | 1 | |
| 15 | 21 | 20.58 | 30 | 40 | 15.3 | 15.0 | 0.139 | 43.57 | 14.0 | 16.93 | 0.079 | abs | 2 | Zw 165.041 |
| 15 | 23 | 59.90 | 31 | 12 | 40.2 | 31.4 | 0.032 | 42.97 | 16.71 | 0.074 | MCG+05.36.026 | |||
| 15 | 25 | 8.75 | 12 | 52 | 57.5 | 24.6 | 0.039 | 41.95 | 12.5 | 16.30 | 0.023 | Zw 077.123 | ||
| 15 | 29 | 14.68 | 52 | 51 | 50.1 | 12.9 | 0.029 | 42.80 | 13.1 | 16.66 | 0.071 | abs | 1 | UGC 9868 |
| 15 | 32 | 32.02 | 4 | 40 | 51.4 | 13.8 | 0.048 | 42.50 | 15.75 | 0.039 | UGC 9886 | |||
| 15 | 32 | 57.19 | 0 | 26 | 36.1 | 11.4 | 0.044 | 42.41 | 15.8 | 16.11 | 0.037 | Zw 022.010 | ||
| 15 | 33 | 17.73 | 82 | 13 | 46.2 | 11.3 | 0.036 | 41.87 | 12.9 | 0.022 | UGC 9950 | |||
| 15 | 35 | 54.26 | 14 | 31 | 2.7 | 34.6 | 0.049 | 41.92 | 15.70 | 0.020 | S2 | Akn 479 | ||
| 15 | 38 | 10.00 | 57 | 36 | 12.0 | 12.1 | 0.034 | 42.90 | 16.20 | 0.074 | S1 | MCG+10.22.028 | ||
| 15 | 39 | 2.65 | 31 | 45 | 34.3 | 25.4 | 0.031 | 40.81 | 15.31 | 0.007 | NGC 5974 | |||
| 15 | 47 | 48.93 | 37 | 1 | 36.0 | 19.9 | 0.040 | 43.01 | 15.1 | 16.60 | 0.077 | em | 2 | NPM1G+37.0489 |
| 15 | 52 | 12.04 | 34 | 5 | 35.4 | 24.0 | 0.024 | 42.43 | 14.7 | 0.051 | abs | 2 | NPM1G+34.0353 | |
| 15 | 56 | 41.39 | 20 | 10 | 16.4 | 33.0 | 0.027 | 12.8 | 16.66 | |||||
| 16 | 4 | 55.53 | 28 | 9 | 56.9 | 21.8 | 0.047 | 43.08 | 12.1 | 16.54 | 0.077 | Zw 167.022 | ||
| 16 | 5 | 29.18 | 16 | 25 | 8.8 | 28.3 | 0.041 | 42.53 | 0.044 | UGC 10187B | ||||
| 16 | 5 | 35.57 | 44 | 12 | 22.0 | 16.9 | 0.056 | 42.65 | 13.5 | 16.33 | 0.043 | MCG+07.33.038 | ||
| 16 | 5 | 36.83 | 17 | 48 | 8.1 | 32.0 | 0.025 | 42.09 | 16.32 | 0.034 | H II | Mark 298 | ||
| 16 | 7 | 24.03 | 85 | 1 | 49.3 | 2.7 | 0.042 | 43.78 | 16.5 | 0.183 | S1 | S5 1616+85 | ||
| 16 | 7 | 35.36 | 13 | 56 | 37.6 | 28.9 | 0.026 | 42.11 | 13.1 | 16.21 | 0.034 | NGC 6066 | ||
| 16 | 9 | 5.53 | 27 | 53 | 34.0 | 10.2 | 0.041 | 42.23 | 12.5 | 16.84 | 0.031 | S2 | 1,2 | NPM1G+28.0373 |
| 16 | 9 | 35.18 | 63 | 58 | 1.2 | 8.2 | 0.047 | 42.75 | 14.0 | 16.82 | 0.053 | em | 1,2 | NPM1G+64.0143 |
| 16 | 11 | 11.40 | 61 | 16 | 4.5 | 13.2 | 0.030 | 42.09 | 14.95 | 0.031 | NGC 6095 | |||
| 16 | 11 | 13.89 | 36 | 58 | 24.3 | 27.6 | 0.031 | 42.79 | 12.5 | 16.95 | 0.068 | abs | 2 | KUG 1609+371A |
| 16 | 12 | 33.72 | 29 | 29 | 39.1 | 15.5 | 0.043 | 42.28 | 13.6 | 15.07 | 0.032 | NGC 6086 | ||
| 16 | 24 | 37.00 | 19 | 30 | 24.3 | 11.2 | 0.026 | 42.16 | 0.036 | Zw 109.013 | ||||
| 16 | 27 | 42.60 | 39 | 22 | 38.5 | 13.7 | 0.023 | 41.92 | 16.1 | 0.029 | PGC 058195 | |||
| 16 | 29 | 44.90 | 40 | 48 | 41.8 | 6.2 | 0.039 | 42.15 | 14.31 | 0.029 | NGC 6173 | |||
| 16 | 29 | 52.80 | 24 | 26 | 38.1 | 6.3 | 0.041 | 42.40 | 12.2 | 16.30 | 0.038 | S1.9 | Mark 883 | |
| 16 | 32 | 58.03 | 11 | 43 | 23.8 | 27.5 | 0.038 | 42.71 | 16.3 | 15.65 | 0.056 | Zw 080.046 | ||
| 16 | 33 | 48.87 | 35 | 53 | 18.8 | 33.3 | 0.022 | 42.13 | 16.57 | 0.038 | KUG 1632+359 | |||
| 16 | 36 | 57.72 | 55 | 46 | 58.2 | 8.6 | 0.038 | 42.11 | 13.5 | 16.92 | 0.028 | S? | 1,2 | |
| 16 | 37 | 20.55 | 41 | 11 | 20.1 | 16.3 | 0.038 | 42.22 | 13.0 | 16.74 | 0.032 | abs | 2 | NPM1G+41.0441 |
| 16 | 39 | 4.72 | 8 | 21 | 30.9 | 11.2 | 0.035 | 42.48 | 13.2 | 16.88 | 0.045 | em | 2 | NPM1G+08.0448 |
| 16 | 42 | 56.33 | 19 | 15 | 15.5 | 10.6 | 0.042 | 42.32 | 13.0 | 16.25 | 0.034 | IC 1224 | ||
| 16 | 43 | 4.22 | 61 | 34 | 43.3 | 22.7 | 0.032 | 41.70 | 13.9 | 14.13 | 0.019 | NGC 6223 | ||
| 16 | 56 | 1.58 | 21 | 12 | 42.0 | 10.4 | 0.028 | 42.46 | 15.4 | 16.99 | 0.049 | S1 | 1 | NPM1G+21.0507 |
| 16 | 57 | 45.01 | 68 | 30 | 53.1 | 13.9 | 0.045 | 42.42 | 13.1 | 15.88 | 0.037 | NGC 6289 | ||
| 17 | 0 | 27.21 | 51 | 59 | 11.6 | 14.3 | 0.044 | 42.64 | 12.7 | 16.87 | 0.048 | S1 | NPM1G+52.0273 | |
| 17 | 3 | 47.89 | 34 | 43 | 39.2 | 20.0 | 0.023 | 12.2 | ||||||
| 17 | 12 | 36.58 | 38 | 1 | 13.3 | 25.4 | 0.040 | 42.37 | 15.40 | 0.037 | IC 1245 | |||
| 17 | 15 | 58.85 | 36 | 23 | 23.1 | 15.2 | 0.048 | 43.18 | 13.6 | 16.13 | 0.086 | S1 | 2 | UGC 10782 |
| 17 | 23 | 22.08 | 32 | 49 | 55.2 | 16.7 | 0.022 | 42.63 | 13.2 | 16.55 | 0.067 | H II | 2 | |
| J2000 optical position | ||||||||||||||
|---|---|---|---|---|---|---|---|---|---|---|---|---|---|---|
| h | m | s | ∘ | ’ | ” | sep(”) | c/r | LX | OUS | OAPS | z | ref. | Name | |
| 17 | 37 | 56.34 | 41 | 38 | 32.0 | 19.9 | 0.023 | 42.68 | 15.1 | 16.39 | 0.070 | H II | 2 | IRAS F17363+4140 |
| 17 | 38 | 11.38 | 58 | 42 | 55.3 | 21.7 | 0.034 | 42.09 | 15.85 | 0.029 | S1 | NGC 6418 | ||
| 22 | 21 | 47.39 | 2 | 54 | 36.2 | 24.5 | 0.028 | 13.2 | 16.72 | |||||
| 22 | 28 | 29.51 | 16 | 46 | 59.6 | 11.6 | 0.034 | 42.23 | 12.9 | 15.01 | 0.034 | NGC 7291 | ||
| 22 | 32 | 30.68 | 8 | 12 | 33.0 | 18.2 | 0.034 | 41.96 | 12.5 | 16.08 | 0.025 | S1 | Akn 557 | |
| 22 | 35 | 40.82 | 1 | 29 | 5.9 | 26.2 | 0.293 | 43.64 | 14.3 | 16.63 | 0.059 | LEDA 087323 | ||
| 22 | 41 | 34.22 | 4 | 53 | 10.7 | 34.3 | 0.047 | 42.97 | 16.90 | 0.068 | S? | NPM1G+04.0574 | ||
| 22 | 49 | 54.69 | 11 | 36 | 30.1 | 23.7 | 0.054 | 42.19 | 14.35 | 0.026 | NGC 7385 | |||
| 22 | 58 | 1.97 | 13 | 8 | 4.4 | 10.7 | 0.021 | 41.75 | 15.08 | 0.025 | NGC 7432 | |||
| 23 | 13 | 58.36 | 3 | 42 | 54.4 | 5.6 | 0.031 | 42.62 | 13.0 | 16.42 | 0.056 | Zw 380.012 | ||
| 23 | 20 | 42.29 | 8 | 13 | 2.5 | 7.2 | 0.035 | 41.26 | 0.011 | Liner | NGC 7626 | |||
| 23 | 25 | 51.50 | 8 | 47 | 11.2 | 6.6 | 0.025 | 14.3 | 16.46 | KUG 2323+085 | ||||
| 23 | 31 | 50.20 | 25 | 32 | 40.0 | 6.7 | 0.038 | 13.3 | 16.59 | KUG 2329+252 | ||||
| 23 | 36 | 14.10 | 2 | 9 | 18.6 | 3.5 | 0.021 | 40.86 | 0.009 | H II | NGC 7714 | |||
| 23 | 56 | 1.96 | 7 | 31 | 23.4 | 3.1 | 0.049 | 42.53 | 13.6 | 16.84 | 0.040 | S1 | Mark 541 | |

We have observed 34 of the galaxies without a previously known redshift at the BAO and OHP observatories. The BAO observations were made during the period March 3 to 10, 2002 with the 2.6-m telescope using the SCORPIO spectral camera attached to the prime focus. The combination of the detector, a 20632058 1616 m pixel Loral Lick3 CCD, with a 600 g mm-1 grism resulted in the spectral range 3900-7400 Å with a dispersion of 1.7 Å pixel-1. The slit width was 18 (4.3 pixels) and was oriented EW. The spectral resolution was 5 Å FWHM. The exposure time was usually 45 min. The OHP observations were made between April 15 and 19, 2002 with the 1.93-m telescope and the spectrograph CARELEC (Lemaître et al. lemaitre89 (1989)) attached to the Cassegrain focus. The detector was a 20481024 13.513.5 m pixel EEV CCD. The dispersion was 1.75 Å pixel-1 and the spectral range 4075-7715 Å. The slit width was 20, corresponding to 3.7 pixels, and the resolution was 5.7 Å FWHM. The exposure time was usually 20 min. We found 13 absorption line galaxies, five starburst galaxies, six Seyfert 1, three Seyfert 2 and seven unclassifiable weak emission line galaxies. Fig. 7 shows the spectra of the Seyfert 1 and 2 galaxies and of three starburst galaxies.
In total the redshift of 164 of the galaxies is known. We have computed their 0.1-2.4 keV X-ray luminosity. Sixty-three are smaller than 1042 erg s-1 and forty-five, greater than 1042.5 erg s-1. As there are probably no starburst galaxies having an 0.1-2.4 keV X-ray luminosity substantially higher than 1042 erg s-1 (Moran et al. moran96 (1996); Condon et al. condon98 (1998)), most of the 45 high X-ray luminosity galaxies must be AGN. Among the 16 which have been classified, four are starbursts and 12 AGN. The 63 low X-ray luminosity galaxies could possibly be absorbed Seyfert 2s, low-luminosity AGN as well as starbursts, or elliptical galaxies with hot gas (Hornschemeier et al. hornschemeier01 (2001); hornschemeier03 (2003); Comastri et al. comastri02 (2003); Severgnini et al. severgnini03 (2003)). Several of our low X-ray luminosity sources have been classified as Liners, Seyfert 2s, Seyfert 1.9 or 1.8.
4 QSOs
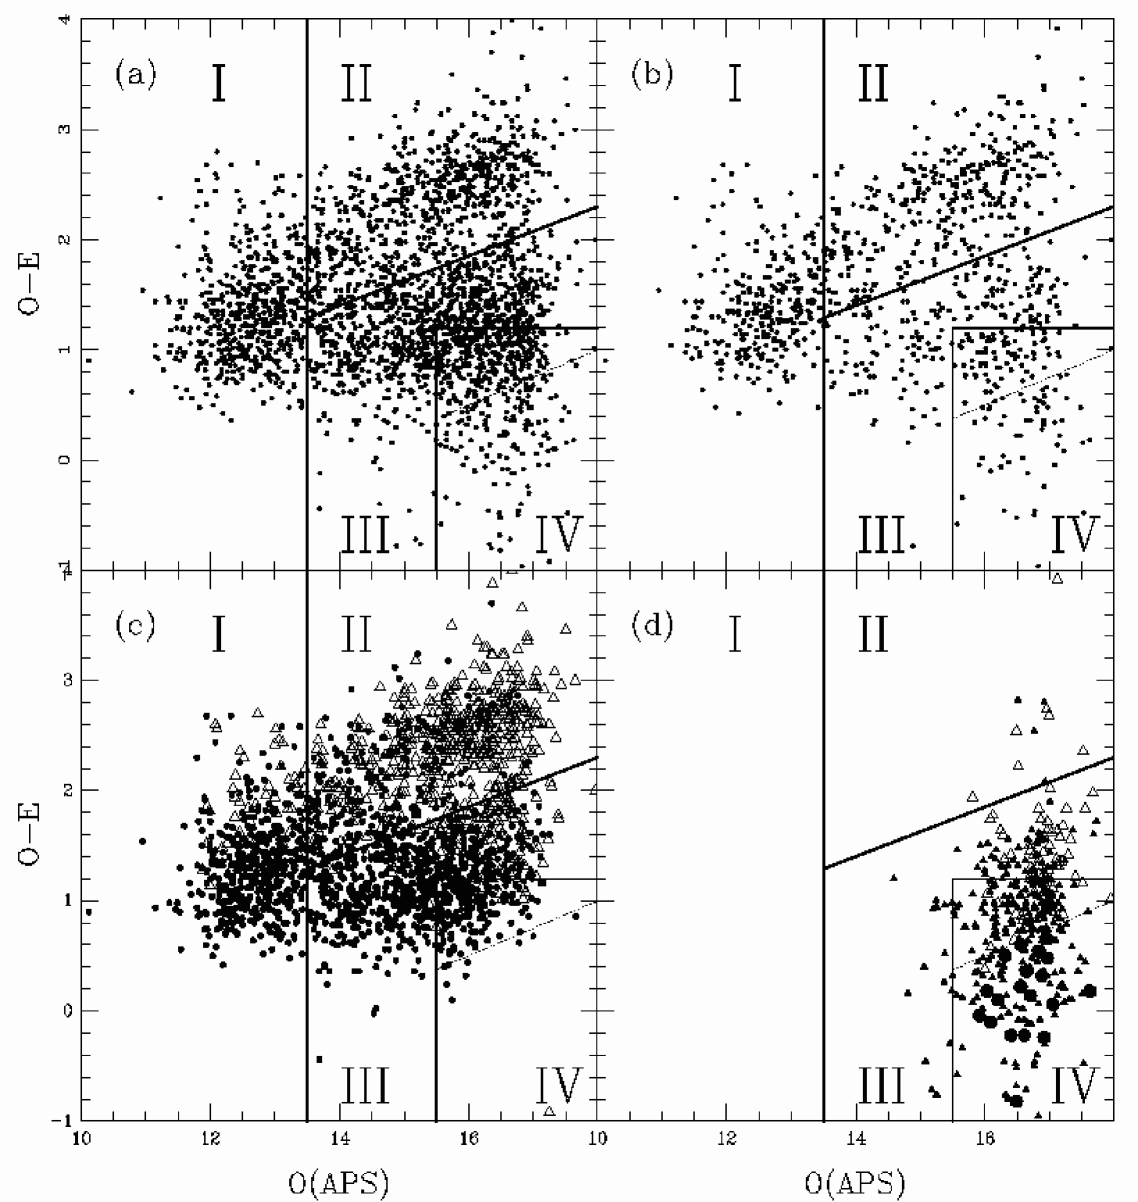
Figure 8 (a) shows the APS O–E colour index the O magnitude for the 2 652 starlike objects in the 3 212 sample. Fig. 8 (b) is the same for objects within 15 of a ROSAT-FSC source. These figures were divided into four zones.
| J2000 USNO position | ||||||||||||||
|---|---|---|---|---|---|---|---|---|---|---|---|---|---|---|
| h | m | s | ∘ | ’ | ” | ” | c/r | OUS | OAPS | O–E | z | Mabs | Name | |
| 0 | 6 | 23.08 | 12 | 35 | 53.2 | 20.8 | 0.030 | 15.8 | 16.26 | 0.36 | 0.98 | –28.4 | Q | RGB J0006+125 |
| 0 | 24 | 44.10 | 0 | 32 | 21.4 | 9.7 | 0.047 | 16.2 | 16.92 | 0.58 | 0.404 | –25.8 | Q | PB 5932 |
| 0 | 36 | 12.50 | 5 | 49 | 52.0 | 9.1 | 0.064 | 16.3 | 16.88 | 0.28 | 0.41 | –25.7 | Q | HS 0033+0533 |
| 0 | 52 | 5.57 | 0 | 35 | 38.4 | 28.6 | 0.024 | 16.3 | 16.80 | 1.04 | 0.399 | –25.7 | Q | Q 0049+0019A |
| 0 | 57 | 9.93 | 14 | 46 | 10.4 | 26.7 | 0.246 | 15.9 | 16.11 | 1.12 | 0.171 | –24.0 | Q | PHL 909 |
| 1 | 20 | 17.29 | 21 | 33 | 46.6 | 25.0 | 0.023 | 15.5 | 15.80 | 0.54 | 1.500 | –29.7 | Q | PG 0117+213 |
| 1 | 39 | 55.80 | 6 | 19 | 22.5 | 8.4 | 0.031 | 15.7 | 16.55 | 0.60 | 0.396 | –26.5 | Q | PHL 1092 |
| 1 | 40 | 35.02 | 23 | 44 | 51.1 | 25.1 | 0.029 | 16.1 | 16.64 | 0.98 | 0.32 | –25.4 | Q | HS 0137+2329 |
| 1 | 41 | 59.60 | 6 | 12 | 5.5 | 2.7 | 0.049 | 16.3 | 16.27 | 0.56 | 0.345 | –27.2 | Q | PHL 1106 |
| 3 | 18 | 25.57 | 15 | 59 | 56.7 | 11.2 | 0.033 | 16.3 | 16.58 | 0.02 | 0.515 | –25.9 | Q | US 3828 |
| 3 | 39 | 9.60 | 3 | 45 | 52.5 | 23.7 | 0.038 | 16.4 | 17.55 | 0.44 | 0.199 | –24.0 | Q | RXS J03391+0346 |
| 4 | 24 | 46.85 | 0 | 36 | 6.4 | 7.4 | 0.052 | 16.1 | 16.75 | 1.26 | BL | PKS 0422+00 | ||
| 8 | 15 | 59.21 | 41 | 44 | 57.1 | 17.9 | 0.021 | 15.8 | 15.97 | 0.32 | 1.28 | –29.3 | Q | KUV 08126+4154 |
| 8 | 22 | 36.88 | 54 | 18 | 36.4 | 33.7 | 0.042 | 16.3 | 16.65 | 1.12 | 0.086 | –22.3 | S1 | SBS 0818+544 |
| 8 | 43 | 49.78 | 26 | 19 | 11.1 | 19.4 | 0.068 | 16.4 | 17.23 | 0.20 | 0.258 | –24.7 | Q | HS 0840+2630 |
| 8 | 59 | 24.35 | 46 | 37 | 17.3 | 22.3 | 0.047 | 16.5 | 16.89 | 0.74 | 0.923 | –27.5 | Q | US 2068 |
| 9 | 0 | 47.30 | 74 | 44 | 26.3 | 16.6 | 0.045 | 16.1 | 0.77 | –27.4 | Q | HS 0855+7456 | ||
| 9 | 19 | 57.63 | 51 | 6 | 9.1 | 17.1 | 0.039 | 15.8 | 16.35 | –0.80 | 0.553 | –27.0 | Q | SBS 0916+513 |
| 9 | 25 | 14.35 | 54 | 44 | 27.2 | 10.4 | 0.048 | 15.9 | 16.66 | –0.12 | 0.476 | –26.3 | Q | SBS 0921+549 |
| 9 | 29 | 9.82 | 46 | 44 | 24.1 | 15.9 | 0.025 | 15.6 | 15.66 | 0.18 | 0.240 | –25.3 | Q | US 645 |
| 9 | 36 | 25.45 | 39 | 49 | 33.7 | 24.8 | 0.033 | 16.1 | 16.81 | 0.82 | 1.25 | –28.7 | Q | KUV 09333+4003 |
| 9 | 37 | 1.93 | 34 | 25 | 0.0 | 12.7 | 0.031 | 16.0 | 16.55 | 0.22 | 0.908 | –28.1 | Q | Ton 1078 |
| 9 | 41 | 33.72 | 59 | 48 | 11.3 | 13.2 | 0.045 | 16.3 | 16.70 | 0.36 | 0.966 | –27.9 | Q | SBS 0938+600 |
| 9 | 56 | 49.89 | 25 | 15 | 16.0 | 8.0 | 0.048 | 16.2 | 16.92 | 0.84 | 0.712 | –27.2 | Q | OK 290 |
| 10 | 4 | 20.10 | 5 | 13 | 0.6 | 22.1 | 0.021 | 16.2 | 16.55 | 0.26 | 0.161 | –23.8 | Q | PG 1001+054 |
| 10 | 13 | 30.20 | 53 | 15 | 59.6 | 6.7 | 0.025 | 16.2 | 16.64 | 0.36 | 1.495 | –29.1 | Q | SBS 1010+535 |
| 10 | 15 | 57.04 | 1 | 9 | 13.7 | 16.1 | 0.082 | 16.3 | 16.97 | 0.94 | 0.779 | –27.2 | Q | Q 1013+0124 |
| 10 | 33 | 59.50 | 35 | 55 | 9.0 | 14.9 | 0.046 | 16.3 | 16.76 | 0.92 | 0.169 | –23.8 | Q | CSO 275 |
| 10 | 43 | 55.52 | 56 | 27 | 57.0 | 18.6 | 0.028 | 16.3 | 16.81 | –0.40 | 1.951 | –29.6 | Q | SBS 1040+567 |
| 11 | 17 | 6.41 | 44 | 13 | 33.8 | 8.1 | 0.023 | 14.8 | 15.06 | 0.40 | 0.144 | –24.9 | Q | PG 1114+445 |
| 11 | 30 | 4.76 | 41 | 16 | 19.5 | 23.2 | 0.035 | 15.7 | 16.20 | 0.10 | 1.530 | –29.5 | Q | KUV 11274+4133 |
| 11 | 33 | 35.40 | 9 | 39 | 1.8 | 24.6 | 0.029 | 16.4 | 17.05 | 0.06 | 0.379 | –25.5 | Q | RX J11335+0939 |
| 11 | 43 | 47.71 | 11 | 28 | 48.1 | 20.6 | 0.046 | 15.5 | 16.38 | 0.80 | 0.118 | –23.8 | Q | RX J11437+1128 |
| 11 | 52 | 51.90 | 33 | 7 | 18.8 | 2.7 | 0.033 | 16.1 | 16.30 | 0.40 | 1.389 | –28.8 | Q | CSO 373 |
| 11 | 55 | 7.62 | 52 | 1 | 29.4 | 6.4 | 0.036 | 16.4 | 16.46 | 1.08 | 0.156 | –23.5 | Q | SBS 1152+523 |
| 11 | 59 | 6.78 | 53 | 6 | 43.5 | 6.1 | 0.043 | 16.5 | 17.19 | 0.36 | 0.482 | –25.9 | Q | MS 11565+5323 |
| 12 | 7 | 4.53 | 38 | 40 | 24.6 | 3.7 | 0.045 | 16.3 | 16.64 | 0.00 | 0.572 | –26.4 | Q | RXS J12070+3840 |
| 12 | 17 | 40.83 | 49 | 31 | 17.9 | 1.1 | 0.049 | 16.5 | 17.62 | 0.18 | 0.730 | –26.6 | Q | SBS 1215+497 |
| 12 | 22 | 10.01 | 27 | 19 | 2.3 | 6.4 | 0.046 | 15.9 | 16.90 | 0.52 | 0.442 | –26.3 | Q | RXS J12221+2719 |
| 12 | 23 | 0.23 | 55 | 40 | 0.3 | 9.4 | 0.057 | 16.5 | 17.48 | 0.48 | 0.905 | –27.5 | Q | SBS 1220+559 |
| 12 | 28 | 24.97 | 31 | 28 | 37.7 | 24.8 | 0.024 | 15.6 | 16.28 | 0.28 | 2.219 | –30.4 | Q | B2 1225+31 |
| 12 | 30 | 50.04 | 1 | 15 | 22.6 | 6.4 | 0.041 | 14.4 | 14.81 | 0.16 | 0.117 | –24.8 | Q | RX J12308+0115 |
| 12 | 33 | 26.05 | 45 | 12 | 23.1 | 11.2 | 0.032 | 16.5 | 16.91 | –0.24 | 1.958 | –29.4 | Q | HS 1231+4528 |
| 12 | 44 | 10.82 | 17 | 21 | 4.5 | 16.3 | 0.027 | 15.7 | 16.58 | 0.74 | 1.283 | –28.8 | Q | PG 1241+176 |
| 13 | 6 | 5.72 | 80 | 8 | 20.5 | 10.9 | 0.035 | 16.3 | 1.183 | –28.3 | Q | S5 1305+80 | ||
| 13 | 13 | 21.39 | 78 | 21 | 53.9 | 11.9 | 0.026 | 15.6 | 2.00 | –30.3 | Q | HS 1312+7837 | ||
| 13 | 19 | 56.24 | 27 | 28 | 8.4 | 23.4 | 0.031 | 15.5 | 16.54 | 0.22 | 1.014 | –28.7 | Q | CSO 873 |
| 13 | 41 | 0.81 | 41 | 23 | 14.2 | 17.0 | 0.022 | 16.4 | 16.36 | –0.02 | 1.204 | –28.3 | Q | PG 1338+416 |
| 13 | 47 | 19.40 | 59 | 2 | 32.5 | 10.3 | 0.025 | 16.2 | 16.48 | 0.22 | 0.768 | –27.3 | Q | SBS 1345+592 |
| 13 | 47 | 37.45 | 30 | 12 | 52.4 | 20.5 | 0.035 | 15.7 | 16.12 | 0.68 | 0.118 | –23.6 | Q | Q J1347+3012 |
| 13 | 51 | 28.30 | 1 | 3 | 38.5 | 17.5 | 0.040 | 16.5 | 17.35 | 0.58 | 1.086 | –27.9 | Q | Q 1348+0118 |
| 14 | 2 | 44.52 | 15 | 59 | 56.2 | 1.9 | 0.031 | 16.3 | 16.66 | 1.56 | 0.245 | –24.5 | BL | MC 1400+162 |
| 14 | 27 | 35.60 | 26 | 32 | 14.5 | 26.8 | 0.040 | 15.4 | 15.18 | –0.72 | 0.366 | –26.6 | Q | PG 1425+267 |
| 14 | 36 | 45.79 | 63 | 36 | 37.6 | 32.1 | 0.038 | 15.7 | 16.61 | –0.22 | 2.066 | –30.4 | Q | S4 1435+63 |
| 14 | 50 | 26.68 | 58 | 39 | 44.7 | 9.9 | 0.046 | 15.8 | 16.13 | 1.14 | 0.210 | –23.8 | Q | Mark 830 |
| 14 | 51 | 53.63 | 72 | 14 | 46.8 | 5.8 | 0.027 | 16.3 | 0.75 | –27.1 | Q | HS 1451+7227 | ||
| J2000 USNO position | ||||||||||||||
|---|---|---|---|---|---|---|---|---|---|---|---|---|---|---|
| h | m | s | ∘ | ’ | ” | ” | c/r | OUS | OAPS | O–E | z | Mabs | Name | |
| 15 | 27 | 28.64 | 65 | 48 | 10.3 | 14.0 | 0.046 | 16.2 | 16.77 | 0.56 | 0.345 | –25.5 | Q | FBS 1526+659 |
| 15 | 50 | 43.65 | 11 | 20 | 47.4 | 23.7 | 0.040 | 16.3 | 16.33 | 0.14 | 0.436 | –25.9 | Q | MC 1548+114 |
| 15 | 51 | 58.16 | 58 | 6 | 44.7 | 4.5 | 0.036 | 16.2 | 16.74 | 1.14 | 1.320 | –28.7 | Q | SBS 1550+582 |
| 16 | 19 | 40.54 | 25 | 43 | 23.3 | 13.1 | 0.035 | 16.4 | 16.62 | 1.36 | 0.268 | –24.7 | Q | RX J16196+2543 |
| 16 | 23 | 19.93 | 41 | 17 | 2.7 | 26.3 | 0.030 | 16.5 | 16.88 | 0.32 | 1.618 | –28.9 | Q | KUV 16217+4124 |
| 16 | 26 | 37.28 | 58 | 9 | 17.2 | 6.0 | 0.044 | 16.2 | 0.751 | –27.2 | Q | SBS 1625+582 | ||
| 16 | 28 | 25.70 | 8 | 33 | 0.1 | 10.1 | 0.031 | 16.4 | 17.22 | 0.32 | 0.44 | –25.8 | Q | HS 1626+0839 |
| 16 | 31 | 43.83 | 52 | 53 | 43.8 | 5.7 | 0.048 | 16.5 | 16.81 | 0.44 | 0.352 | –25.2 | Q | SBS 1630+530 |
| 16 | 32 | 1.11 | 37 | 37 | 50.0 | 14.5 | 0.034 | 16.0 | 16.60 | 0.54 | 1.478 | –29.4 | Q | PG 1630+377 |
| 16 | 32 | 34.68 | 73 | 59 | 43.0 | 3.2 | 0.030 | 16.1 | 0.208 | –24.4 | Q | RXS J16325+7359 | ||
| 16 | 34 | 29.01 | 70 | 31 | 32.3 | 1.2 | 0.049 | 14.9 | 1.337 | –30.1 | Q | PG 1634+706 | ||
| 16 | 37 | 7.53 | 41 | 40 | 26.9 | 17.0 | 0.028 | 16.2 | 16.28 | 1.60 | 0.765 | –27.3 | Q | KUV 16355+4146 |
| 17 | 1 | 0.62 | 64 | 12 | 9.3 | 19.0 | 0.035 | 15.9 | 16.03 | 0.18 | 2.736 | –31.2 | Q | HS 1700+6416 |
| 17 | 4 | 41.39 | 60 | 44 | 30.5 | 8.4 | 0.042 | 15.6 | 15.86 | 0.76 | 0.371 | –26.3 | Q | 3C 351.0 |
| 17 | 6 | 48.06 | 32 | 14 | 22.9 | 17.0 | 0.029 | 16.2 | 16.94 | 0.66 | 1.070 | –28.2 | Q | RGB J1706+322 |
| 17 | 19 | 34.18 | 25 | 10 | 58.6 | 16.9 | 0.039 | 16.4 | 16.87 | 1.34 | 0.579 | –26.4 | Q | RX J17195+2510 |
| 22 | 53 | 7.37 | 19 | 42 | 34.7 | 21.5 | 0.039 | 16.4 | 16.75 | 0.92 | 0.284 | –24.9 | Q | HS 2250+1926 |
| 23 | 7 | 45.62 | 19 | 1 | 20.8 | 11.6 | 0.033 | 16.4 | 17.13 | 0.98 | 0.313 | –25.0 | Q | PKS 2305+18 |
| 23 | 11 | 59.50 | 9 | 26 | 1.4 | 7.4 | 0.048 | 16.3 | 17.51 | 0.16 | 0.479 | –26.1 | Q | RX J23119+0925 |
| 23 | 50 | 10.07 | 8 | 12 | 55.3 | 16.6 | 0.025 | 16.4 | 18.19 | 1.70 | –29.1 | Q | HS 2347+0756 | |
Objects brighter than OAPS=13.5 (zone I) are most probably bright stars. Indeed among the 576 objects in this zone, 84 could not be classified on the Hamburg slitless spectra because of saturation or overlap, but all others are stars (25 BA, 416 FG and 51 K). Objects located above the diagonal line (zone II) are very red and are likely to be late-type stars. Fig. 8 (c) shows that indeed K and M stars are mostly located in this zone. Among the 709 objects in this zone, 13 are affected by overlapping or saturation, 685 are stars (including 437 K stars); 11 were too weak to be classified.

We cross-correlated the FSC with the current version of the Véron-Cetty & Véron (veron01 (2001)) AGN catalogue. We found 76 coincidences within 35 with a previously known AGN brighter than OUSNO=16.5 (they are listed in Table 3); 68 have magnitude and colour in the APS database. Fig. 9 is a plot of the APS O–E colour index the O magnitude for these 68 AGN; 87% (59/68) are located in zone IV defined by OAPS15.5 and O–E1.2. With this limit on O–E, we exclude red QSOs; this is unavoidable because of the very large number of stars with O–E1.2. These objects can be recovered by examination of the slitless spectra. Figs. 8 (d) and 9 show that the distributions of the representative points of the EBL-WK and BLUE-WK objects on the one hand and of that of QSOs on the other hand are quite similar.
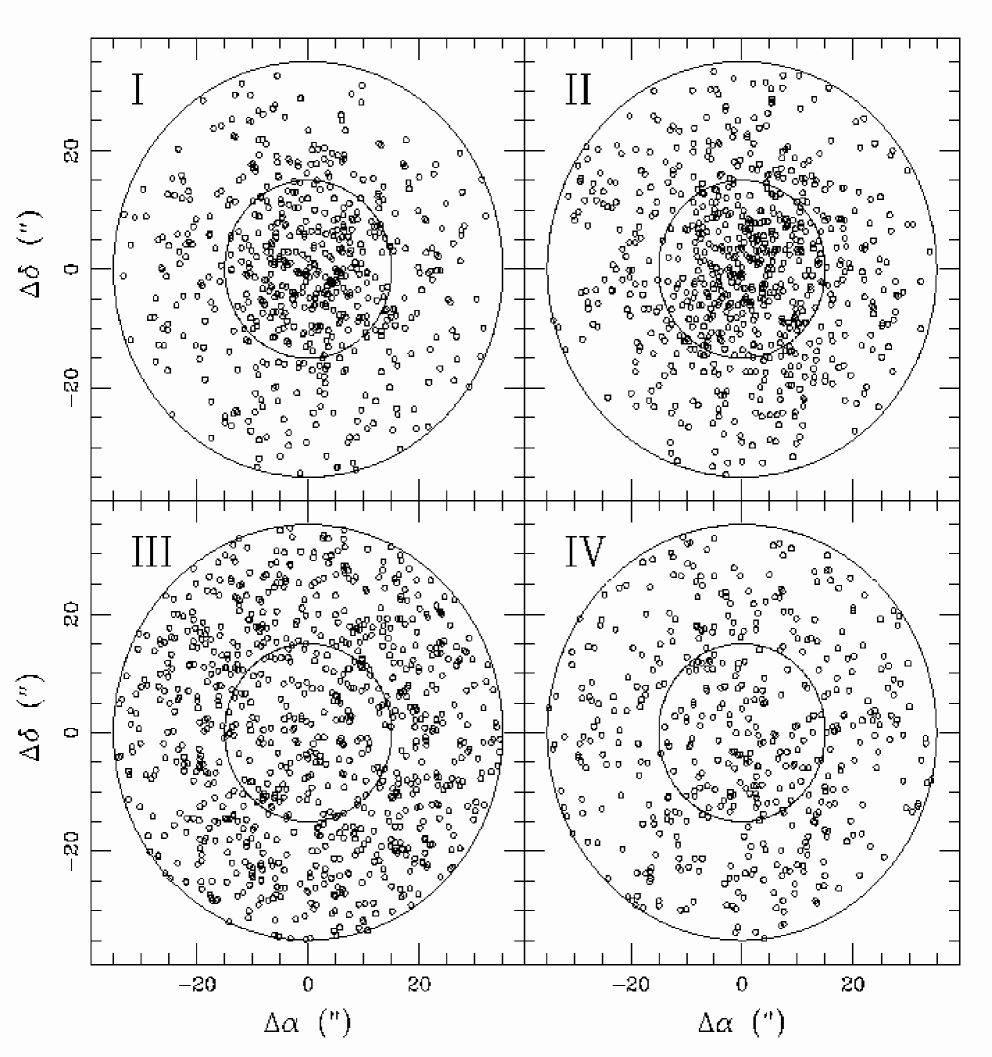
Figure 10 shows the differences between the X-ray and optical positions for the starlike objects in the 3 212 sample in each of the four zones defined above. In the first two zones there is an obvious concentration towards the centre showing that most of the coincidences are genuine associations. In contrast the distribution of the points in zone III is quite uniform suggesting that most of these coincidences are due to chance.
In zone III, the observed fraction of coincidences within 15 is =0.20, suggesting that there are indeed very few true associations (=0.05). On the other hand, in zone I and II, we found =0.47 and 0.45 respectively showing that basically all objects (90 and 84% respectively) are real associations.
For the 212 starlike objects classified as BLUE-WK on the Hamburg slitless spectra, we found =0.24, so the fraction of true coincidences is about 18%, while for the 84 EBL-WK objects, =0.51 and, within the statistical uncertainties, all are genuine associations.
| J2000 USNO position | |||||||||||||||
|---|---|---|---|---|---|---|---|---|---|---|---|---|---|---|---|
| h | m | s | ∘ | ’ | ” | ” | c/r | OUS | OAPS | O–E | z | Mabs | Ref. | Name | |
| 0 | 11 | 19.46 | 28 | 17 | 50.8 | 18.7 | 0.023 | 15.5 | 15.88 | 0.12 | * | 1 | |||
| 0 | 13 | 4.80 | 10 | 11 | 28.6 | 5.8 | 0.023 | 16.0 | 16.25 | 0.32 | 0.239 | –24.9 | Q | 1 | |
| 0 | 40 | 46.17 | 18 | 54 | 24.3 | 17.0 | 0.026 | 16.0 | 16.71 | –0.12 | 0.153 | –23.3 | Q | 1 | |
| 1 | 7 | 37.51 | 22 | 22 | 32.3 | 33.7 | 0.042 | 16.2 | 16.89 | 0.68 | * | 2 | |||
| 1 | 20 | 46.96 | 23 | 31 | 40.1 | 28.7 | 0.047 | 15.9 | 16.27 | 0.54 | * | 2 | |||
| 1 | 37 | 37.24 | 30 | 2 | 49.1 | 13.1 | 0.035 | 13.5 | 16.90 | 0.36 | DN | TX Tri | |||
| 2 | 55 | 30.70 | 7 | 25 | 57.1 | 19.4 | 0.030 | 16.3 | 16.97 | 0.66 | 0.707 | –27.0 | Q | 1 | |
| 3 | 53 | 15.60 | 9 | 56 | 35.1 | 24.0 | 0.030 | 16.0 | 16.49 | –0.82 | * | 2 | |||
| 8 | 23 | 46.65 | 24 | 53 | 51.2 | 18.5 | 0.039 | 15.6 | 15.83 | –0.40 | WD | 1 | TON 316 | ||
| 8 | 39 | 34.28 | 23 | 34 | 10.4 | 12.8 | 0.041 | 15.8 | 16.49 | –0.52 | DA | PG 0836+237 | |||
| 8 | 45 | 51.14 | 60 | 9 | 13.7 | 13.3 | 0.027 | 16.0 | 16.30 | –0.46 | DA | PG 0841+603 | |||
| 8 | 50 | 20.09 | 54 | 33 | 50.5 | 17.3 | 0.038 | 16.4 | 16.78 | 0.62 | * | 1 | |||
| 8 | 56 | 32.44 | 50 | 41 | 14.1 | 5.1 | 0.027 | 15.8 | 15.57 | –0.58 | 0.235 | –25.0 | Q | 1 | |
| 9 | 3 | 32.62 | 16 | 26 | 1.4 | 21.7 | 0.037 | 16.2 | 16.59 | 0.24 | * | 1 | LB 9181 | ||
| 9 | 10 | 35.38 | 31 | 27 | 45.9 | 27.0 | 0.048 | 16.3 | 16.21 | 0.42 | * | 1 | |||
| 9 | 10 | 37.97 | 53 | 12 | 2.8 | 19.3 | 0.030 | 16.4 | 16.82 | 0.52 | * | 1 | |||
| 9 | 12 | 15.50 | 1 | 19 | 59.3 | 3.8 | 0.041 | 16.5 | 16.76 | –0.50 | * | 1 | |||
| 9 | 20 | 47.61 | 51 | 25 | 38.8 | 33.1 | 0.021 | 15.7 | 15.65 | 0.12 | * | 1 | |||
| 9 | 30 | 6.76 | 52 | 28 | 4.0 | 12.0 | 0.039 | 15.8 | 16.37 | –0.02 | * | PG 0926+527 | |||
| 9 | 30 | 21.87 | 23 | 53 | 30.1 | 19.2 | 0.027 | 16.0 | 16.70 | 0.14 | 0.243 | –24.3 | Q | 1 | |
| 9 | 30 | 34.46 | 20 | 44 | 16.9 | 5.2 | 0.045 | 16.1 | 17.09 | 0.64 | 1.169 | –28.4 | Q | 1 | |
| 9 | 45 | 13.97 | 15 | 10 | 11.7 | 17.9 | 0.057 | 15.8 | 17.66 | 0.86 | * | 1 | |||
| 9 | 46 | 34.50 | 13 | 50 | 58.3 | 34.4 | 0.027 | 15.8 | 16.75 | 0.10 | CV | 1 | |||
| 9 | 49 | 39.77 | 17 | 52 | 49.5 | 12.0 | 0.021 | 16.3 | 18.65 | 0.60 | |||||
| 9 | 52 | 45.70 | 2 | 9 | 38.7 | 17.1 | 0.025 | 15.2 | 16.32 | –0.76 | DA | PG 0950+024 | |||
| 9 | 56 | 49.88 | 29 | 50 | 14.6 | 10.7 | 0.046 | 15.4 | 16.09 | –0.10 | 0.845 | –28.5 | Q | 1 | TON 465 |
| 9 | 57 | 11.78 | 63 | 10 | 10.2 | 3.8 | 0.024 | 16.4 | 16.25 | –0.06 | 0.918 | –27.6 | Q | 1 | |
| 10 | 6 | 14.64 | 44 | 19 | 7.1 | 15.6 | 0.030 | 16.5 | 16.93 | –0.30 | DA | ||||
| 10 | 34 | 53.07 | 44 | 57 | 23.1 | 20.5 | 0.023 | 16.1 | 16.57 | 0.38 | 1.422 | –29.0 | Q | 1 | |
| 10 | 35 | 27.50 | 49 | 58 | 27.7 | 22.8 | 0.021 | 16.5 | 17.44 | 0.36 | 1.427 | –28.5 | Q | 1 | |
| 10 | 44 | 19.33 | 19 | 57 | 47.9 | 24.2 | 0.039 | 15.6 | 15.90 | 0.44 | * | 1 | |||
| 10 | 46 | 42.30 | 39 | 20 | 18.2 | 8.3 | 0.043 | 16.4 | 17.16 | 0.22 | 0.390 | –25.3 | Q | 1 | |
| 10 | 47 | 30.55 | 10 | 17 | 28.9 | 17.7 | 0.228 | 15.4 | 15.81 | 0.08 | 0.145 | –24.3 | Q | 1 | |
| 11 | 8 | 42.46 | 16 | 50 | 40.2 | 31.2 | 0.030 | 15.6 | 16.48 | 0.04 | * | 1 | |||
| 11 | 14 | 1.95 | 52 | 27 | 11.6 | 29.8 | 0.023 | 15.5 | 15.62 | 0.40 | * | 1 | |||
| 11 | 15 | 7.70 | 2 | 37 | 57.7 | 7.6 | 0.024 | 16.5 | 17.08 | –0.04 | 0.564 | –26.1 | Q | 1 | |
| 11 | 26 | 16.19 | 32 | 59 | 53.7 | 29.3 | 0.029 | 16.2 | 15.66 | 0.24 | * | 1 | |||
| 11 | 33 | 31.23 | 58 | 57 | 47.8 | 19.9 | 0.025 | 15.9 | 15.98 | 0.44 | * | 1 | |||
| 11 | 34 | 25.08 | 23 | 16 | 8.8 | 24.0 | 0.039 | 16.3 | 16.66 | 0.64 | * | 1 | |||
| 11 | 38 | 36.32 | 47 | 55 | 10.0 | 13.3 | 0.046 | 16.1 | 17.53 | –0.48 | * | 1 | |||
| 11 | 41 | 52.82 | 25 | 35 | 33.5 | 10.8 | 0.042 | 16.3 | 16.82 | –0.96 | * | 1 | |||
| 11 | 47 | 47.34 | 26 | 0 | 49.0 | 10.9 | 0.042 | 15.5 | 15.84 | 0.00 | * | 1 | |||
| 12 | 19 | 57.97 | 27 | 8 | 57.2 | 9.5 | 0.023 | 16.1 | 17.17 | 0.76 | * | 1 | |||
| 12 | 31 | 25.72 | 25 | 55 | 59.8 | 5.7 | 0.032 | 15.8 | 16.16 | 0.54 | * | 1 | |||
| 12 | 32 | 54.28 | 36 | 44 | 7.4 | 32.5 | 0.022 | 16.0 | 16.61 | –0.08 | WD | 1 | CBS 353 | ||
| 12 | 52 | 30.85 | 14 | 26 | 9.3 | 24.3 | 0.029 | 16.3 | 17.30 | 0.10 | |||||
| 12 | 57 | 37.02 | 16 | 30 | 48.6 | 13.5 | 0.035 | 16.1 | 16.95 | 0.66 | 1.017 | –28.2 | Q | 1 | |
| 12 | 59 | 38.22 | 60 | 38 | 59.4 | 15.9 | 0.039 | 16.3 | 16.47 | –0.48 | * | 1 | SBS 1257+609 | ||
| 12 | 59 | 44.45 | 68 | 4 | 0.8 | 30.9 | 0.022 | 16.3 | 16.64 | –0.72 | * | 1 | FBS 1257+683 | ||
| 13 | 0 | 6.40 | 44 | 42 | 50.9 | 13.9 | 0.036 | 16.2 | 16.06 | 0.46 | * | 1 | |||
| 13 | 10 | 11.30 | 7 | 58 | 16.5 | 21.2 | 0.030 | 15.8 | 16.52 | –0.08 | 0.578 | –27.0 | Q | 1 | |
| 13 | 13 | 15.90 | 9 | 18 | 20.4 | 27.7 | 0.021 | 16.4 | 17.34 | 0.10 | 1.790 | –29.2 | Q | 1 | |
| 13 | 14 | 30.78 | 13 | 7 | 45.8 | 23.8 | 0.044 | 16.3 | 17.00 | 0.24 | 0.741 | –27.1 | Q | 1 | |
| 13 | 20 | 1.10 | 7 | 18 | 17.1 | 21.1 | 0.038 | 16.5 | 16.97 | 0.74 | 0.866 | –26.9 | Q | 1 | |
| 13 | 20 | 22.53 | 30 | 56 | 22.4 | 19.8 | 0.029 | 16.4 | 17.22 | –0.04 | 1.587 | –28.1 | Q | 1 | US 583 |
| 13 | 24 | 47.70 | 3 | 24 | 32.9 | 15.5 | 0.040 | 16.5 | 16.84 | 0.54 | 0.303 | –24.9 | Q | 1 | |
| J2000 USNO position | |||||||||||||||
|---|---|---|---|---|---|---|---|---|---|---|---|---|---|---|---|
| h | m | s | ∘ | ’ | ” | ” | c/r | OUS | OAPS | O–E | z | Mabs | Ref. | Name | |
| 13 | 32 | 51.09 | 15 | 29 | 30.9 | 23.9 | 0.042 | 15.5 | 15.56 | 0.14 | * | 1 | |||
| 13 | 33 | 45.80 | 5 | 38 | 42.6 | 22.2 | 0.028 | 15.5 | 15.74 | 0.10 | * | 1 | |||
| 13 | 40 | 59.95 | 60 | 26 | 11.8 | 17.6 | 0.034 | 16.2 | 16.48 | –0.68 | DA | SBS 1339+606 | |||
| 13 | 42 | 46.90 | 18 | 44 | 43.8 | 22.4 | 0.039 | 16.4 | 16.69 | 0.12 | 0.382 | –25.5 | Q | 1 | |
| 13 | 50 | 13.97 | 14 | 35 | 47.4 | 30.4 | 0.023 | 16.4 | 16.93 | 0.48 | * | 1 | |||
| 13 | 51 | 25.25 | 19 | 5 | 33.4 | 10.8 | 0.027 | 16.4 | 16.89 | 0.64 | * | 1 | |||
| 13 | 54 | 48.82 | 49 | 13 | 37.1 | 19.8 | 0.028 | 15.5 | 15.68 | 0.32 | * | 1 | |||
| 13 | 55 | 43.99 | 20 | 12 | 31.8 | 19.9 | 0.030 | 15.6 | 16.11 | 0.30 | * | 1 | |||
| 13 | 58 | 41.50 | 2 | 49 | 12.5 | 21.1 | 0.046 | 16.2 | 16.85 | –0.08 | * | 1 | |||
| 14 | 6 | 58.74 | 14 | 42 | 38.6 | 13.0 | 0.034 | 15.4 | 15.84 | 0.34 | 0.264 | –25.7 | Q | 1 | |
| 14 | 9 | 39.24 | 28 | 16 | 49.9 | 25.2 | 0.035 | 16.1 | 16.93 | 0.34 | 0.165 | –23.9 | Q | 1 | |
| 14 | 10 | 57.74 | 64 | 33 | 10.6 | 18.8 | 0.041 | 16.4 | 16.83 | 0.06 | 0.462 | –25.9 | Q | 1 | |
| 14 | 17 | 30.16 | 13 | 0 | 1.6 | 11.6 | 0.021 | 15.7 | 16.00 | 0.38 | * | 1 | |||
| 14 | 19 | 25.77 | 38 | 2 | 49.0 | 12.7 | 0.039 | 16.2 | 17.22 | 0.08 | 0.517 | –26.3 | Q | 1 | |
| 14 | 31 | 10.98 | 14 | 23 | 8.3 | 3.7 | 0.022 | 16.1 | 15.91 | –0.04 | 1.425 | –29.0 | Q | 1 | |
| 14 | 47 | 50.12 | 38 | 5 | 30.3 | 12.2 | 0.023 | 15.8 | 16.28 | 0.04 | * | 1 | |||
| 15 | 0 | 31.80 | 48 | 36 | 47.0 | 16.0 | 0.021 | 16.4 | 16.72 | 0.48 | 1.031 | –27.9 | Q | 1 | |
| 15 | 5 | 27.62 | 29 | 47 | 18.7 | 8.7 | 0.036 | 15.0 | 15.65 | –0.34 | 0.527 | –27.6 | Q | 1 | CSO 1080 |
| 15 | 8 | 32.28 | 67 | 42 | 43.4 | 9.0 | 0.032 | 16.0 | 17.12 | 0.14 | 0.336 | –25.8 | Q | 1 | |
| 15 | 12 | 44.60 | 9 | 31 | 0.8 | 23.0 | 0.037 | 15.9 | 16.61 | 0.56 | * | 1 | |||
| 15 | 16 | 32.30 | 12 | 13 | 50.5 | 10.6 | 0.028 | 16.2 | 17.26 | 0.78 | BL | 1 | |||
| 15 | 44 | 3.76 | 26 | 48 | 38.6 | 21.7 | 0.023 | 16.4 | 17.15 | 0.74 | * | 1 | |||
| 15 | 45 | 53.50 | 9 | 36 | 20.6 | 19.6 | 0.032 | 16.1 | 16.40 | –0.22 | |||||
| 15 | 48 | 33.03 | 44 | 22 | 26.1 | 12.7 | 0.021 | 16.3 | 16.97 | 0.48 | 0.322 | –25.2 | Q | 1 | |
| 15 | 51 | 9.60 | 45 | 42 | 52.1 | 22.5 | 0.036 | 15.6 | 15.95 | 0.32 | |||||
| 15 | 51 | 52.45 | 19 | 11 | 4.1 | 34.9 | 0.034 | 15.8 | 16.31 | 0.50 | |||||
| 15 | 53 | 4.93 | 35 | 48 | 28.6 | 25.2 | 0.033 | 16.1 | 17.20 | 0.72 | 0.722 | –26.8 | Q | 1 | |
| 15 | 56 | 9.90 | 3 | 9 | 22.5 | 9.6 | 0.037 | 16.3 | 16.80 | 0.48 | 0.131 | –23.2 | S1n | 1 | |
| 16 | 5 | 19.72 | 14 | 48 | 52.5 | 15.5 | 0.040 | 16.2 | 16.51 | 0.00 | 0.371 | –25.7 | Q | 1 | |
| 16 | 9 | 47.80 | 7 | 12 | 33.2 | 27.8 | 0.021 | 16.4 | 16.95 | 0.64 | * | 1 | |||
| 16 | 11 | 36.58 | 15 | 20 | 54.6 | 18.8 | 0.030 | 16.3 | 16.69 | 0.40 | 1.309 | –28.6 | Q | 1 | |
| 16 | 17 | 42.10 | 6 | 2 | 23.8 | 20.4 | 0.078 | 15.5 | 15.69 | 0.42 | * | 1 | |||
| 16 | 28 | 35.38 | 45 | 20 | 43.3 | 34.1 | 0.022 | 16.4 | 17.00 | 0.68 | * | 1 | |||
| 16 | 30 | 9.65 | 45 | 16 | 37.9 | 21.7 | 0.022 | 16.5 | 16.96 | 0.32 | * | 1 | |||
| 16 | 31 | 10.46 | 38 | 44 | 49.6 | 7.8 | 0.036 | 15.8 | 15.97 | 0.48 | * | 1 | |||
| 16 | 45 | 20.15 | 61 | 35 | 9.7 | 3.8 | 0.023 | 16.4 | 16.89 | 0.64 | 0.410 | –25.5 | Q | 1 | |
| 16 | 46 | 15.52 | 25 | 41 | 43.3 | 15.7 | 0.047 | 16.4 | 17.26 | 0.56 | 0.188 | –23.9 | Q | 1 | |
| 17 | 18 | 28.97 | 57 | 34 | 22.3 | 6.4 | 0.039 | 15.9 | 16.07 | 0.48 | 0.100 | –22.9 | S1n | 1 | |
| 17 | 20 | 13.19 | 49 | 55 | 26.4 | 28.8 | 0.027 | 16.0 | 15.89 | 0.36 | * | 1 | |||
| 17 | 21 | 45.75 | 57 | 16 | 56.7 | 31.5 | 0.021 | 15.8 | 15.87 | 0.24 | * | 1 | |||
| 17 | 28 | 13.44 | 32 | 22 | 5.8 | 10.8 | 0.022 | 16.4 | 17.08 | 0.34 | 0.563 | –26.3 | Q | 1 | |
| 17 | 29 | 35.53 | 52 | 30 | 47.5 | 3.0 | 0.029 | 16.2 | 15.96 | 0.02 | 0.278 | –25.0 | Q | 1 | |
| 17 | 49 | 12.30 | 55 | 12 | 8.9 | 28.7 | 0.023 | 16.3 | 16.58 | 0.44 | WD | 1 | |||
| 22 | 37 | 31.84 | 10 | 19 | 4.0 | 3.8 | 0.024 | 16.5 | 16.77 | –0.46 | 0.103 | –22.5 | S1 | 1 | |
| 22 | 37 | 33.28 | 10 | 18 | 42.7 | 26.3 | 0.024 | 15.9 | 16.10 | 0.50 | * | 1 | |||
| 23 | 7 | 13.30 | 4 | 32 | 2.5 | 29.8 | 0.079 | 15.9 | 17.25 | –0.92 | * | 1 | |||
| 23 | 15 | 52.73 | 11 | 33 | 2.1 | 21.4 | 0.036 | 16.5 | 17.20 | 0.24 | 0.567 | –26.2 | Q | 1 | KUV 23134+1117 |
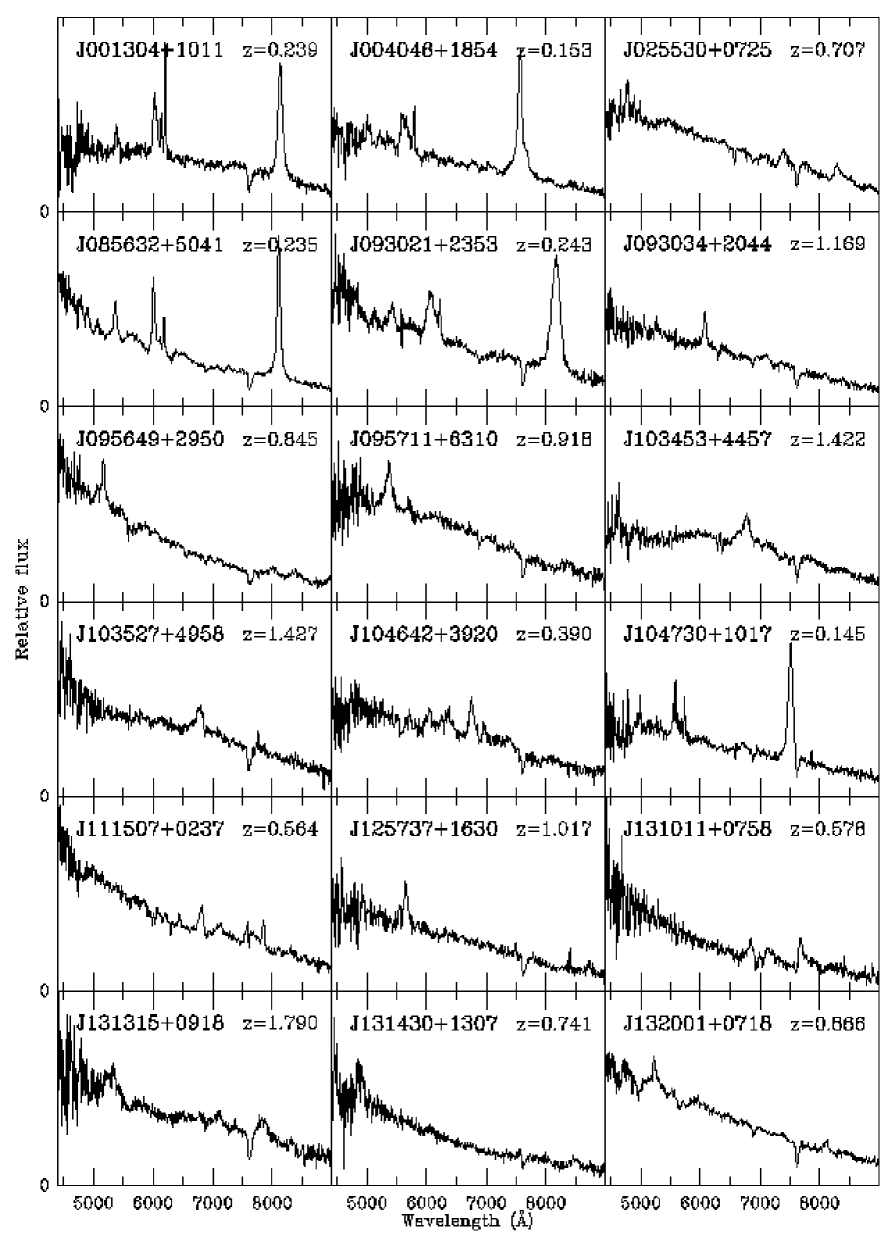
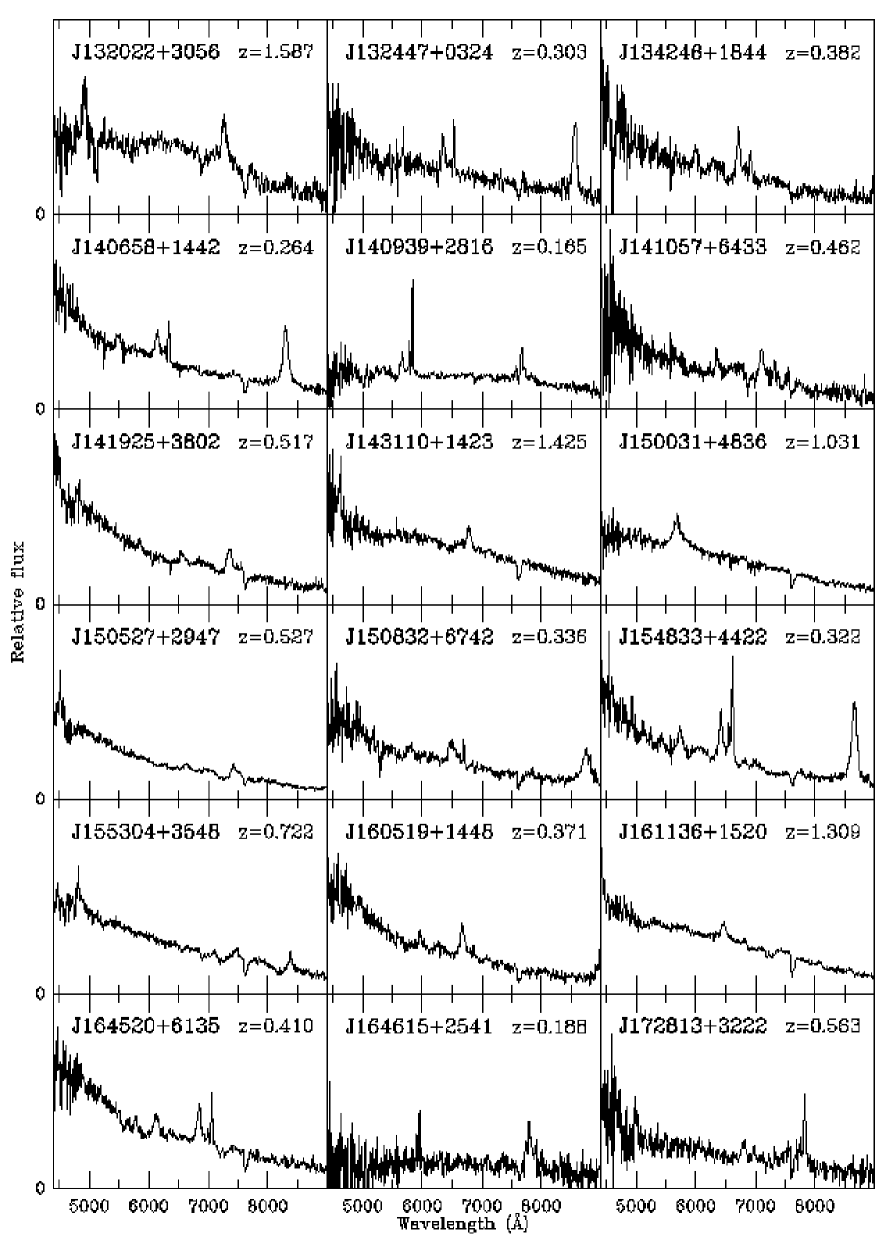
Out of the 2 652 starlike objects, zone IV contains 476 coincidences within 35 and 136 (x=0.28) within 15 of an X-ray source, implying that y=0.32; therefore 153 of these coincidences are likely to be genuine associations, 76 being located within 15. They could be blue stars (WD, CV, sd), or more probably QSOs. We have divided zone IV in two subregions (see the dotted line on Fig. 8). In the upper region (IVb), only 23% of the coincidences are within 15 and therefore a small fraction of the 332 coincidences are genuine. In the lower region (IVa) containing the bluest objects, 41% of the coincidences are located within 15 from the X-ray source, suggesting that 70% of the 144 objects located in this zone are real identifications. Among them are 41 known QSOs. The 103 other candidates, of which seven are known stars, are listed in Table 4. We have spectroscopically observed 91 of them. The observations were carried out during three observing runs (May and August 2002 and May 2003) with the 2.1-m telescope of the Guillermo Haro Astrophysical Observatory (OAGH) located in Cananea (Sonora, Mexico), operated by INAOE, and one run (September 2003) with the OHP 1.93-m telescope and the same instrument setting as for the observations of the galaxies (see section 3). The 2.1-m telescope was equipped with the LFOSC focal reducer (Zickgraf et al. zickgraf97 (1997)). The slit mask and the lower dispersion grism were used, giving a wavelength coverage from 4200 Å to 9000 Å and a dispersion of 8.2 Å pix-1. We found 49 stars (including a CV the spectrum of which is shown in Fig. 11), 38 QSOs, 1 Seyfert 1, two NLS1s, one BL Lac object (their spectra are displayed in Figs. 12, 13 and 14). Five candidates have not yet been observed.
Altogether, there are, in region IVa, 83 confirmed AGN in a total of 139 spectroscopically observed starlike objects (60%).


But only 60% (41/68) of all previously known AGN with APS colour fall in zone IVa showing the limits of the efficiency of the procedure we have adopted. The others are located in zone IVb, or not far from it, in a region where chance coincidences between stars and X-ray sources become non negligible. Here the Hamburg slitless spectra may turn out to be most useful in separating AGN from stars.
5 Discussion
5.1 Identification procedure
We have seen that the galaxies found within 35 of a ROSAT source have a high probability of being genuine identifications (80%) and therefore we included all of them in our spectroscopic program.
In the case of starlike objects, the situation is more complex due to the facts that a large fraction of the X-ray sources are in fact X-ray stars and that, the surface density of stars being relatively large, there is a non negligible number of chance coincidences. The use of the O–E vs. O diagram turns out to be quite efficient to eliminate bright stars and late type stars. However, although in our region IVa most objects are genuine identifications, in zones IVb and III there are many chance coincidences with main sequence stars. The use of the Hamburg slitless spectra in these zones is crucial to separate QSOs from stars. In addition, Seyfert 1 galaxies are often compact and classified as starlike in the APS. Moreover they usually have a relatively red O–E colour; as a consequence they easily escape detection by our automatic procedure and classification on the basis of the slitless spectra is necessary.
The relatively poor positional accuracy of the ROSAT survey (15) makes it difficult to identify objects weaker than 16.5; but this limiting magnitude is well fitted by the magnitude limit below which no recognition of absorption features is possible in the Hamburg slitless spectra.
5.2 Completeness of our QSO sample
We have seen that only 85% of the bright USNO objects have a counterpart in the APS
due mainly to the incompleteness of the data base. Moreover only 60% of the known
QSOs fall into our zone IVa to which we have restricted our search. Therefore our
sample is expected to be no more than 50% complete.
On the other hand, as our aim is to find all AGN brighter than a given optical
magnitude, we have to answer the following question: how many such AGN are missed
if we identify all bright AGN in a flux limited X-ray survey?
| Radio quiet | Radio loud | ||||||
|---|---|---|---|---|---|---|---|
| Omin | Omax | n | nX | % | n | nX | % |
| 15.5 | 80 | 58 | 72 | 9 | 7 | 78 | |
| 15.5 | 16.0 | 90 | 48 | 53 | 21 | 17 | 81 |
| 16.0 | 16.5 | 243 | 101 | 42 | 49 | 37 | 76 |
| 16.5 | 17.0 | 433 | 144 | 33 | 99 | 60 | 61 |
| 17.0 | 17.5 | 679 | 101 | 15 | 172 | 77 | 45 |
| 17.5 | 18.0 | 900 | 60 | 7 | 201 | 59 | 29 |
| 18.0 | 18.5 | 977 | 23 | 2 | 169 | 41 | 24 |
| 18.5 | 19.0 | 1040 | 13 | 1 | 107 | 11 | 10 |
| 19.0 | 19.5 | 475 | 4 | 1 | 41 | 5 | 12 |
| 19.5 | 20.0 | 87 | 0 | 0 | 18 | 5 | 28 |
The current version of the Véron & Véron QSO catalogue contains 5 893 QSOs at 0∘, b30∘, with B20.0 and z0.10, found in the course of radio or optical surveys (QSOs found as the identification of a X-ray source have been ignored). Of these, 871 are located within 35 from a ROSAT-BSC or -FSC source (stronger than 0.02 count s-1). We consider them as genuine identifications; 319 are radio loud and 552 radio quiet.

On average, QSOs with higher optical luminosity have higher X-ray luminosity. According to Maccacaro et al. (maccacaro88 (1988)), log(FX/FV)=log(FX)+0.4V+5.37 where FX is the X-ray flux in the 0.3-3.5 keV band in erg cm-2 s-1 and FV=–0.4V–8.42 is the flux in the V band in the same units. For the ROSAT survey, this translates into: log(FX/FV)=log(PSPC counts s10-11)+0.4V+5.37 where FX is the X-ray flux in the 0.1-2.4 keV band, assuming a conversion factor of 1 PSPC count s-1 for a flux of 10-11 erg cm-2 s-1 in this band which corresponds to an unabsorbed source with a photon index =2.3, a typical value for QSOs (Voges et al. voges99 (1999)).
Fig. 15 shows log(FX/FV) OUSNO for the 552 radio quiet QSOs. Table 5 gives the fraction of ROSAT detected QSOs their optical magnitude for both the radio quiet and the radio loud samples.
At OUSNO=16.0, about half of the optically selected QSOs are not detected in X-ray (Table 5) and therefore have log(FX/FV)–1 . Consequently the median value of their X-ray to optical flux ratio is –1.0. Figure 15 suggests that 0.5.
Zickgraf et al. (zickgraf03 (2003)) found that the median value of log(FX/FV) for X-ray selected QSOs is 0.39. The fact that these objects are significantly stronger X-ray sources than optically selected QSOs is due to the much higher frequency of the survey. Indeed Williams & Bridle (williams67 (1967)) and Kellermann et al. (kellermann68 (1968)) have shown that the relative numbers of sources with given spectral indices depend on the frequency at which the sample is selected. A sample selected at a low frequency (optical) will include a greater proportion of sources with high values of the spectral index than will a similar sample selected at a high frequency (X-ray).
In the simple case where the distribution of the spectral indices in a complete sample of sources selected at a wavelength o is Gaussian with a mean spectral index o and a standard deviation α, the distribution of the spectral indices of sources selected at another wavelength X will also be Gaussian with the same standard deviation α, but with a mean spectral index X given by:
X=o+ ln(X/o).
In this expression is the exponent in the population law
N(S)S-μ giving the number of sources with flux densities in excess
of a specified value S (Williams & Bridle williams67 (1967)). With =1.87,
o=5 000 Å and X=12.4 Å (1 keV), we find
that to get the observed increased value of FX/FV by a factor 25,
corresponding to X–o=0.54, a value of
α=0.22 is required, i.e. =0.57, where
=2.60 is the standard deviation of
log(FX/FV). This is in reasonable agreement with our estimated value
of 0.5.
Table 5 confirms that radio loud QSOs are brighter X-ray sources than radio quiet QSOs. In addition we found that, for BL Lac objects, the mean FX/FV ratio is larger than that of the radio loud QSOs as previously shown by Stocke et al. (stocke85 (1985)). BL Lac brighter than 15.5 are all detected by ROSAT while at OAPS=20.0, 50% are still detected.
5.3 The surface density of bright QSOs
The surface density of bright QSOs is difficult to determine because these objects are rare and therefore large areas of the sky have to be surveyed to find a substantial number. The Bright QSO Survey (BQS) of Schmidt & Green (schmidt83 (1983)) covering 10 714 deg2, contains 69 QSOs brighter than MB=–24.0 and B=16.16, corresponding to 0.00640.0008 deg-2. A number of works suggest that this value is substantially underestimated and that the completeness of the BQS is in the range 30%-70% (Wampler & Ponz wampler85 (1985); Goldschmidt et al. goldschmidt92 (1992); La Franca & Cristiani franca97 (1997); Wisotzki et al. wisotzki00 (2000); Mickaelian et al. mickaelian01 (2001)).
Grazian et al. (grazian02 (2002)) have undertaken a program similar to ours.
They cross-correlated the ROSAT-BSC with the Digitized Sky Survey in the southern
hemisphere to find all coincidences between X-ray sources and stellar objects brighter
than BJ15.13. After spectroscopic observations of the candidates,
they obtained a sample of 111 AGN in an area of 5 660 deg2, 57 being
brighter than MB=–24.0. But the distribution of absolute magnitudes
is rather odd, 46 being greater than –25.0 and 5 smaller than –26.0.
We checked the appearance of some of the low redshift objects on the DSS images;
they are clearly galaxies; their O magnitude in the APS data base is much greater
than the B magnitude given by Grazian et al. and the absolute magnitudes computed
with these O magnitudes are definitely greater than –24.0. The true number of QSOs
in this sample is therefore unknown, but certainly significantly smaller than 57.
There are, in our region of interest (10 313 deg2), 503 known QSOs (MB–24.0 MO–24.4) brighter than OUSNO=16.5, B=16.9 (on the average, the OUSNO magnitudes are brighter than the photoelectric B magnitudes: OUSNO–B=–0.38; Mickaelian et al. mickaelian01 (2001)). 191 are associated with a BSC source, 84 with a FSC source and 228 are not detected by ROSAT. Here we use USNO rather than APS O magnitudes because the selection has been made with the USNO data base; using the APS magnitudes, our sample would not be complete to O=16.5.
These 503 QSOs correspond to a surface density of 0.0410.002 QSO deg-2 brighter than B=16.9. If the integrated number-magnitude relation has a slope equal to b=/2.5=0.75 (Sandage & Luyten sandage69 (1969)), the surface density of QSOs brighter than B=16.16 is 0.0114 deg-2. Of these QSOs 142 are brighter than OUSNO=15.8 (B=16.2), corresponding to 0.0140.001 deg-2, in agreement with the preceding value, confirming that the value of b used is reasonable.
The QSO counts are systematically affected by the photometric errors on the magnitudes as these errors scatter many more objects toward bright magnitudes than it does toward faint magnitudes. Assuming that the error distribution is Gaussian, with a dispersion , the correction to be applied to the observed counts is a factor 10 (Eddington eddington40 (1940)). With b=0.75 and =0.31, the true QSO surface density is smaller by 1.21 than the observed one or, at B=16.16, 0.0110.002 deg-2. This is already 78% larger than the original Schmidt & Green estimate.
Sixty seven of the known QSOs (MO–24.4) with available APS magnitudes are associated with a ROSAT-FSC source, 35 being located in zone IVa (Table 3). In this zone, we have found 33 additional such objects (see Table 4), almost doubling the number of known QSOs at this limiting magnitude.
We should note in addition that, among the 84 EBL-WK objects, 14 have not yet been spectroscopically observed, while 5 of the QSOs candidates in Table 4 have still to be observed. This may increases the number of new bright QSOs.
6 Conclusion
We have undertaken a program of systematic identification of optically bright AGN in both the BSC- and FSC-ROSAT catalogues. In this paper we present preliminary results concerning the FSC catalogue. We describe the method used which consists of first cross-correlating the USNO and APS databases with the X-ray catalogue, then checking the nature of the candidates by looking at the slitless Hamburg spectra.
Among the starlike objects brighter than B=16.9 we have recovered 35 previously known QSOs in the region of the O/(O–E) diagram containing of the bluest QSOs and discovered 33 new ones confirming that, even at these relatively bright magnitudes, available surveys are significantly incomplete.
The total number of previously known QSOs brighter than B=16.2 corresponds to a surface density 78% higher than the original Schmidt & Green value. But we have shown that, in the subsample studied here the QSOs associated with a ROSAT-FSC source, the completeness is at best 50%. Although we cannot generalize this to the whole sample, it is not unlikely that the true surface density is significantly higher than the number derived here.
We found that at this magnitude and at a flux limit of 0.02 counts s-1, only 40% of all QSOs are detected by ROSAT.
7 Acknowledgments
RM and VCh acknowledge CONACyT research grants J32178-E and 39560-F. This work is partly based on observations obtained with 2.6-m telescope at the Byurakan Astrophysical Observatory, Armenia, the 1.93-m telescope at the Observatoire de Haute Provence (CNRS), France and the 2.1-m at the Guillermo Haro Astrophysical Observatory, Cananea, Mexico. The authors acknowledge the hospitality of INAOE during the Guillermo Haro Workshop 2003, at which time the scientific conclusions presented here were discussed. They are grateful to Dr. J. Cabanela for his help with the use of the APS databases which are supported by the National Science Foundation, the National Aeronautics and Space Administration, and the University of Minnesota, and are available at http://aps.umn.edu/. The Digitized Sky Survey was produced at the Space Telescope Science Institute (STScI) under U.S. Government grant NAG W-2166.
References
- (1) Bade N., Engels D., Voges W. et al. 1998, A&AS 127,145
- (2) Cabanela J.E., Humphreys R.M., Aldering G. et al. 2003, PASP 115,837
- (3) Comastri A., Brusa M., Mignoli M. & Hellas team 2003, AN 324,28
- (4) Condon J.J., Yin Q.F., Thuan T.X. & Boller T. 1998, AJ 116,2682
- (5) Eddington A.S. 1940, MNRAS 100,354
- (6) Goldschmidt P., Miller L., La Franca F. et al. 1992, MNRAS 256,65P
- (7) Grazian A., Omizzolo A., Corbally C. et al. 2002, AJ 124,2955
- (8) Hagen H.-J., Groote D., Engels D. & Reimers D. 1995, A&AS 111,195
- (9) Hornschemeier A.E., Brandt W.N., Garmire G.P. et al. 2001, ApJ 554,742
- (10) Hornschemeier A.E., Bauer F.E., Alexander D.M. et al. 2003, AJ 126,575
- (11) Kellermann K.I., Pauliny-Toth I.I.K. & Davis M.M. 1968,Astrophysical letters 2,105
- (12) Klemola A.R., Jones B.F. & Hanson R.B. 1987, AJ 94,501
- (13) La Franca F. & Cristiani S. 1997, AJ 113,1517
- (14) Laor A., Fiore F.,Elvis M., Wilkes B.J. & McDonnel J.C. 1997, ApJ 477,93
- (15) Lasker B.M., Doggett J., McLean B. et al. 1996, ASP Conf. Ser. 101,88
- (16) Lemaître G., Kohler D., Lacroix D., Meunier J.-P. & Vin A. 1989, A&A 228,546
- (17) Maccacaro T., Gioia I.M., Wolter A., Zamorani G. & Stocke J.T. 1988, ApJ 326,680
- (18) Mickaelian A.M., Gonçalves A.C., Véron-Cetty M.-P., & Véron P. 1999, Astrophysics 42,5
- (19) Mickaelian A.M., Gonçalves A.C., Véron-Cetty M.-P. & Véron P. 2001, Astrophysics 44,21
- (20) Monet D., Bird A., Canzian B. et al. 1996, USNO-A2.0, U.S. Naval Observatory, Washington D.C.
- (21) Moran E.C., Halpern J.P., & Helfand D.J. 1996, ApJS 106,341
- (22) Odewahn S.C., Stockwell E.B., Pennington R.L. & Humphreys R.M. 1992, AJ 103,318
- (23) Röser S. & Bastian U. 1991, PPM star catalogue, Astronomisches Rechen-Institut Heidelberg
- (24) Sandage A. & Luyten W.J. 1969, ApJ 155,913
- (25) Schmidt M. & Green R.F. 1983, ApJ 269,352
- (26) Schwope A.D., Hasinger G., Lehmann I. et al. 2000, AN 321,1
- (27) Severgnini P., Caccianiga A., Braito V. et al. 2003, A&A 406,483
- (28) Stocke J.T., Liebert J., Schmidt G. et al. 1985, ApJ 298,619
- (29) Tananbaum H., Avni Y., Branduardi G. et al. 1979, ApJ 234,L9
- (30) Véron-Cetty M.-P. & Véron P. 2001, A&A 374,92
- (31) Voges W., Aschenbach W., Boller T. et al. 1999, A&A 349,389
- (32) Voges W., Aschenbach W., Boller T. et al. 2000, IAU Circ. 7432
- (33) Wampler E.J. & Ponz D. 1985, ApJ 298,448
- (34) Williams P.J.S. & Bridle A.H. 1967, The Observatory 87,280
- (35) Wisotzki L., Christlieb N., Bade N. et al. 2000, A&A 358,77
- (36) Zickgraf F.-J., Thiering I., Krautter J. et al. 1997, A&AS 123,103
- (37) Zickgraf F.-J., Engels D., Hagen H.-J., Reimers D. & Voges W. 2003, A&A 406,535