Evolution and nucleosynthesis of primordial low mass stars
Abstract
We discuss in detail the evolutionary properties of low mass stars having metallicity lower than from the pre- main sequence up to (almost) the end of the Asymptotic Giant Branch phase. We also discuss the possibility that the large [C,N/Fe] observed on the surface of the most Iron poor star presently known, HE0107-5240, may be attributed to the autopollution induced by the penetration of the He convective shell into the H rich mantle during the He core flash of a low mass, very low metallicity star. On the basis of a quite detailed analysis, we conclude that the autopollution scenario cannot be responsible for the observed chemical composition of HE0107-5240.
1 Introduction
The idea that stars born shortly after the Big Bang are still alive has such a profound impact on the human emotionality that their evolutionary properties have been investigated in spite of the fact that their formation in an environment deprived of metals (Z=0) is at least not favored because of the lack of a strong coolant.
From a purely theoretical ground the fragmentation of primordial clouds is still largely debated and unclear, so that the current literature on the subject still ranges from papers in which essentially massive stars form (Abel, Bryan and Norman, 2000) to papers in which a significant production of low mass stars is possible (Nakamura and Umemura, 2002). However the continuous discovery of progressively more metal poor low mass stars constitutes a very good excuse to trust the primordial formation of low mass stars and hence to study their evolutionary properties.
The first computation of the Main Sequence (MS) properties of primordial (Z=0) low mass stars has been performed, as far as we know, by Castellani and Paolicchi (1975) while the first evolution up to the He core flash has been published by D’Antona (1982). In the latter paper all the key properties of the evolution of these stars were already clearly outlined. In particular, the presence of a Red Giant Branch (RGB) powered mainly by the PP chain rather than by the CNO cycle together to its natural consequences: a dimmer core mass- luminosity relation and a more external (in mass) ignition of the He burning (due to the slower advancing of the H shell). In the same paper it was also suggested the possibility of the ingestion of protons in the ”active” He (and C rich) convective shell and hence the possibility to produce stars showing very large surface CN abundances. In a following paper Guenther and Demarque (1983) tried to perform similar computations but the formation of a (fast growing) convective core towards the end of the central H burning phase forced them to stop the computations. Such a strong instability was not encountered in any further study. Fujimoto, Iben and Hollowell (1990) fully reanalyzed the evolution of a primordial from the MS up the He flash and described in detail the evolution of this star in comparison with stars of the same mass but having a larger metallicity, i.e. and . Since we will not tempt to rediscover once again the ”funny” properties of low mass zero metallicity stars, we refer the reader interested in a deep knowledge of the properties of these stars to that paper. One of the main results found by Fujimoto, Iben and Hollowell (1990) was that the outer border of the He convective shell, that forms at the He core flash, penetrates, unambiguously, the H-rich mantle. Such a result was discussed and interpreted as due to the combined effects of the unusually external location of the He ignition and to the low entropy barrier existing at the He-H interface as well. The properties that follow the ingestion of the protons in the He convective shell were firstly discussed by the same group in a following paper (Hollowell, Iben and Fujimoto, 1990). In particular they showed that the convective shell splits in two (at the mass location where the local burning timescale becomes comparable with the mixing timescale), the He convective shell dumps out, the H convective shell eventually merges with the convective envelope an hence that the envelope of the star becomes strongly enriched in the products of both the H and He burnings. In a third paper, Fujimoto, Ikeda and Iben (2000) recomputed several models of low mass zero (and non zero) metallicity and mainly confirmed their previous findings. By the way, tabulations of evolutionary tracks of extremely metal poor stellar models have been published in those years by Cassisi and Castellani (1993) and Cassisi, Castellani and Tornambe’ (1996): the He core flash properties of zero metallicity stars were not addressed at all in those papers. Weiss et al. (2000) recomputed a few low mass zero metallicity models and concluded very firmly that there isn’t any evidence of mixing between the He convective shell that develops at the He core flash and the H rich envelope. In the following year the same group (Schlattl et al., 2001) found the mixing between the He convective shell and the H-rich mantle at the He core flash of a (Y=0.23,Z=0); they also studied the dependence of the occurrence of the mixing on several parameter (equation of state, initial He abundance, initial mass, diffusion efficiency, external pollution and opacity). Their main result was that the occurrence of this mixing is very robust with respect to all the changings but for the dependence on the initial He abundance (an increase of from 0.23 to 0.24 inhibits the mixing) and on the possible pollution of the envelope (that also inhibits the mixing). For the smaller masses () they always found the mixing to occur! In a further paper (Schlattl et al., 2002), they extended the tests to the dependence on the metallicity and found that the mixing occurs up to a metallicity of for masses of the order of . However, other similarly recent computations by Marigo et al. (2001) and Siess, Livio and Lattanzio (2002) did not find any mixing between the He convective shell and the H rich mantle at the onset of the He core flash.
In the last years we have continuously worked on the evolution of zero metallicity stars (Chieffi et al., 2001; Chieffi and Limongi, 2002; Limongi and Chieffi, 2002; Bonifacio, Limongi and Chieffi, 2003; Limongi, Chieffi and Bonifacio, 2003) in a wide mass range that goes from the low masses up to the more massive ones (). We have discussed over the years the properties of both the primordial AGB and core collapse supernovae. In this paper we present our low mass models of extremely low metallicity and discuss the fit to the most Iron poor star presently known, HE0107-5240 (Christlieb et al., 2002). The paper is organized as follows. In section 2 we briefly remind the current setup of the evolutionary code FRANEC (release 4.98); section 3 is devoted to the description of the properties of our ”reference” stellar model, i.e. a having Y=0.23 and Z=0. Additional test models are discussed in section 4 while the fit to HE0107-5240 is discussed in section 5.
2 Stellar evolution code and input physics
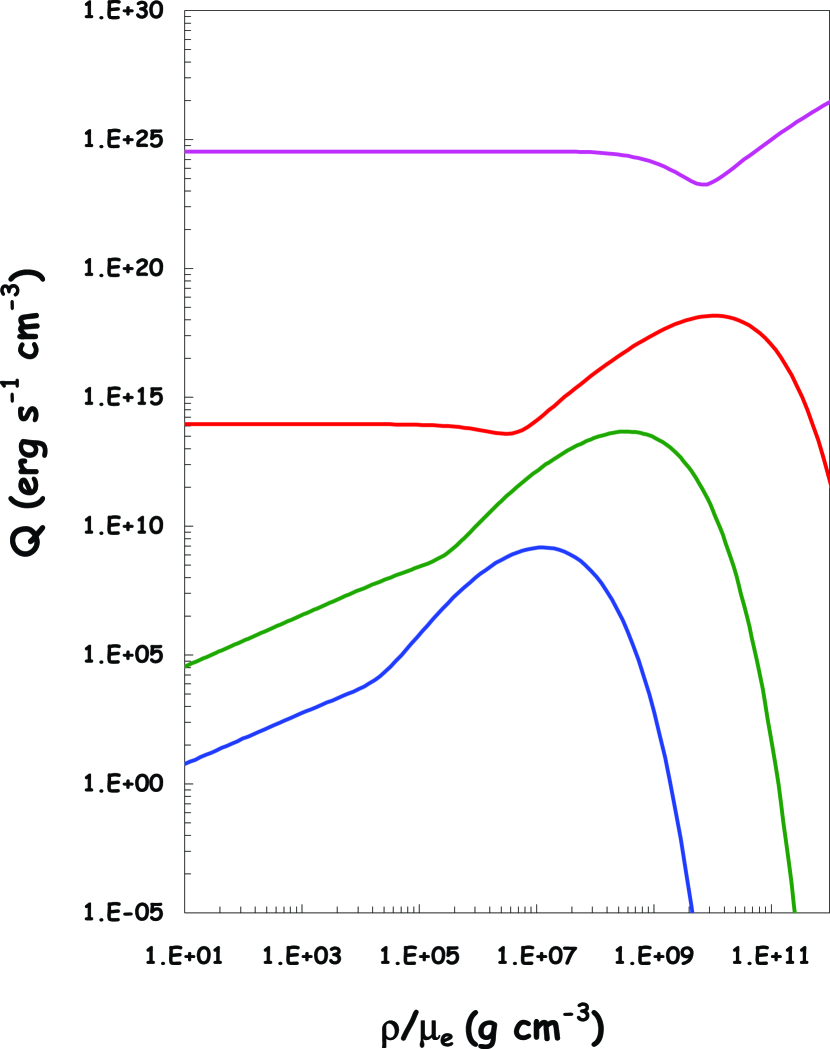
All the models presented in this paper have been computed by means of the FRANEC (Frascati RAphson Newton Evolutionary Code) which is now at the release 4.98. The main properties of this version of the code have been discussed in detail in Chieffi, Limongi and Straniero (1998) and will not be repeated here. One crucial updated has been included in the present setup of the code, i.e. an update expression for the total energy loss rate, , due to neutrino emission (Esposito et al., 2002, 2003). This quantity is plotted in Figure 1 versus for , , , . The new evaluation of takes into account the leading leptonic processes: pair annihilation, -photoproduction, plasmon decay, bremsstrahlung on nuclei up to the first order in radiative corrections (see (Esposito et al., 2002, 2003) for details).
The network we have used in the present computations includes 44 nuclear species (from P to ) interacting through 268 nuclear processes. The same network has been used for both the H and He burning phases.
3 The Evolution of the
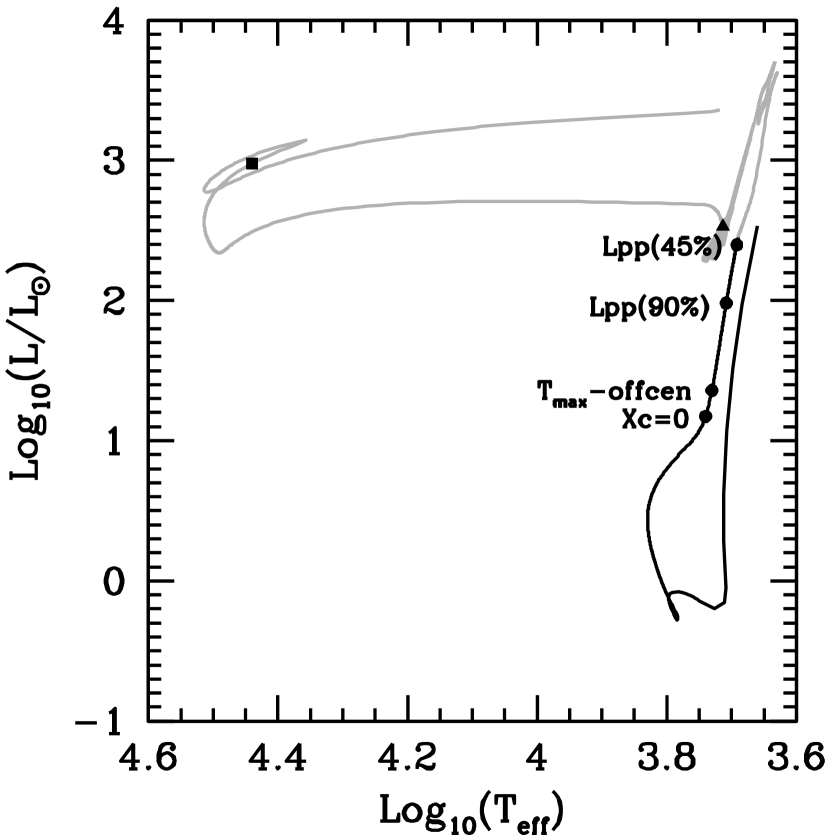
The typical mass we are interested in is the because it roughly corresponds to the mass born soon after the Big Bang and evolving now off the Main Sequence. Its evolutionary properties up to the end of the central He burning phase may be divided in six parts: Main Sequence, first climbing along the RGB, first He core flash, second RGB, second He core flash and central He burning. Let us discuss the various phases in sequence. The full path followed by this star in the HR diagram is shown in Figure 2.
3.1 From the MS to the He core flash
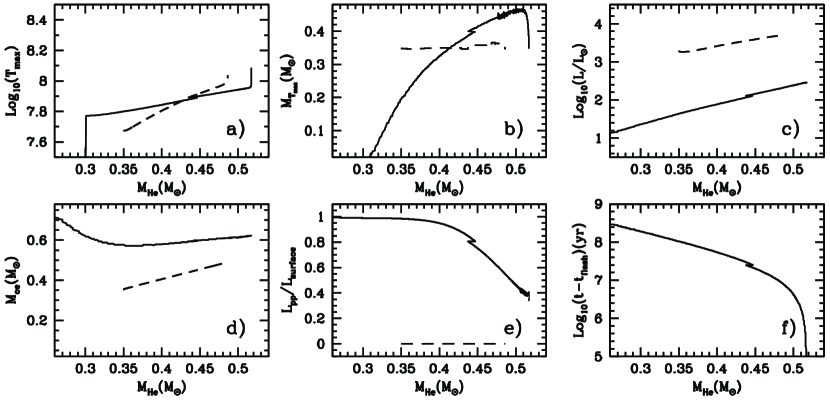
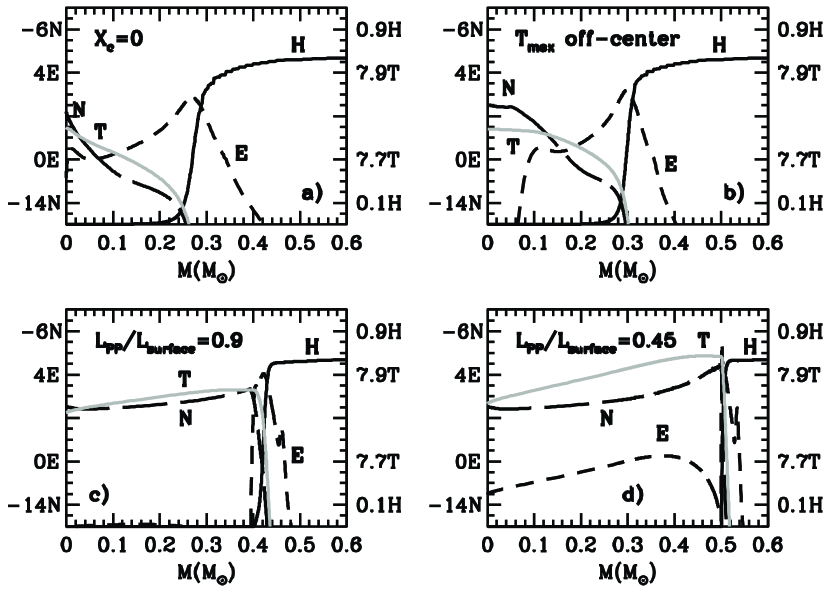
The key evolutionary properties of this star are shown in Figures 3 and 4. The various panels in Figure 3 show, as solid lines, the runs of the maximum temperature (a), its mass location (b), the surface luminosity (c), the mass of the convective envelope (d), the fraction of luminosity produced by the PP chain (e) and eventually the time spent above a given luminosity (f) as a function of the He core mass (). For sake of clearness let us remind that has been defined as the mass location corresponding to the maximum nuclear energy production by the H burning. Figure 4 shows, in the four panels, snapshots of the internal structure at various key points: the central H exhaustion (a), the model in which the maximum temperature firstly shifts off center (b) and the models where the drops to 90% (c) and 45% (d) of the surface luminosity. All the panels in Figure 3 show the signature of the low efficiency of the PP chain compared to that of the CNO cycle. The run of the maximum temperature with the He core mass (panel a) shows a very high zero point (i.e. the first maximum temperature at which it moves off center) because the PP chain needs much higher temperatures than the CNO cycle to compensate for the lower efficiency of the energy production and a very shallow slope because of the low H burning rate. Such a low burning rate shows up clearly in panel b) where the reduced accretion rate of fresh He on the He core mass slows down the heating of the core (which is due to the continuous growth of the He core mass) so that the energy losses due to the neutrino emissions push (unusually) outward the mass location of the maximum temperature (panel b). Accordingly, also the luminosity (that is proportional to the accretion rate) is unusually low (panel c). The overall higher temperature that is typical of the metal free stars forces also the base of the convective envelope (panel d) to remain much more external in mass than in ”standard” metal poor low mass stars. Panel e) shows that the PP chain provides almost 100% of the luminosity up to a He core mass of and that it progressively reduces down to roughly 40% at the onset of the He flash. This progressive reduction of is due to the continuous increase of the CNO catalysts (and associated ) produced by a partial activation of the processes. By the way, the small hook that appears at marks the moment when the maximum energy generation rate shifts from a layer dominated by the PP chain to a (more internal) one where the CNO cycle prevails. The last panel f) also reflects the slowness of the evolution along the RGB when the nuclear energy production is dominated by the PP chain. The four panels in Figure 4 show how the energy production and the CNO catalysts change during the evolution along the RGB. Panel a) shows the structure close to the moment of the central H exhaustion and, in particular, the H profile (solid line), the nuclear energy production (short dashed line), the Nitrogen abundance, which is largely the most abundant of the CNO nuclei when it is at its full equilibrium, (long dashed line) and eventually the temperature (gray line). Each quantity has its properly labeled scale on either the primary or secondary Y axis. Though most of the central H-burning phase is largely unaffected by the lack of CNO catalysts because these low mass stars are anyway mainly powered by the PP chain, the transition from the central to the shell H- burning is deeply influenced by the lack of CNO nuclei. Since the CNO cycle can not substitute the PP chain as main energy producer, the core of a metal free star at the central H exhaustion is much hotter than that of a ”standard” metal poor star and at the central H exhaustion the maximum nuclear energy production is already located at roughly from the center. The central C mass fraction produced by a partial activation of the processes (and fully converted in N) at the central H exhaustion is dex. The other three panels show the same quantities shown in panel a) at different times: it is evident how the thickness of the H burning shell decreases with time and that the global amount of CNO catalysts increases progressively up to dex by mass fraction at the He core flash. Before closing this section let us remind that the He flash starts at a mass location significantly more internal than that of the maximum temperature because the rate of the process depends also on the square of the density. For this reason when the He core flash starts, the maximum temperature quickly shifts where the rate of the process has its maximum (see panel b in Figure 3).
3.2 The ”hot” encounter between He and H
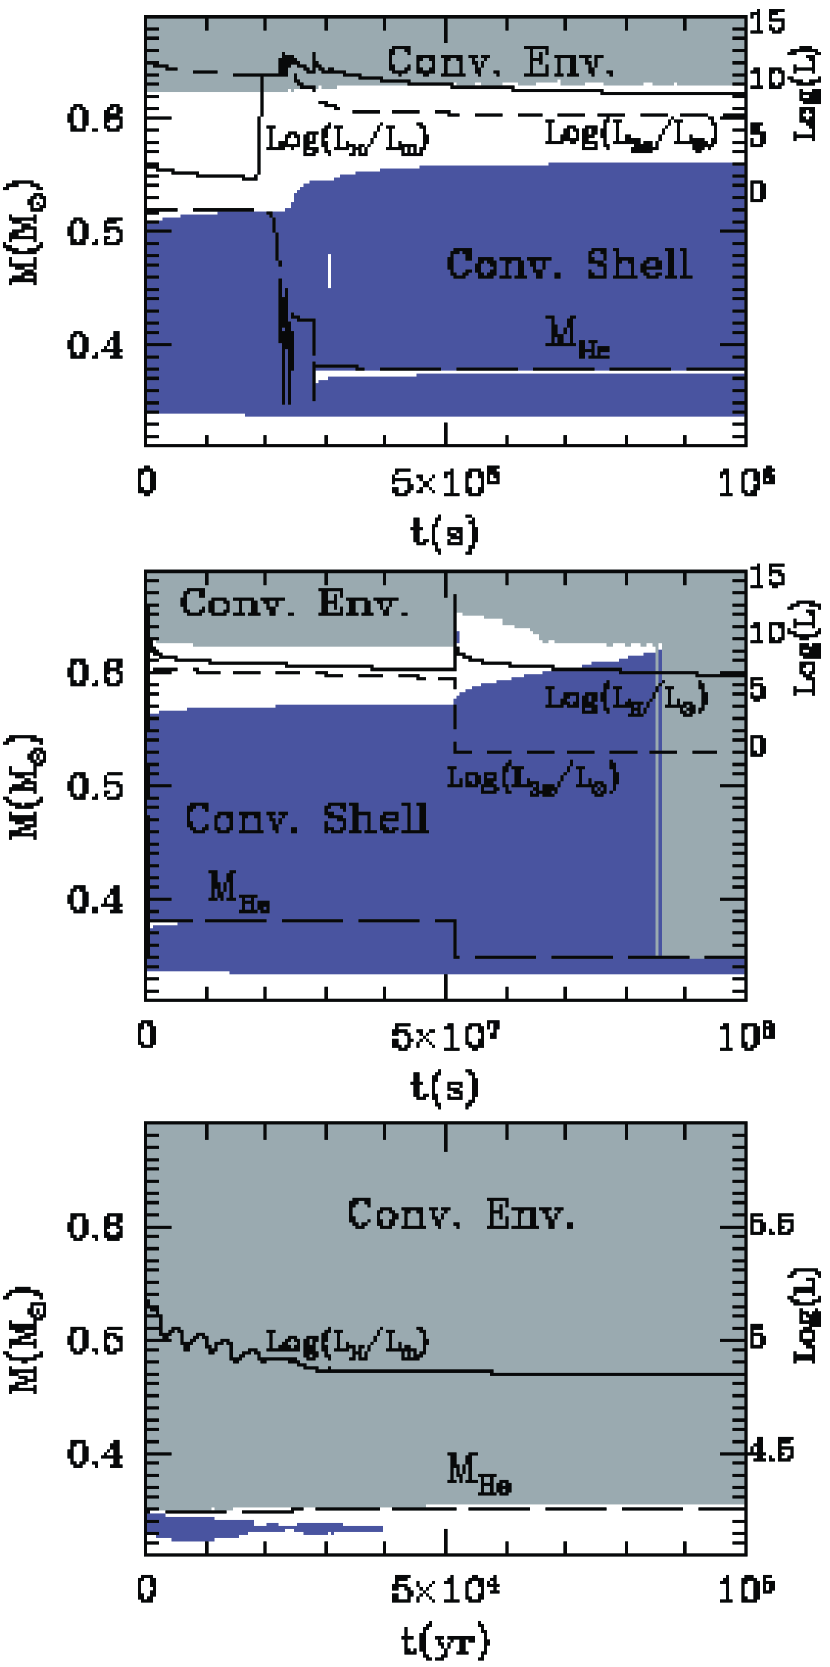
When the luminosity () raises above , a convective shell forms at a mass coordinate of . 723 yr after the formation of this convective shell, reaches its maximum and the convective shell extends up to . s after has reached its maximum, the still advancing He convective shell reaches the tail of the H rich mantle and begins to dredge down protons. At this stage the C mass fraction in the He convective shell is dex while the total amount of C produced by the He burning is . The following history of the mixing of protons in the He convective shell is clearly described by the three panels in Figure 5 where the solid and short dashed lines show the H and He luminosities, the long dashed line marks the location of the maximum H burning rate (the He core mass) while the light and dark gray zones show the convective envelope and the convective shells, respectively. The three panels show a zoom of the first s, s and yr after has reached its maximum. The protons ingested by the advancing He convective shell sink inward without interacting with the surrounding environment until they reach layers hot enough that their burning lifetime (against their capture by nuclei) becomes shorter than the crossover time. In our models such condition occurs at , where the local temperature is K, and roughly s after the beginning of the H ingestion. At this mass location an H-burst producing a local luminosity maximum and a (very mild) temperature inversion occurs: as a consequence the He convective shell splits in two, a more internal one powered by the slowly dimming and a second one powered by the H burning. This configuration lasts s; since the electrons are not strongly degenerate in the region where the H-burst occurs (), a rather quickly expansion quenches the energy production so that the two convective shells merge and the protons start flowing inward again. When they reach , the local temperature is and a new H-burst, followed by a splitting of the convective shell, occurs. This second splitting phase lasts s until the expansion and cooling induced by the H-burst itself allows once again the merging of the two convective shells. The further penetration of the H-rich matter is not halted any more down to the base of the He convective shell (). The He burning is now completely switched off and the star readjusts quickly on a typical ”standard” RGB configuration with one shell energy source. Roughly 1 yr after the protons have reached the region where the He flash started, the H-rich convective shell and the convective envelope merge and the product of the He-H burnings are fully mixed homogeneously up to the surface of the star (table 1, column 1, rows 1 to 17). The nuclei (other than He) that are brought to the surface are mainly C, N and O because the main result of the ingestion of protons is that of redistributing the produced by the He burning among the CNO nuclei via the CNO cycle. The global metallicity (i.e. the sum of all the nuclei with ) is now dex. By integrating over all the H-rich layers one obtains a global abundance of elements heavier than He equal to . It is worth noting that this value corresponds almost exactly to the amount of C produced by the He shell up to the moment when the He convective shell starts penetrating the H-rich mantle (as number of particles, obviously). In other words the total number of particles produced by the He flash up to the beginning of the H ingestion remains freezed up to the onset of the 2nd He core flash (see below). Another isotope that is largely produced is that reaches a surface abundance of , i.e. this star appears as an iper Li rich star. Such an enormous production of Li occurs in two successive steps: during the three H- bursts a large amount of is produced and distributed within the convective shell. Then, the expansion and cooling induced by the H-burst favors the production, and the final merging of the convective shell with the convective envelope redistribute the within the mantle of the star up to the surface. Summarizing, the ingestion of H- rich matter in the He convective shell deeply influences the further evolution of the star: the H-bursts triggered by the activation of the CNO cycle at very high temperatures induce an expansion of all the region down to the ignition point of the process and hence the He core flash fails. Moreover, the C produced by the He burning is reconverted in C, N and O via the CNO cycle and the . is also produced in huge amount. The failure of the He core flash summed to a large reduction of the He core mass pushes back the star towards a deja vu configuration in which an active H-burning shell located at the surface of the He core mass sustains the H rich mantle, i.e. an RGB configuration. The transition towards this kind of structure leads to the formation of a typical convective envelope extending from the surface of the star down to close the active H burning shell and hence triggers the merging of the H convective shell with the outer convective envelope.
3.3 The 2nd RGB and the 2nd He core flash
Roughly yr after the beginning of the first He core flash, the star completes its readjustment, settles once again on the RGB and starts climbing it again towards a second He core flash. Its structure is characterized by a helium core mass of and by a convective envelope whose chemical composition is largely enriched in He (see table 1, column 1), CNO and Li. It is worth recalling at this point that in the Sun , i.e. the initially metal free star has an envelope super metal rich in terms of . Such an occurrence obviously has a deep consequence on the behavior of the star along the second RGB. The dashed lines in Figure 3 refer to this phase. Since the H- burning shell now advances very quickly because of the combined effects of the very high and of the low H mass fraction, it follows that: the maximum temperature increases now very steeply with the He core mass so that the size of the He core mass at the He flash is just (panel a), the mass location of the maximum temperature remains at because of the very fast advancing of the H-burning shell (panel b), the surface luminosity (panel c) reflects the much larger H- burning rate, the base of the convective envelope closely approaches the H shell (panel d) and the contributes negligibly to the total energy production (panel e). It follows that the time spent by the star on this 2nd RGB phase is extremely short, of the order of 2 Myr. The second RGB extends up to (see Figure 2).
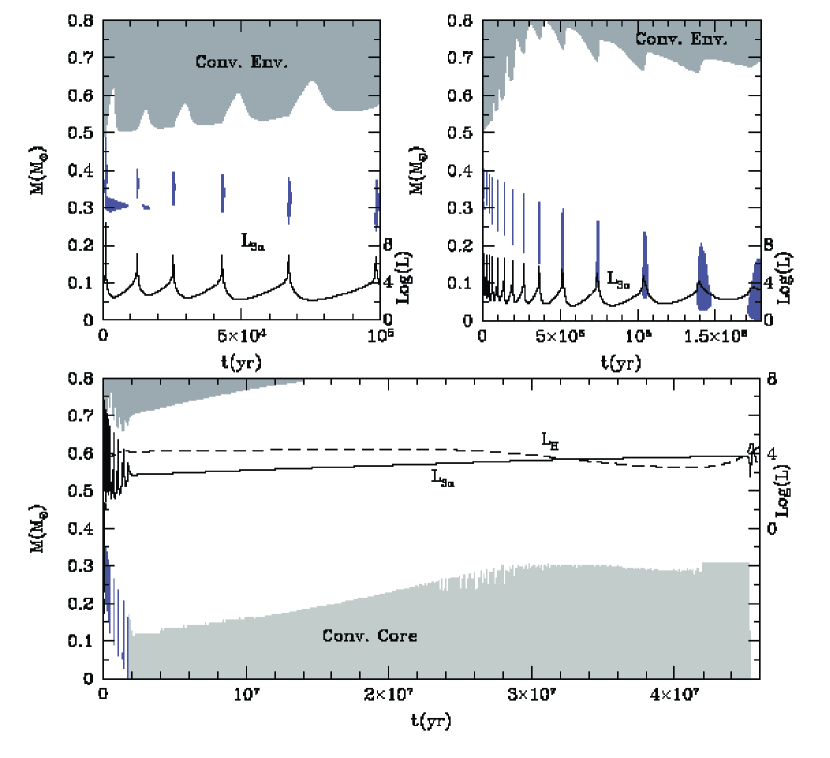
When reaches , the maximum temperature is high enough to trigger once again the process and a second He core flash starts. Though the ignition point is very similar to the one where the first He core flash occurred, this time the entropy barrier at the H-He interface is large enough to prevent the penetration of the outer border of the He convective shell in the H rich mantle. Also the energy released is much lower than in the first He core flash, the luminosity peak reaching , i.e. roughly 400 times weaker than in the previous flash. The He core flash develops as usual through a series of successive He burning ignitions (and associated convective shell episodes) that lift the electron degeneracy in regions progressively closer to the center. This star experiences a series of 15 flashes that are shown in Figure 6. During this phase the star rolls in the HR diagram towards lower luminosities and slightly larger effective temperatures. Once the electron degeneracy is fully removed in the He core, the star settles in the point marked by the filled triangle in Figure 2 and are passed from the beginning of the second He core flash.
3.4 The central He burning
As shown long time ago (Sweigart and Gross, 1976), the presence, or absence, of an extended blue loop on the Horizontal Branch (HB) phase is largely due to the amount of He in the envelope: for Y=0.4 dex a very extended blue loop occurs even for stars that start their HB evolution very close to their Hayashi track. Our stellar model has Y greater than 0.5 dex and this easily accounts for the extended blue loop visible in Figure 2. As for the percentage time spent by the star at the various effective temperatures, one third of the total central He burning lifetime is spent at the red and one third at the blue side of the HR diagram, the remaining third being spent crossing (on a nuclear timescale) the HR diagram from the red to blue. Another thing worth mentioning is that the C mass fraction in the He convective core at the beginning of the central He burning is 0.06 dex. The HB luminosity is apparently very high () and the HB lifetime is very short () for a star having an He core mass of . The reason for both these occurrences is, once again, the very high and the low H abundance in the envelope that force the H burning shell to be very efficient in piling up fresh He on the He core mass. By the time the star reaches (coming from the red) its He core mass has already grown up to and then it continues to increase up to at the central He exhaustion (marked by a filled square in Figure 2). All the key properties of the evolution of this star are reported in the first column of Table 1. After the mass, initial metallicity and He abundance, rows 4 to 17 refer to the surface abundances of the most abundant nuclei. The following rows show: the time spent on the first RGB above ; the He core mass, the mass location of the maximum temperature and the surface luminosity at the He core flash; the duration of the first He core flash; the He core mass, the mass location of the maximum temperature and the surface luminosity at the beginning of the second climbing on the RGB; the lifetime of the 2nd RGB phase; the He core mass, the mass location of the maximum temperature and the surface luminosity at the 2nd He core flash; the He core mass at the beginning and the end of the central He burning phase; and eventually the central He burning lifetime.
4 Additional models
We have shown in the previous sections that the He core flash of a of primordial chemical composition (Y=0.23 and Z=0) is characterized by the penetration of the He convective shell in the H rich mantle. Such a phenomenon has very interesting consequences, the most important one being the dredge up of large amounts of C, N, O and Li to the surface. If this peculiar phenomenon were confined to just this mass and to this specific chemical composition, its interest would be largely academical. If, vice versa, it would occur for a reasonably wide range of values of the three parameters (M, Y and Z), its reality would be strengthened and the probability of its occurrence in real stars would increase significantly. Hence, in order to assess the robustness of this phenomenon, we have computed a few further models, i.e. three models in which we have progressively increased the initial metallicity (), a further one computed with a higher initial He abundance (Y=0.27) and other two models with a higher mass (1 and ).
As for the metallicity, we found that up to Z= the evolutionary properties of the closely follow those found for the metal free case (columns 2 and 3 in Table 1), so that also for these metallicities the He convective shell penetrates the H rich mantle. The final surface chemical composition after the dredge up is quite similar, the global mildly increasing from (Z=0) to (). In all three cases the is very low (3-4) while the C/N ratio increases from 1.3 (Z=0) to 5.3 () mainly because of the increase of the Carbon abundance. The Oxygen abundance remains quite constant over this metallicity range and the surface abundance remains very high up to . The run with did not show any mixing at the He core flash between the He convective shell and the H rich envelope and hence we followed this evolution just up to the end of the first major He flash.
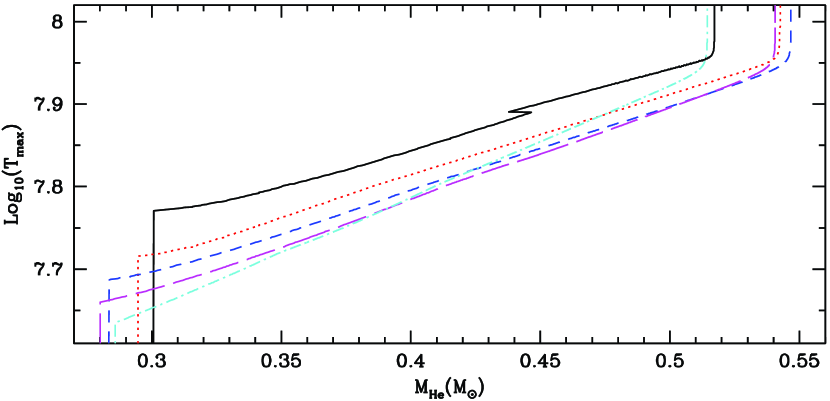
A feature of these extremely metal poor stellar models is that the He core mass at the He flash increases steadily with the metallicity up to and only above this value it start decreasing as the metallicity increases (which is the well known trend for the low mass stars at metallicities larger than ). The explanation for such an occurrence can be easily understood by looking at Figure 7 that shows the trend of the maximum (off-center) temperature with the He core mass. The size of the He core mass at the He flash is determined (in general) by both the slope and the zero point of the (almost linear) relation. The zero point (which in practice may be identified as the temperature at which it starts moving off center) scales inversely with the metallicity (actually ) because the larger the the earlier the CNO cycle starts dominating the nuclear energy production and hence the cooler will be the interior of the star while it exits the Main Sequence to enter the RGB phase. The slope of that relation, on the contrary, steepens increasing the metallicity () because the larger the metallicity the faster the H burning shell advances and hence the faster will be the growth of the He core and its heating. Figure 7 shows clearly that an increase of the metallicity from 0 (solid line) to (dotted line) and to (short dashed line) lowers progressively the temperature at which it starts moving off-center (the zero point) while it does not alter at all the slopes of the three run. In other words the H burning shell is dominated by the PP chain up to a metallicity of the order of . This means that between Z=0 and the final He core mass is mainly determined by the ”hotness” of the star when it leaves the Main Sequence: the cooler the initial off center temperature the larger the amount of mass that must be accreted in order to ignite the . As the metallicity increases to higher metallicities, (long dashed line) and (dot dashed line), the H burning shell begins to be dominated by the CNO cycle that speeds up the RGB evolution (steepens the slope) and leads, in turn, to smaller He core masses.
The influence of the initial He abundance on the He-H mixing at the He core flash has been studied by computing a having Z=0 and Y=0.27. Also in this case we found an extended mixing followed by the dredge up to the surface of the product of the He-H burnings. The surface chemical composition after the dredge up is shown in the 4th column of Table 1. The influence of the initial mass has been studied by computing two stellar models of masses and (Y=0.23 and Z=0). Also the experiences a strong mixing between the He convective shell and the H rich mantle (the resulting surface chemical composition is shown in the 5th column of Table 1) while the ignites the He quiescently without any He core flash. To stress simultaneously the effect of the mass and the initial He abundance we have also computed the evolution of a with Y=0.27 and Z=0. Also in this case we found an extended penetration of the He convective shell in the H rich mantle (this evolution was stopped as soon as the He convective shell was definitely penetrated in the H rich envelope). All these tests show that a) the He- H mixing at the He core flash is a phenomenon that occurs over a reasonably large range of metallicities, initial He abundances and masses and b) within the range of parameters addressed in this paper, the final surface is only mildly dependent on the initial mass, metallicity and He abundance.
Before closing this section let us briefly comment on the comparison between our results and others available in the literature. In particular we want to stress here that, in spite of the quantitative differences that come out when closely comparing the models computed by different groups, a few key features seem to be quite well established (fortunately). First of all the sequence of events that leads to the surface pollution: firstly, the penetration of the outer border of the He convective shell in the H rich mantle, then, the splitting of the He convective shell in two at the mass location where the H-burst occurs and, eventually, the merging of the H-convective shell with the convective envelope. What it is still more interesting is that the amount of C and N brought to the surface is always of the same order of magnitude (a few times dex) as well as the C/N ratio that it is always roughly of the order of one (with a maximum excursion of a factor of two). Also the limiting metallicity Z (actually one should mention ) that allows the He convective shell to penetrate the H rich mantle is quite similar to the one quoted by Schlattl et al. (2002), i.e. (that corresponds to a scaled solar ).
5 The HE0107-5240 case
A large C and N overabundances relative to Iron is a quite common occurrence among the extremely iron poor stars, e.g. Beers (1999), and hence it is quite tantalizing to associate such overabundances with the ”hot” He-H mixing that occurs exactly (and only) at the extremely low Iron abundances. Two stars have been analyzed in detail up to now (Schlattl et al., 2001, 2002): the first one, CS22892-052, has , , , and , while the second one, CS22957-027, has , , , and . Though these two stars are indeed extremely Fe poor, their Fe abundance is large enough that even a scaled solar would bring them outside the range of values for which the hot He-H mixing occurs (in the present generation of models). A very possible O overabundance would even worsen the situation. To overcome such a difficulty, Schlattl et al. (2001, 2002) postulated that these stars were born by pristine material and that they accreted enriched material only later on, during their Main Sequence lifetime. However, even with this escamotage, the analysis showed that there is a total inconsistency between the observed and predicted surface abundances: in particular the predicted [C,N/Fe] are exceedingly larger than the observed values.
Quite recently it has been discovered (and quite accurately analyzed) the most iron poor star presently known: HE0107-5240 (Christlieb et al., 2002). Its iron abundance is 1/200000 of that in the Sun ([Fe/H]=-5.3), C, N and Na are enormously enhanced (by a factor of , and 10, respectively) relative to iron, Mg is almost scaled solar, and . Its extremely low iron abundance and its high [C/Fe] and [N/Fe] make this star the ideal candidate to check if these large surface overabundances may be due or not to the ”hot” mixing between He and H during the He core flash.
The initial metallicity Z of this star at the moment of its formation may be settled to if we assume (arbitrarily) a scaled solar distribution of all the elements (and in particular of the O) with respect to Fe. The key evolutionary features of a having this (scaled solar) metallicity are reported in column 3 of Table 1 and show that this star lies within the range of metallicities (actually ) for which the ”hot” He-H mixing occurs. Therefore it is not necessary to invoke for this star any, ad hoc, late accretion of polluted matter. In spite of this encouraging first result, a comparison between the available data for HE0107-5240 and the evolutionary properties of the stellar model having shows that the mixing of H-rich matter in the He convective shell during the He core flash cannot explain the observed in this star. There are many reasons for that, each of which would be sufficient by itself to exclude the autopollution scenario. Let us analyze each of them separately.
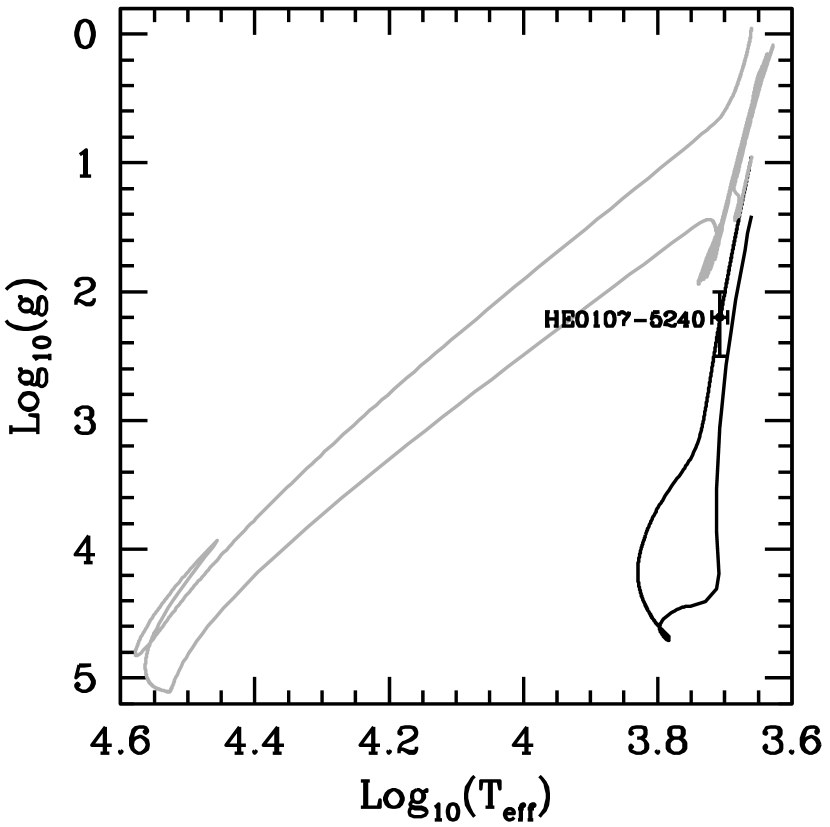
a) Figure 8 shows the path followed by the having a scaled solar metallicity in the plane as a solid line. The black portion of the path refers to the phases in which the surface chemical composition is still the pristine one, while the gray path shows the part of track where the star shows the large overabundances of the elements brought to the surface during the He core flash. The position of HE0107-5240 is marked by the black filled dot. It is strikingly evident that the position of HE0107-5240 is still on the middle of the first RGB, well below the He core flash (and well below the central He burning location). Note that , as discussed by Christlieb et al. (2002), is a firm upper limit to the gravity of HE0107-5240, occurence that reinforces such a finding.
b) Table 1 shows the time spent by the model on the first RGB (46 Myr above ), on the second RGB (1.4 Myr) and in the central He burning phase (41 Myr, 14 Myr of which spent at effective temperatures lower than 7000 K). On the basis of these lifetimes one should expect to see at least 30 metal free Red Giants for each Red Giant showing very large [C,N/Fe] ratios. None of them has been seen. One could think, on the other hand, that HE0107-5240 is in the central He burning phase, but also in this case we would expect roughly 3 metal free Red Giants for each auto polluted Red Giant. Once again none of them has been discovered so far.
c) The surface [C/Fe] and [N/Fe] predicted by the models are, respectively, 6.07 and 5.8, values that must be compared to the observed ones: =4 and =2.3. Also in this case the predicted values are exceedingly large with respect to the observed ones. Even if we forget about the Fe abundance and concentrate on the C/N ratio, we find that the models predict a ratio roughly 1 while the observed ratio is roughly 50.
d) The ratio predicted by the model is of the order of 3:4 while the lower limit for the observed value is of the order of 30.
e) The model predicts this star to be very Li rich, in particular [Li/Fe]=5.5, while a (very) upper limit has been set for this star to 5.3.
Actually there is not even one point in favor of the auto pollution scenario, so that we are forced to conclude that the surface chemical composition of HE0107-5240 cannot be explained by the auto pollution that occurs during the He core flash in the low mass extremely Iron poor stars. In our opinion the ”massive star” scenario presented by Bonifacio, Limongi and Chieffi (2003) and Limongi, Chieffi and Bonifacio (2003) still seems the most promising one to explain not only this star but the bulk of the extremely Iron poor stars: the ones showing strong Carbon and Nitrogen overabundances as well as those not showing overabundances of these elements.
References
- Abel, Bryan and Norman (2000) Abel, T., Bryan, G.L. and Norman, M.L. 2000, ApJ, 540, 39
- Beers (1999) Beers, T. C. 1999, in Connecting the Distant Universe with the Local Fossil Record, ed. M. Spite (Dordrecht: Kluwer Academic Publishers), Ap&SS, 265, 547
- Bonifacio, Limongi and Chieffi (2003) Bonifacio, P., Limongi, M. and Chieffi, A. 2003, Nature, 422, 834
- Cassisi and Castellani (1993) Cassisi, S. and Castellani, V. 1993, ApJS, 88, 509
- Cassisi, Castellani and Tornambe’ (1996) Cassisi, S., Castellani, V. and Tornambe’, A. 1996, ApJ, 459, 298
- Castellani and Paolicchi (1975) Castellani, V. and Paolicchi, 1975, Astrophys. Space Sci., 35, 185
- Chieffi et al. (2001) Chieffi, A., Dominguez, I., Limongi, M. and Straniero, O. 2001, ApJ, 554, 1159
- Chieffi and Limongi (2002) Chieffi, A. and Limongi, M. 2002, ApJ, 577, 281
- Chieffi, Limongi and Straniero (1998) Chieffi, A., Limongi, M. and Straniero, O. 1998, ApJ, 502, 737
- Christlieb et al. (2002) Christlieb, N., Bessel, M.S., Beers, T.C., Gustafsson, B., Korn, A., Barklem, P.S., Karlsson, T., Mizuno-Wiedner, M., and Rossi, S. 2002, Nature, 419, 904
- D’Antona (1982) D’Antona, F. 1982, A&A, 115, L1
- Esposito et al. (2002) Esposito, S., Mangano, G., Miele, G., Picardi, I. and O. Pisanti, 2002, Mod. Phys. Lett. A17, 491
- Esposito et al. (2003) Esposito, S., Mangano, G., Miele, G., Picardi, I. and O. Pisanti, 2003, Nucl. Phys. B658, 217
- Fujimoto, Iben and Hollowell (1990) Fujimoto, M.Y., Iben, I.Jr. and Hollowell D. 1990, ApJ, 349, 580
- Fujimoto, Ikeda and Iben (2000) Fujimoto, M.Y., Ikeda, Y. and Iben, I.Jr. 2000, ApJ, 529, L25
- Guenther and Demarque (1983) Guenther, D.B. and Demarque, P. 1983, A&A, 118, 262
- Hollowell, Iben and Fujimoto (1990) Hollowell D., Iben, I.Jr. and Fujimoto, M.Y. 1990, ApJ, 351, 245
- Limongi and Chieffi (2002) Limongi, M. and Chieffi, A. 2002, P.A.S.A., 19, 1
- Limongi, Chieffi and Bonifacio (2003) Limongi, M., Chieffi, A. and Bonifacio, P. 2003, ApJ, 594, 123
- Marigo et al. (2001) Marigo, P., Girardi, L., Chiosi, C. and Wood, P.R. 2001, A&A, 371, 152
- Nakamura and Umemura (2002) Nakamura, F. and Umemura, M. 2002, ApJ, 569, 549
- Schlattl et al. (2001) Schlattl, H., Cassisi, S., Salaris, M. and Weiss, A. 2001, ApJ, 559, 1082
- Schlattl et al. (2002) Schlattl, H., Salaris, M., Cassisi, S. and Weiss, A. 2002, A&A, 395, 77
- Siess, Livio and Lattanzio (2002) Siess, L., Livio, M. and Lattanzio, J. 2002, ApJ, 570, 329
- Sweigart and Gross (1976) Sweigart, A.V. and Gross, P.G. 1976, ApJS, 32, 367
- Weiss et al. (2000) Weiss, A., Cassisi, S., Schlattl, H. and Salaris, M. 2000, ApJ, 533, 413
| (1) | (2) | (3) | (4) | (5) | |
|---|---|---|---|---|---|
| 0.8 | 0.8 | 0.8 | 0.8 | 1.0 | |
| Z | 0 | 0 | 0 | ||
| Y | 0.23 | 0.23 | 0.23 | 0.27 | 0.23 |
| H | 0.4718 | 0.4817 | 0.4440 | 0.3739 | 0.5161 |
| 0.5098 | 0.4968 | 0.5291 | 0.6077 | 0.4699 | |
| 0.517 | 0.543 | 0.547 | 0.496 | 0.498 | |
| 0.348 | 0.375 | 0.352 | 0.256 | 0.256 | |
| 2.45 | 2.77 | 2.98 | 2.38 | 2.37 | |
| 0.357 | 0.403 | 0.362 | 0.261 | ||
| 0.347 | 0.373 | 0.350 | 0.255 | ||
| 3.262 | 3.477 | 3.707 | 3.051 | ||
| 0.486 | 0.490 | 0.473 | 0.463 | ||
| 0.360 | 0.357 | 0.330 | 0.232 | ||
| 3.726 | 3.725 | 3.693 | 3.525 | ||
| 0.497 | 0.499 | 0.484 | |||
| 0.749 | 0.749 | 0.757 | |||