Tracing the relation between black holes and dark haloes
Abstract
We present new velocity dispersion measurements for a set of 12 spiral galaxies and use them to derive a more accurate relation which holds for a wide morphological range of galaxies. Combined with the relation, this relation can be used as a tool to estimate supermassive black hole (SMBH) masses by means of the asymptotic circular velocity. Together with the Tully-Fisher relation, it serves as a constraint for galaxy formation and evolution models.
Astronomical Observatory Ghent University, Krijgslaan 281 S9, 9000 Ghent, Belgium, Pieter.Buyle@UGent.be
During the past few years, fiducial mass estimates for the putative
SMBHs in the centre of galaxies have become available. These SMBH
masses were found to correlate closely to various properties of their
host galaxies (Kormendy et al. 1995; Ferrarese et al. 2000; Gebhardt
et al. 2000; Graham et al. 2001). Recently, Ferrarese (2002)
discovered a tight correlation between the central velocity dispersion
and the asymptotic circular velocity measured well into the dark
matter dominated region of spiral galaxies. Strikingly, this
correlation seems to be satisfied not only by spiral galaxies but also
by ellipticals. This indicates a link between the formation and
evolution of SMBHs and dark matter haloes.
We
took long-slit spectra of 12 galaxies with the EFOSC2 spectrograph on
the ESO 3.6 m telescope. We derived the central velocity dispersions
of the galaxies from the MgI and Fe lines around 520 nm. The
asymptotic circular velocities were taken from Palunas & Williams
(2000).
Using linear regression on our data combined with those of
Ferrarese (2002) we find the correlation
| (1) |
with a negligible intrinsic scatter of (see figure). We confirm that this relation holds over a large morphological range from late-type spirals to massive ellipticals, and that it appears to break down in the low mass regime ( km s-1). Combining the relation with the equally tight correlation that links the velocity dispersions and SMBH masses we obtain
| (2) |
where the most up-to-date relation (Tremaine et al. 2002) was used. This expression can serve as an easy tool to estimate the masses of SMBHs. As the asymptotic circular velocity is a measure for the total gravitational mass, the previous relation can be transformed into a relation between the masses of the SMBH and the dark halo. Considering state-of-the-art high-resolution CDM cosmological simulations (Bullock et al. 2001), we establish a non-linear link
| (3) |
In conclusion, the relation together with the and Tully-Fisher relations clearly points towards an intimate interplay between the various components of the galaxies and constitutes a strong test for galaxy formation and evolution models.
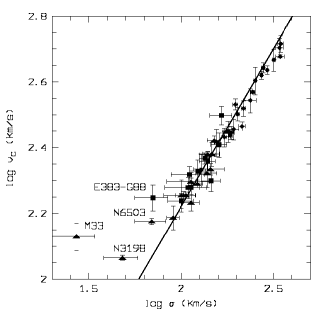
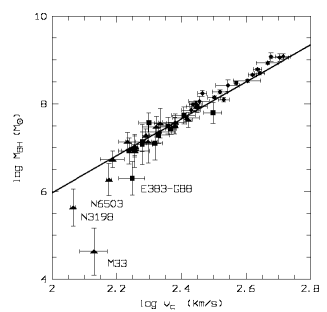
nawitter’s (2000) by circles and ours by squares. Both relations appear to break down for km s-1 or km s-1.
)
References
Baes, M., Buyle, P., Hau, G. & Dejonghe, H. 2003, MNRAS, 341, L44-L48
Bullock, J. S. et al. 2001, MNRAS, 321, 559
Ferrarese, L. & Merritt, D. 2000, ApJ, 539, L9
Ferrarese, L. 2002, ApJ, 578, 90
Gebhardt, K. et al. 2000, ApJ, 539, L13
Graham, A. W., Erwin, P., Trujillo, I. & Caon, N. 2001, ApJ, 563, L11
Kormendy, J. & Richstone, D. 1995, ARA&A, 33, 581
Kronawitter, A. et al. 2000, A&AS, 144, 53
Palunas, P. & Williams, T. B. 2000, AJ, 120, 2884
Tremaine, S. et al. 2002, ApJ, 574, 740